
 대표어
대표어


권호기사보기
| 기사명 | 저자명 | 페이지 | 원문 | 기사목차 |
|---|
결과 내 검색
동의어 포함
Title Page
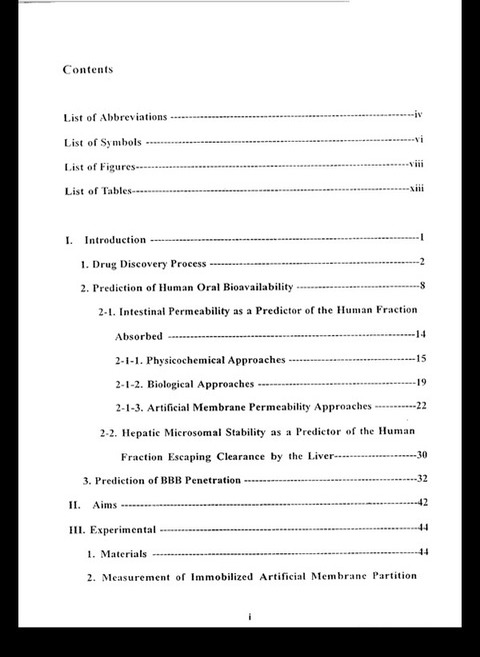
Contents
List of Abbreviations 6
List of Symbols 8
I. Introduction 18
1. Drug Discovery Process 19
2. Prediction of Human Oral Bioavailability 25
2.1 Intestinal Permeability as a Predictor of the Human Fraction Absorbed 31
2.2. Hepatic Microsomal Stability as a Predictor of the Human Fraction Escaping Clearance by the Liver 47
3. Prediction of BBB Penetration 49
II. Aims 59
III. Experimental 61
1. Materials 61
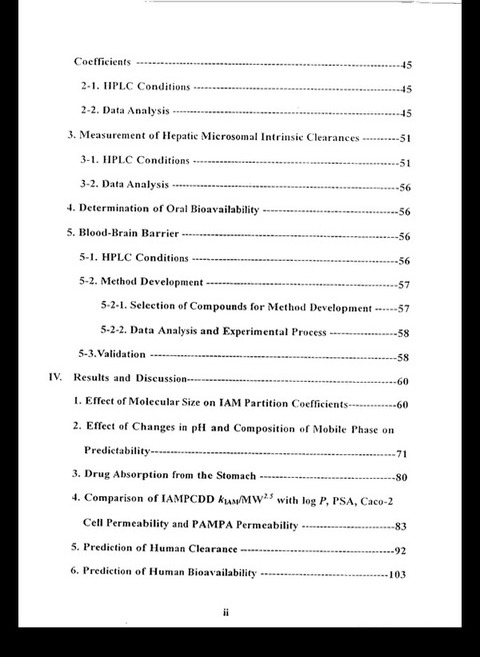
2. Measurement of Immobilized Artificial Membrane Partition Coefticients 62
2.1. HPLC Conuitiolls 62
2 2. Data Analysis 62
3. Measurement of Hepatic Microsomal Intrinsic Clearances 68
3.1. HPLC Conditions 68
3.2. Data Analysis 68
4. Determination of Oral Bioavailability 73
5. Blood-Brain Barrier 73
5.1. HPLC Conditions 73
5.2. Method Development 74
5.3. Validation 75
IV. Results and Discussion 77
1. Effect of Molecular Size on lAM Partition Coeflicients 77
2. Effect of Changes in pH and Composition of Mobile Phase on Predictability 88
3. Drug Absorption from the Stomach 97
4. Comparison of IAMPCDD kIAM/MW2.5 with log P, PSA, Caco-2 Cell Permeability and PAMPA Permeability(이미지참조) 100
5. Prediction of Human Clearance 109
6. Prediction of Human Bioavailability 120
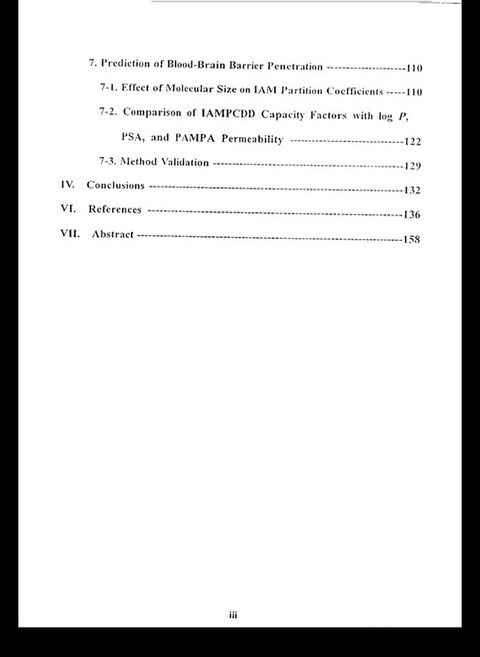
7. Prediction of BloodBrain Barrier Penetration 127
7.1. Effect of Molecular Size on lAM Partition Coefficients 127
7.2. Comparison of IAMPCDD Capacity Factors with log P, PSA, and PAMPA Permeability 139
7.3. Method Validation 146
V. Conelusions 149
VI. References 153
Abstract 175
Fig. I. The drug disco\"CI"y and development proccss. NeE: Nc\V ChemicalEntity; IND: Investigational New Drug; ND": New Drug Application 24
Fig. 2 Schematic represe ntation of the process of drug absorptiPIl fo li o\\ ingora l adm ini stration of drugs 30
Fig. 3. A filterimmobilized artificial membrane is llsed to model the cell membrane for passive transport of drug molecule 45
Fig. 4. Structure of phase of the lAM column packing materials commonly lIsed in drug discovery 46
Fig. 5. lliological barrier for eNS compounds 56
Fig. 6. Blood·brain barrier (BBB). Some nonpola r molecules sllch as glucose are transported out of the blood 57
Fig. 7. I3BB cell membranes (A) have less area for drug perlllc:"tion than othe r cell membranes (B) 58
Fig. 8. Fluid membrane and lAM drug part itionin g measu rements. Fluid membrane bilayer can be modeled by lAM column 67
Fig. 9. Representative chromatograms used for the calculation of klA .l/. Of 40 drugs tested, sample chromatograms for clonidine, naproxen. verupamil , indomethacin and progesterone are shown 83
Fig. 10. Relationship between the fraction of dose absorbed in humans (Fu) viii and k l.l.lI or kulI /1'viW: (A) log human F,,% "S. I ()~ kUIi . (1.\ ) I () ~ hUlll an F,,% vs . log (k/J.I/ IMW) 85
Fig. 11. Relationship between the fraction of dose " hslJrbed in hUlllans ( /'J and klA.'l;tvIW" as a po\\cr function of 11: (AJ po\\,〈:r function c, I; (lll po \\ e r functi on =2; (el power function =2.5 ; (D) p"m::r (un ction ,c~ . 6') 86
Fig. 12. Improvement of the correlation coenient (r) between the fraction o f close absorbed humans (Fa) and k/.H/IMWn as a power functi on of 11 87
Fig. 13. Relationship between the fraction o f dose absorbed in humans (Fa) 'lilt! k/AM IMW25 at different pH of the mobile phase: (Al pI! 25, 20% acetonitrile; (8) pH 5.5, 20% acetonitrile; (e) pH 7.0, 20% acetoni triic 93
Fig. 14. Rel ationship between the fraction of dose absorbed in hUlllans (Fa) and klAMIMW25 at different composition of the mobile phase: (A) pll 5.5. 5% acetonitrile; (B) pH 5.5, 10% acetonitrile; (e) pll S.D, 200 ";,aceton i tri Ie 95
Fig. 15. Effect of composition of the mobile phase on the permeability corrected for molecular size (kIAMIMW2 ;) 96
Fig. 16. Effect of pH on the permeability corrected for mo lecular size (k/1l1 IMW2 5) for groups of (A) acidic and (8) bas ic drugs 99
Fig. 17. Correlation between Caco2 permeability and IAMPCl)D G'pacity betors: (A) Caco2 vs. k₁AM/ MW2 5; (8) Caco2 vs k₁AM.(이미지참조) 104
Fig. 18. Correlation between log P and JAMPCDD capeKity fact"rs (A) log ['vs. kl.' II./MW25: (B) log P vs. k₁AM. 105
Fig. 19. Correlation between polar surface area (PS!\) anu JAMPCDD capacityfactors: (A) PSA vs. klW iMW25; (B) PSA \s. klill 107
Fig. 20. Correlation between PAMPA permeability and li\tvll'CDI) capacit)factors: (A) PAMPA vs. kl.4MIMW25; (B) PAMPA vs. kull 108
Fig. 21. Percentage (%) remaining during human microsomal incubation as a function of time determined for acetaminophen, atenolol, cefuroxime, and chlorpromazine 114
Fig. 22. Percentage (%) remaining during human microsomal incubation as a function of time determined for c1onidine, cromolyn, dexamethasone nd enalapril 115
Fig. 23. Percentage (%) remaining during human microsomal incubation as a function of time determined for etoposide, imipramine, nadolol and pra zos in 116
Fig. 24. Percentage (%) remaining during human microsomal incubation as a function of time determined for progesterone, propranolol, ranitidine and verapamil 117
Fig. 25. Correlation between the presystemic metabolism and hepatic extraction ratio (ERh)(이미지참조) 119
Fig. 26. Correlation between the predicted and the experimental oral bioavailability val ties 124
Fig. 27. Graph ical oral bioavailability of drugs in human estimated from their respective liver permeability and intestinal absorption 126
Fig: 28. Corre latio n of \!\MPCOO capaci ty fa ctors beteen pH 5.5 and pH 7.0 133
Fig. 29. Improveme nt of differe ntiation between CNS+ and eNS drugs as a function o f klAM/MWn with a power function of nat S'Vo acetonitrile (pi I 5.5) of the mobile phase: (A) power function ~ I , (13) powcrfunction=2; (e) power function~3; (D) power functiolFI; (E) power function= 5 134
Fig. 30. Improvement of differentiation between eNS+ and eNS drugs as a function o f klA" lMWn with a power function o f n at 10% acetonitrile (pH 5.5) of the mobile phase: (A) power function =1; (8) power function=2; (e) power function=3; (D) power function =4; (E) power function= 5 135
Fig. 31. Improvement of differentiation betwc.:n eNS+ and eNS d rugs as a function of kIA~I/MWn with a power fu nct ion of n at 20% ace tonitril e (pH 5. 5) of the mobile phase: (A) power fun ct i o n ~ l; (8) power function=2; (C) power function=3; (D) power Itlllctiun=4; (E) power function= 5 136
Fig. 32. Improvement of differentiation between eNS+ and eNS drugs as a !tlnction of klAMIMWn with a power function of n ,It 20% acetonitril e(pH 7.0) of the mobile phase: (!\) power func ti o n= I , (8) power function=2: (C) [lower function=J: (D) power function ~'f: (E) pOIVe r functi on= 5 137
Fig, 33. Corre lation between log P and IAMPCDD capacity factor (k₁AM /MW¹) (A) pH 5.5; (B) pH 7.0.(이미지참조) 143
Fig. 34. Correlation between polar surface area and IAMPCDD capacity factor (k₁AM/ MW⁴) (A) pH 5.5; (B) pH 7.0(이미지참조) 144
Fig. 35. Correlation between PAMPA and IAMPCDD capacity betor(k₁AM/ MW⁴) (A) pH 5.5 ; (B) pH 7.0 145
Fig. 36. Correlation between in vivo braintoplasma drug concentration ratios and in vitro CNS penetration(k₁AM/ MW⁴) 148
*표시는 필수 입력사항입니다.
| 전화번호 |
|---|
| 기사명 | 저자명 | 페이지 | 원문 | 기사목차 |
|---|
| 번호 | 발행일자 | 권호명 | 제본정보 | 자료실 | 원문 | 신청 페이지 |
|---|
도서위치안내: / 서가번호:

우편복사 목록담기를 완료하였습니다.
*표시는 필수 입력사항입니다.
저장 되었습니다.
