
 대표어
대표어


권호기사보기
| 기사명 | 저자명 | 페이지 | 원문 | 기사목차 |
|---|
결과 내 검색
동의어 포함
표제지
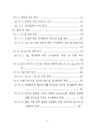
목차
I. 서론 10
I-1. 리튬 마이크로 전지 10
I-2. 리튬 마이크로 전지의 음극 물질 14
I-3. 접근 방법 16
II. 이론적 배경 18
II-1. 리튬 이차전지의 원리 18
II-2. Miedema's model 23
II-2-1. Si-M-M' 음극 박막 25
II-2-2. 기판(substrate) vs. 막(film) 26
III. 실험방법 33
III-1. 실험 장치 33
III-1-1. Sputtering system 33
III-1-2. Glove box 34
III-2. 시료 준비 38
III-2-1. 기판의 준비 38
III-2-2. Si, Si-M 박막의 증착 38
III-2-3. Si-M-M' 박막의 증착 39
III-2-4. 기판의 변화 39
III-3. 박막의 특성 평가 40
III-3-1. 박막의 조성 및 두께 40
III-3-2. 전기화학적 특성 평가 40
IV. 결과 및 고찰 42
IV-1. Si-M 박막 음극 42
IV-1-1. 조성에 따른 전기화학적 특성 및 균열 특성 42
IV-1-2. cut-off 전압 조절에 따른 전기화학적 특성 및 균열 특성 51
IV-2. Si-M-M' 박막 음극 55
IV-2-1. Ag 첨가량에 따른 전기화학적 특성 및 균열 특성 55
IV-3. 음의 바이어스 인가와 기판의 변화에 따른 Si-Zr-Ag 음극 박막 65
IV-4. 다층 박막 음극 73
IV-4-1. Si-Zr / Si-Zr 다층 박막 76
IV-5. 리튬 마이크로 전지의 제조 및 전기화학적 특성 84
IV-5-1. 역방향으로 제조된 리튬 마이크로 전지의 전기화학적 특성 84
IV-5-2. 음극과 전해질사이의 계면에 Li4Ti5O12를 삽입한 역방향 리튬 마이크로 전지의 전기화학적 특성(이미지참조) 87
IV-5-3. PES 기판위에 제조된 정방향의 리튬 마이크로 전지의 전기화학적 특성 89
V. 결론 92
참고문헌 94
Abstract 97
Fig. 1. Schematic diagram of Lithium Micro Rechargeable Battery 13
Fig. 2. Schematic representation of the lithium rechargeable battery 21
Fig. 3. Theoretical charging curve in single phase 22
Fig. 4. Equilibrium phase diagram of the Li-Si system 27
Fig. 5. Equilibrium phase diagram of the Si-Zr system 28
Fig. 6. Equilibrium phase diagram of the Ag-Zr system 29
Fig. 7. Equilibrium phase diagram of the Ag-Zr system 30
Fig. 8. Heat of formation calculated by Miedema's model 31
Fig. 9. Heat of formation calculated by Miedema's model 32
Fig. 10. Flow chart of the experimental process 35
Fig. 11. Schematic diagram of the sputtering system 36
Fig. 12. Schematic diagram of the glove box 37
Fig. 13. The first and second discharge (Lithium insertion) - charge (Lithium extraction) curves for the Si(-Zr) films 46
Fig. 14. Differential capacity curve of the second cycle of the Si(-Zr) thin films 47
Fig. 15. Capacity vs. cycle number of the Si(-Zr) thin films 48
Fig. 16. FESEM images of the Si(-Zr) thin films after 200 cycles 49
Fig. 17. Charge-discharge curve for second cycle of the Si68Zr32 sample applied to 0 - 1.5 V and 0.15 - 1.5 V cutoff voltage(이미지참조) 52
Fig. 18. Capacity vs. cycle number of the Si68Zr32 sample applied to 0 - 1.5 V and 0.15 - 1.5 V cutoff voltage(이미지참조) 53
Fig. 19. FESEM images Of the Si68Zr32 Sample applied to 0 - 1.5 V and 0.15 - 1.5 V cutoff voltage after 200 cycles(이미지참조) 54
Fig. 20. Charge-discharge curve for first(firtst) and second cycle of the Si-Zr(-Ag) thin films 59
Fig. 21. Differential capacity curve of the second cycle of the Si-Zr(-Ag) thin films 60
Fig. 22. The variation of discharge OCV (Open Circuit Voltage) as a function of Ag content for the Si-Zr(-Ag) thin films 61
Fig. 23. Capacity vs. cycle number of the Si-Zr(-Ag) thin films 62
Fig. 24. FESEM images of the Si-Zr(-Ag) thin films after 200 cycles 63
Fig. 25. Cross-sectional view FESEM images of Si-Zr-Ag thin film deposited with/without negative d.c. bias 68
Fig. 26. Capacity vs. cycle number of the Sample D3, E and F 70
Fig. 27. FESEM images of the Sample D3, E and F after 200 cycles 71
Fig. 28. Charge-discharge curve for second cycle of the Sample F 72
Fig. 29. Capacity vs. cycle number of the Si59Zr28Ag13 thin film with 4600 A thickness(이미지참조) 75
Fig. 30. Schematic diagram of the Si85Zr15 / Si58Zr42 multi-layer thin film(이미지참조) 78
Fig. 31. Capacity vs. cycle number of the Si85Zr15 / Si58Zr42 multi-layer thin film(이미지참조) 79
Fig. 32. FESEM images of the Si85Zr15 / Si58Zr42 multi-layer thin film after 53 cycles(이미지참조) 80
Fig. 33. Schematic diagram of the Si75Zr25 / Si58Zr42 multi-layer thin film(이미지참조) 81
Fig. 34. Cross-sectional view of the Si75Zr25 / Si58Zr42 multi-layer thin film on deposited at Si-wafer(이미지참조) 82
Fig. 35. Capacity vs. cycle number of the Si75Zr25 / Si58Zr42 multi-layer thin film(이미지참조) 83
Fig. 36. Charge-discharge curve for first cycle of the Ni foil / (Si-Zr/Si-Zr multilayer) / LiBPON / LiCoO₂ / Ni thin film battery 86
Fig. 37. Charge-discharge curve for first cycle of the Ni foil / (Si-Zr/si-Zr multilayer) / Li4Ti5O12 / LiBPON / LiCoO₂ / Ni thin film battery(이미지참조) 88
Fig. 38. Charge-discharge curve for first cycle of the PES / Pt / LiCoO₂ / LiBPON / Li4Ti5O12 / (Si-Zr/Si-Zr multilayer) / Ni thin film battery(이미지참조) 91
*표시는 필수 입력사항입니다.
| 전화번호 |
|---|
| 기사명 | 저자명 | 페이지 | 원문 | 기사목차 |
|---|
| 번호 | 발행일자 | 권호명 | 제본정보 | 자료실 | 원문 | 신청 페이지 |
|---|
도서위치안내: / 서가번호:

우편복사 목록담기를 완료하였습니다.
*표시는 필수 입력사항입니다.
저장 되었습니다.
