
 대표어
대표어


권호기사보기
| 기사명 | 저자명 | 페이지 | 원문 | 기사목차 |
|---|
결과 내 검색
동의어 포함
title page
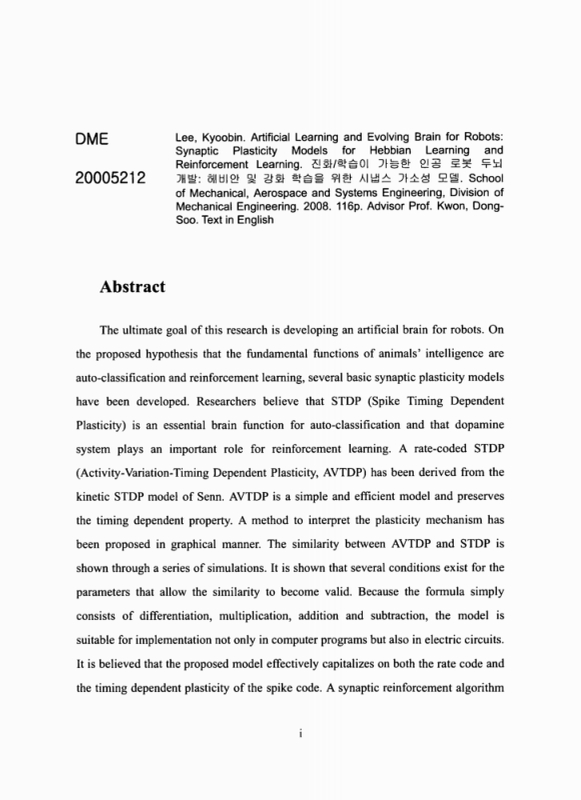
Abstract
Contents
Chapter I. Introduction 14
1.1. Biologically inspired artificial brain 14
1.2. Two essential components for artificial intelligence: Hebbian learning and reinforcement learning 17
Chapter II. Synaptic plasticity by Hebbian learning 20
2.1. Spike-based Hebbian learning: Spike-timing dependent plasticity 20
2.2. Rate-based Hebbian learning: Activity-variation-timing dependent plasticity(AVTDP) 27
2.2.1. General rate code of STDP 29
2.2.2. Simplified rate code of STDP: Activity-variation-timing dependent plasticity(AVTDP) 35
2.3. Graphical interpretation of simplified AVTDP 39
2.3.1. Physical meaning of terms of simplified VATDP 39
2.3.2. Formulation for graphical interpretation 42
2.3.3. Drawing(Rpre,Rpost)(이미지참조) curve 43
2.3.4. Examples for graphical interpretation 46
2.3.5 Comparision between AVTDP and STDP 50
Chapter III. Synaptic plasticity by reinforcement learning 58
3.1. Eligible synapse 60
3.2. Pre- and postsynaptic spike correlator (PPSC) 62
3.3. Simulation 69
Chapter IV. Synaptic plasticity in a dopamine neuron for reward prediction 78
4.1. Spike code for dopamine reward prediction 78
4.2. Rate code for dopamine reward prediction 83
Chapter V. Conclusions 85
Appendix A. Neuron model using a second order differential equation 88
Appendix B. Multiplicative neuron model 100
Appendix C. Slow update of synaptic efficacy 105
요약문(Summary in Korean) 109
References 112
감사의 글 119
Curriculum vitae 123
Figure 1.1.1. Summary of the developed synaptic plasticity rules (solid blocks) 17
Figure 2.1.1. Types of spike-timing dependent plasticity in several brain areas (reproduced from Abbot and Nelson, 2000, Nature Neurosci) 22
Figure 2.1.2. Spike-timing dependent plasticity 23
Figure 2.1.3. Schematic diagram of STDP model of Senn (Senn, 2001) 25
Figure 2.2.1. A block diagram for a rate code of STDP, Eq (2.2.6) 33
Figure 2.2.2. A modified diagram equivalent to the diagram of Fig. 2.2.1 33
Figure 2.2.3. A simplified diagram from Fig. 2..2 34
Figure 2.2.4. Final block diagram of general rate code of STDP 34
Figure 2.2.5. A simplified diagram from Fig. 2.2.4. by setting 36
Figure 2.3.1. Examples of neuron activities 40
Figure 2.3.2 A simple case of pre-and postsynaptic neuron activities 43
Figure 2.3.3. Procedure of drawing (Rpost, Rpre)(이미지참조) curve 45
Figure 2.3.4. Various neuron activities and corresponding (Rpost, Rpre)(이미지참조) curves 47
Figure 2.3.5. Division of an entangled (Rpost, Rpre)(이미지참조) curves of Fig. 4h 49
Figure 2.3.6. Role of the bilateral ter (II) of Eq. (2.3.1) 50
Figure 2.3.7. A smooth neuron activity and corresponding poisson spike train 52
Figure 2.3.8. A comparison between AVTDP and Senn's STDP algorithm 53
Figure 2.3.9. A comparison between AVTDP and Senn's STDP algorithm 54
Figure 2.3.10. Influence of deviated parameters 57
Figure 3.1.1. Determination of eligible synapses. The number denotes the order of firing time 61
Figure 3.2.1. A simple test of PSI and PPSC 64
Figure 3.2.2. Comparison between STDP and reinforcement learning 66
Figure 3.2.3. Synaptic modification using PPSC and reward 67
Figure 3.3.1. Simulation setup 71
Figure 3.3.2. Pseudo-code for simulation 72
Figure 3.3.3. Pseudo-code for simulation 74
Figure 3.3.4. The movement of the robot after 100 seconds of learning (drawn in the global coordinate of he workspace) 75
Figure 3.3.5. Transition of synaptic efficacies during learning 76
Figure 4.1.1. A block diagram of the proposed dopamine model 79
Figure 4.1.2. Simulation result under identical conditions to the animal experiment of Schultz et al 81
Figure 4.1.3. Simulation result under identical conditions to the animal experiment of Hollerman et al 82
Figure 4.2.1. Simulation results by the rate-code of the dopamine model 84
Figure A.1. Classification of neuron models 89
Figure A.2. Comparison between 1st order and 2nd order equations 94
Figure A.3. Alpha function 95
Figure A.4. The behavior of the proposed neuron model 98
Figure B.1. A example of a mulitiplicative neuron 101
Figure B.2. An example of instability of mulitiplicative neuron model 101
Figure B.3. A linearized equation using Taylor expansion 102
Figure B.4. Comparison between the proposed multiplicative model and an existing model 104
Figure C.1. Examples of slow update of synaptic plasticity with four differing time constants 106
Figure C.2. Integration of slows update is equal to the original update 107
*표시는 필수 입력사항입니다.
| 전화번호 |
|---|
| 기사명 | 저자명 | 페이지 | 원문 | 기사목차 |
|---|
| 번호 | 발행일자 | 권호명 | 제본정보 | 자료실 | 원문 | 신청 페이지 |
|---|
도서위치안내: / 서가번호:

우편복사 목록담기를 완료하였습니다.
*표시는 필수 입력사항입니다.
저장 되었습니다.
