권호기사보기
| 기사명 | 저자명 | 페이지 | 원문 | 기사목차 |
|---|
| 대표형(전거형, Authority) | 생물정보 | 이형(異形, Variant) | 소속 | 직위 | 직업 | 활동분야 | 주기 | 서지 | |
|---|---|---|---|---|---|---|---|---|---|
| 연구/단체명을 입력해주세요. | |||||||||
|
|
|
|
|
|
* 주제를 선택하시면 검색 상세로 이동합니다.
Title Page
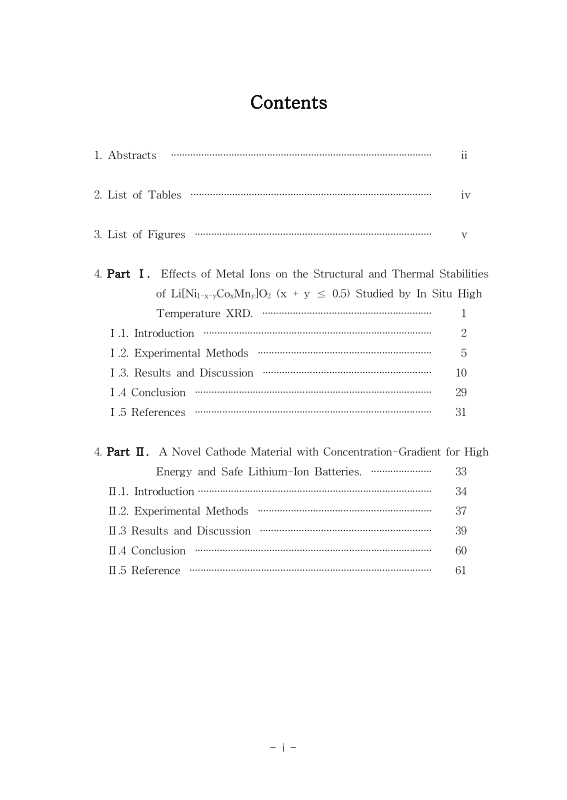
Contents
Abstract 5
Part Ⅰ. Effects of Metal Ions on the Structural and Thermal Stabilities of Li[Ni1-x-yCoxMny]O₂ (x + y ≤ 0.5) Studied by In Situ High Temperature XRD.(이미지참조) 13
Ⅰ. 1. Introduction 14
Ⅰ. 2. Experimental Methods 17
Ⅰ. 3. Results and discussio 22
Ⅰ. 4. Conclusion 41
Ⅰ. 5. References 43
Part Ⅱ. A Novel Cathode Material with Concentration-Gradient for High Energy and Safe Lithium-Ion Batteries. 45
Ⅱ.1. Introduction 46
Ⅱ.2. Experimental Methods 49
Ⅱ.3. Results and Discussion 51
Ⅱ.4. Conclusion 72
Ⅱ.5. Reference 73
연구 윤리 서약서 75
감사의 글 77
Part Ⅰ. Effects of Metal Ions on the Structural and Thermal Stabilities of Li[Ni1-x-yCoxMny]O₂ (x + y ≤ 0.5) Studied by In Situ High Temperature XRD.(이미지참조) 8
Figure Ⅰ-1. XRD patterns of the Li[Ni0.6Co0.2Mn0.2]O₂, Li[Ni0.55Co0.15 Mn0.3]O₂, and Li[Ni0.5Co0.25Mn0.25]O₂ samples prepared via coprecipitation.(이미지참조) 23
Figure Ⅰ-2. Charge and discharge curves ofLi/Li[Ni0.6Co0.2Mn0.2]O₂, Li/Li[Ni0.55Co0.15Mn0.3]O₂, and Li/Li[Ni0.5Co0.25Mn0.25]O₂ cells obtained at fifth cyclete sted in the voltage ranges of 3.0 - 4.3 V at 25 ℃.(이미지참조) 24
Figure Ⅰ-3. XRD patterns of the chemically delithiated samples at (a) 2θ = 10 - 80, (b) 2θ = 17 - 20, (c) 2θ = 17 - 20, and (d) 2θ = 17 - 20o (a: Li[Ni0.6Co0.2Mn0.2]O₂, b: Li[Ni0.55Co0.15Mn0.3]O₂, c: Li[Ni0.5Co0.25Mn0.25]O₂, a': Li0.51[Ni0.6Co0.2Mn0.2]O₂,and c': Li0.5[Ni0.5Co0.25Mn0.25]O₂).(이미지참조) 26
Figure Ⅰ-4. TGA results of chemically delithiated Li0.51[Ni0.6Co0.2Mn0.2] O₂, Li0.49[Ni0.55Co0.15Mn0.3]O₂, and Li0.5[Ni0.5Co0.25 Mn0.25]O₂ samples: (a) mass loss and (b) differential mass loss as a function of temperature at a scan rate of 5℃ min-1.(이미지참조) 28
Figure Ⅰ-5. In situ high-temperature powderXRD patterns ofthe chemically delithiated (a) Li0.51[Ni0.6Co0.2Mn0.2]O₂, (b) Li0.49[Ni0.55Co0.15 Mn0.3]O₂, and (c) Li0.5[Ni0.5Co0.25Mn0.25]O₂ samples for 2θ ranging from 10 to 80˚.(이미지참조) 30
Figure Ⅰ-6. Expanded in situ high-temperature powder XRD patterns of the chemically delithiated (a) Li0.51[Ni0.6Co0.2Mn0.2]O₂, (b)Li0.49[Ni0.55 Co0.15Mn0.3]O₂, and (c) Li0.5[Ni0.5Co0.25Mn0.25]O₂ samples for 2θ ranging from 56 to72˚.(이미지참조) 32
Figure Ⅰ-7. Expanded in situ high-temperature powder XRD patterns of the chemically delithiated (a) Li0.51[Ni0.6Co0.2Mn0.2]O₂, (b) Li0.49[Ni0.55 Co0.15Mn0.3]O₂, and (c) Li0.5[Ni0.5Co0.25Mn0.25]O₂ samples for 2θ ranging from 42 to 52˚.(이미지참조) 33
Figure Ⅰ-8. Expanded in situ high-temperature powder XRD patterns of the chemically delithiated (a) Li0.51[Ni0.6Co0.2Mn0.2]O₂, (b) Li0.49[Ni0.55 Co0.15Mn0.3]O₂, and (c) Li0.5[Ni0.5Co0.25Mn0.25]O₂ samples examining the (003) peak shift.(이미지참조) 34
Figure Ⅰ-9. DSC of Li[Ni0.6Co0.2Mn0.2]O₂, Li[Ni0.55Co0.15Mn0.3]O₂, and Li [Ni0.5Co0.25Mn0.25]O₂ electrode electrochemically charged to 4.3 V at a scan rate of 5 ℃ min-1.(이미지참조) 36
Figure Ⅰ-10. Discharge capacity vs cycle number of Li/Li[Ni0.6Co0.2 Mn0.2]O₂, Li/Li[Ni0.55Co0.15Mn0.3]O₂, and Li/Li[Ni0.5Co0.25 Mn0.25]O₂ cells cycled at (a) 25 and (b) 55 ℃ in the voltage range of 3.0-4.3 V.(이미지참조) 38
Figure Ⅰ-11. Differential capacity vs voltage of (a) Li/Li[Ni0.6Co0.₂ Mn0.2]O₂, (b) Li/Li[Ni0.55Co0.15Mn0.3]O₂, and (c) Li/Li[Ni0.5Co0.25 Mn0.25]O₂ cell cycled at 55 ℃ in the voltage range of 3.0 - 4.3 V.(이미지참조) 39
Part Ⅱ. A Novel Cathode Material with Concentration-Gradient for High 11
Figure Ⅱ-1. Cross-sectional SEM image of the (a) core (Ni0.8Co0.2) (OH)₂ and (b) core-shell hydroxide with concentration- gradient shell particles. 52
Figure Ⅱ-2. EPMA compositional change from across-section of the core-shell hydroxide with concentration-gradient shell particle. 53
Figure Ⅱ-3. SEM images of the (a) core Li[Ni0.8Co0.2]O₂ and (b) lithiated core-shell oxide at low magnification and cross-sectional images of the (c) core Li[Ni0.8Co0.2]O₂ and (d) lithiated core-shell oxide with concentration-gradient shell particles.(이미지참조) 54
Figure Ⅱ-4. EPMA compositional change from a cross-section of lithiated core-shell oxide with concentration-gradient shell particle. 57
Figure Ⅱ-5. XRD patterns of the (a) Li[Ni0.8Co0.2]O₂, (b) CGS Li[Ni0.72 Co0.18Mn0.10]O₂, and (c) Li[Ni0.55Co0.15Mn0.30]O₂.(이미지참조) 59
Figure Ⅱ-6. Initial charge-discharge curves for the Li/Li[Ni0.8Co0.2]O₂, CGS Li[Ni0.72Co0.18Mn0.10]O₂, andLi[Ni0.55Co0.15Mn0.30]O₂ cells.(이미지참조) 61
Figure Ⅱ-7. Discharge capacity vs cycle numberforthe Li/Li[Ni0.8 Co0.2]O₂, CGS Li[Ni0.72Co0.18Mn0.10]O₂, and Li[Ni0.55Co0.15Mn0.30] O₂ cells with a voltage range of 3.0 - 4.3 V at 55 ℃.(이미지참조) 63
Figure Ⅱ-8. (a) Electron diffraction, indexed to 001 zone of a spinel structure, (b) TEM bright field image, (c) high-resolution TEM image from the cycled Li[Ni0.8Co0.2]O₂ electrode (Marked region in (c) high lights the highly ordered region while the arrow indicates the... 65
Figure Ⅱ-9. DSC traces of the Li/Li[Ni0.8Co0.2]O₂, CGS Li[Ni0.72Co0.18 Mn0.10]O₂, and Li[Ni0.55Co0.15Mn0.30]O₂ cells.(이미지참조) 68
Figure Ⅱ-10. Accelerating rate calorimetry (ARC) results of Li-ion cells comprising Li[Ni0.8Co0.2]O₂ and CGS Li[Ni0.72Co0.18 Mn0.10]O₂; (a) celltemperature profile vs realtime and (b) self-heating rate (SHR) vs temperature.(이미지참조) 69
*표시는 필수 입력사항입니다.
| 전화번호 |
|---|
| 기사명 | 저자명 | 페이지 | 원문 | 기사목차 |
|---|
| 번호 | 발행일자 | 권호명 | 제본정보 | 자료실 | 원문 | 신청 페이지 |
|---|
도서위치안내: / 서가번호:

우편복사 목록담기를 완료하였습니다.
*표시는 필수 입력사항입니다.
저장 되었습니다.
