권호기사보기
기사명 | 저자명 | 페이지 | 원문 | 기사목차 |
---|
대표형(전거형, Authority) | 생물정보 | 이형(異形, Variant) | 소속 | 직위 | 직업 | 활동분야 | 주기 | 서지 | |
---|---|---|---|---|---|---|---|---|---|
연구/단체명을 입력해주세요. |
|
|
|
|
|
* 주제를 선택하시면 검색 상세로 이동합니다.
Title Page
국문요지
ABSTRACT
Contents
Chapter 1. Introduction 19
1.1. Motivation 19
1.2. Organization 20
1.3. References 22
Chapter 2. Backgrounds of Research 25
2.1. Introduction 25
2.2. Device Characteristics of OLED 25
2.2.1. Basic Structure of OLED 25
2.2.2. Operational Principle of OLED 26
2.2.3. Electrical and Optical Characteristics of OLED 27
2.3. Basic Driving Methods of OLED 33
2.3.1. Current Driving Method 33
2.3.2. Voltage Driving Method 33
2.4. Device Characteristics of Backplane TFTs 34
2.4.1. Characteristics of a-Si:H TFTs 34
2.4.2. Characteristics of poly-Si TFTs 38
2.5. Basic Pixel Structures of AMOLED 42
2.5.1. P-type Driving TFT Pixel Structure 42
2.5.2. N-type Driving TFT Pixel Structure 48
2.6. Summary and Discussions 51
2.7. References 52
Chapter 3. Prior Driving Methods and Their Problems 56
3.1. Introduction 56
3.2. Prior Compensation Methods for Poly-Si TFT Backplane 56
3.2.1. Voltage Programming Pixel 56
3.2.2. Current Programming Pixel 58
3.2.3. Digital Driving Pixel 59
3.2.4. Optical Feedback Pixel 64
3.3. Prior Compensation Methods for a-Si:H TFT Backplane 65
3.3.1. Threshold Voltage Compensation Pixel 65
3.3.2. Threshold Voltage Compensation Pixel with Shift Annealing 67
3.3.3. Optical Feedback Method 69
3.4. Summary and Discussions 71
3.5. References 71
Chapter 4. Proposed Driving Methods for High Image Quality AMOLED Displays 76
4.1. Introduction 76
4.2. Proposed Luminance Adjusting Method for AMOLED Displays on Poly-Si TFT Backplane 76
4.3. Proposed Electrical Characteristic Sensing and Compensation Method for AMOLED Displays on Poly-Si TFT Backplane 83
4.4. Proposed Device Characteristic Adjusting Method for AMOLED Displays on a-Si:H TFT Backplane 96
4.5. Summary and Discussions 100
4.6. References 101
Chapter 5. Design of Driver ICs for Proposed Driving Methods 102
5.1. Introduction 102
5.2. Driving System for Proposed Methods 102
5.3. Design of Data Driver ICs for Proposed Methods 105
5.3.1. Design of clock buffer 109
5.3.2. Bias Generation Block 111
5.3.3. Voltage DAC 117
5.3.4. Voltage ADC 121
5.3.5. Measurement Results of driver IC 127
5.4. Summary and Discussions 131
5.5. References 132
Chapter 6. Experimental Results of Proposed Methods 133
6.1. Introduction. 133
6.2. Experimental Results of Luminance Adjusting Method 133
6.3. Experimental Results of Electrical Characteristic Sensing and Compensation Method 136
6.4. Experimental Results of Device Characteristic Adjusting Method 149
6.5. Summary and Discussions 152
Chapter 7. Conclusions and Future Work 153
7.1. Conclusions 153
7.2. Future Work 154
Figure 2.1: Basic structure of OLED device. 26
Figure 2.2: Energy band diagram of OLED device. 27
Figure 2.3: Current density with respect to anode-to-cathode voltage of OLED device. 28
Figure 2.4: Luminance with respect to current density of OLED device. 28
Figure 2.5: OLED capacitance with respect to applied voltage between anode and cathode. 29
Figure 2.6: Current density with respect to anode-to-cathode voltage of OLED device when temperature is 20, 40, and 80°C. 29
Figure 2.7: Luminance with respect to current density of OLED device when temperature varies from -30 to 50°C. 30
Figure 2.8: Luminance and anode-to-cathode voltage of OLED device with respect to time on constant current stress condition. 31
Figure 2.9: Luminance and current of OLED device with respect to time on constant voltage stress condition. 31
Figure 2.10: Luminance degradation of red, green, and blue OLED devices with respect to time on constant current stress condition. 32
Figure 2.11: Luminance degradation of OLED devices with respect to time on various constant current stress conditions. 32
Figure 2.12: Cross-section view of bottom gate a-Si:H TFT. 35
Figure 2.13: (a) Measured ID-VDS curve with VGS as a parameter and (b) ID-VGS curve of a-Si:H TFT.(이미지참조) 36
Figure 2.14: Charge picture in the cross-section of a-Si:H TFT when high negative bias is applied to VGS.(이미지참조) 37
Figure 2.15: Measured threshold voltage shift of a-Si:H TFT with respect to time on various stress conditions. 37
Figure 2.16: Cross-section view of top gate poly-Si TFT device. 39
Figure 2.17: (a) ID-VD curve with VG as a parameter and (b) ID-VSG curve of p-type poly- Si TFT(이미지참조) 40
Figure 2.18: Measured ID-VSG curve of p-type poly-Si TFT on various VSD conditions(이미지참조) 41
Figure 2.19: (a) Threshold voltage and (b) mobility variations of p-type poly-Si TFTs. 41
Figure 2.20: (a) Schematic and (b) timing diagrams of basic p-type driving TFT pixel structure of AMOLED. 43
Figure 2.21: Resistor modeling of ELVDD line of pixel array on AMOLED panel. 45
Figure 2.22: Cross-section view AMOLED pixel structure of bottom emission type. 46
Figure 2.23: Cross-section view AMOLED pixel structure of top emission type. 47
Figure 2.24: Luminance variation of the large size display panel due to the ELVSS IRdrop when the ELVSS is applied from the edge of the top emission type AMOLED display panel when the highest gray level is displayed on the screen. 48
Figure 2.25: Schematic and timing diagrams of basic n-type driving TFT pixel structure of AMOLED. 49
Figure 2.26: Schematic diagram of n-type driving TFT pixel structure with inverted OLED. 50
Figure 2.27: Cross-section view AMOLED pixel structure with inverted OLED. 50
Figure 3.1: (a) Schematic and (b) timing diagrams of the voltage programming pixel. 57
Figure 3.2: (a) Schematic and (b) timing diagrams of the current programming pixel. 59
Figure 3.3: (a) Schematic diagram of digital driving pixel and (b) its timing diagram for a frame time and (c) for a sub-frame time. 61
Figure 3.4: (a) A timing diagram of red, green, and blue pixels and (b) an example of the color breaking 62
Figure 3.5: Examples of (a) original image and (b) the image with the false contour noise. 63
Figure 3.6: (a) Schematic and (b) timing diagrams of the optical feedback pixel. 65
Figure 3.7: (a) Schematic and (b) timing diagrams of the threshold voltage compensation pixel. 66
Figure 3.8: (a) Schematic and (b) timing diagrams of threshold voltage compensation pixel with shift annealing 68
Figure 3.9: (a) Schematic and (b) timing diagrams of optical feedback pixel. 70
Figure 4.1: Pixel structure for the proposed luminance adjusting method. 78
Figure 4.2: Comparison of measured luminance of OLED with respect to VSG of T1 in the pixel and ideal curve using the equation (4.1).(이미지참조) 78
Figure 4.3: (a) Block diagram of the systems for the luminance sensing operation, and the timing diagrams of (b) the first luminance sensing step and (c) the second luminance sensing step of the luminance adjusting method. 80
Figure 4.4: (a) Block diagram of the systems and (b) timing diagram for the display operation of the luminance adjusting method. 82
Figure 4.5: Examples of (a) displaying a still image for a long time and (b) the image sticking of the previous image due to the differential aging of OLED while the different image is displayed on the screen. 84
Figure 4.6: Comparison of measured ID-VSG characteristic of p-type poly-Si TFT and ideal curve calculated by the current equation (4.11).(이미지참조) 85
Figure 4.7: Measured drain current of long channel poly-Si TFT with respect to time after the initial aging is performed. 85
Figure 4.8: Measured anode voltage increment with respect to normalized luminance of OLED device under the condition of 1mA/㎠ current stress. 86
Figure 4.9: Flowchart of the sensing and displaying sequence for the proposed electrical characteristic sensing and compensation method. 87
Figure 4.10: Block diagram of the driving system and the schematic diagram of pixel for electrical characteristic sensing and compensation method. 88
Figure 4.11: The formation of the dummy OLED array at the top edge row line of the panel. 88
Figure 4.12: Timing diagram during (a) TFT sensing operation, (b) OLED sensing operation, and (c) display operation of the electrical characteristic sensing and compensation method. 90
Figure 4.13: Measured anode voltage decrement of 0% degraded dummy OLED and 50% degraded pixel OLED as the function of the temperature under the condition of 1 mA/㎠ current sourcing. The measured anode voltage difference from the voltage at 20°C is plotted. 91
Figure 4.14: Measured anode voltage increment of the OLED with respect to the luminance of OLED on 1 mA/㎠ and 2 mA/㎠ DC current stress conditions. Two OLEDs are stressed differently with 1 mA/㎠ and 2 mA/㎠, but the anode voltage increment of OLED is measured with same level of reference current forcing. 92
Figure 4.15: An alternative simple pixel structure for the electrical characteristic sensing and compensation method. 94
Figure 4.16: Timing diagram during (a) TFT sensing operation, (b) OLED sensing operation, and (c) display operation for the alternative simple pixel structure of the electrical characteristic sensing and compensation method. 95
Figure 4.17: (a) Block diagram of driving system and schematic diagram of pixel for device characteristic adjusting method and (b) its timing diagram for a frame time. 97
Figure 4.18: Timing diagrams for (a) displaying pixels, (b) threshold voltage comparing pixels, and (c) threshold voltage adjusting pixels. 99
Figure 5.1: Block diagram of display system for luminance adjusting method 103
Figure 5.2: Block diagram of display system for electrical characteristic sensing and compensation method.(이미지참조) 104
Figure 5.3: Block diagram of display system for device characteristic adjusting method. 105
Figure 5.4: Block diagram of data driver IC for the proposed luminance adjusting method. 106
Figure 5.5: Block diagram of data driver IC for the proposed electrical characteristic sensing and compensation method. 107
Figure 5.6: Block diagram of data driver IC for proposed video data modulation methods. 108
Figure 5.7: Capacitance modeling of signal line. 109
Figure 5.8: Schematic diagram of T3 line load model. 110
Figure 5.9: Simulation results of DIG_BUFF block with output load: (a) voltage of input and output nodes and (b) peak current of signal line. 110
Figure 5.10: Block diagram of bandgap reference generator block. 111
Figure 5.11: Schematic diagram of BANDGAP block. 112
Figure 5.12: Schematic diagram of BIAS AMP. 112
Figure 5.13: Schematic diagram of (a) VICON_RGB and (b) current fitting blocks. 114
Figure 5.14: Simulation results of iout_amp current with respect to temperature. 115
Figure 5.15: Simulation results of iout_amp current with respect to temperature in various ref_sel 〈0:2〉 inputs. 115
Figure 5.16: Schematic diagram of AMP and ADC bias generator block. 116
Figure 5.17: Schematic diagram of output stage bias block. 116
Figure 5.18: Schematic diagram of Amp block. 118
Figure 5.19: Gain and phase margin simulation results of operational amplifier. 119
Figure 5.20: Transient simulation results of operational amplifier. 119
Figure 5.21: Simulated INL of voltage DAC. 120
Figure 5.22: Simulated DNL of voltage DAC. 120
Figure 5.23: Schematic diagram of comparator block. 122
Figure 5.24: Simulation results of (a) gain and (b) phase of the comparator with respect to frequency 123
Figure 5.25: Simulation results of the transfer curve of the comparator (a) on the ideal case, (b) on the worst positive offset case, and (a) on the worst positive offset case with the AOC. 124
Figure 5.26: Simulation results of the transfer curve of the comparator (a) on the ideal case, (b) on the worst negative offset case, and (a) on the worst negative offset case with the AOC. 125
Figure 5.27: Transient simulation results of the ADC block. 126
Figure 5.28: Measured INL of the output voltage of the driver IC. The offset voltage of even frame and odd frame are averaged. 128
Figure 5.29: Measured DNL of the output voltage of the driver IC. The offset voltage of even frame and odd frame are averaged. 128
Figure 5.30: Measured output voltage error from the ideal voltage with respect to channel of the driver IC. The output voltages of even frame and odd frame are averaged. 129
Figure 5.31: Measured channel-to-channel differential deviation of output voltages of the driver IC. The output voltages of even frame and odd frame are averaged. 129
Figure 5.32: Measured channel-to-channel differential deviation of IOLED.(이미지참조) 130
Figure 5.33: Measured channel-to-channel differential deviation of IMAX of red, green, and blue colors. 130
Figure 5.34: Measured channel-to-channel differential deviation of IMIN of red, green, and blue colors.(이미지참조) 131
Figure 6.1: Photograph of the driving system with the 3.7-inch AMOLED panel. 134
Figure 6.2: Measured luminance of the panel of the middle gray level using (a) the conventional method and (b) the luminance adjusting method. 135
Figure 6.3: Photographs of the panel using the luminance adjusting method displaying various images. 135
Figure 6.4: (a) Schematic diagram and (b) photograph of fabricated AMOLED test pixel with 4 TFT and 1 capacitor for the proposed electrical characteristic sensing and compensation method. 137
Figure 6.5: (a) Measured drain current of T1 with respect to source-to-gate voltage of T1 in two different pixels with 4 TFT and 1 capacitor structure using conventional driving and (b) drain current of T1 with respect to gray when the proposed electrical characteristic sensing and compensation method is used. 138
Figure 6.6: Photographs of initial and 50% degraded OLEDs of high middle, and low gray levels with and without the electrical characteristic sensing and compensation method. 139
Figure 6.7: (a) Schematic diagram and (b) photograph of fabricated AMOLED test pixel with 4 TFT and 1 capacitor for the proposed electrical characteristic sensing and compensation method. 140
Figure 6.8: Block diagram of measurement setup for test pixels for electrical characteristic sensing and compensation method. 141
Figure 6.9: (a) Measured drain current of T1 in 3-TFT 1-capacitor pixel with respect to source-to-gate voltage of T1 in four different pixels using conventional driving and (b) drain current of T1 with respect to gray level when the proposed electrical characteristic sensing and compensation method is used. 142
Figure 6.10: Measured luminance of OLEDs of 0% and 50% degradation in 3-TFT 1- capacitor pixel with respect to gray level without and (b) with the proposed electrical characteristic sensing and compensation method. 143
Figure 6.11: Block diagram of test board for electrical characteristic sensing and compensation method. 144
Figure 6.12: Photographs of (a) organized test board and backside of the AMOLED panel. 145
Figure 6.13: Measured drain current of driving TFTs in three samples as the function of gray level (a) without and (b) with the electrical characteristic sensing and compensation method. 147
Figure 6.14: Luminance of the portion of the panel with and without the electrical characteristic sensing and compensation method. 148
Figure 6.15: Display image of the AMOLED panel when video data with same gray level is applied to every pixel (a) without and (b) with the electrical characteristic sensingand compensation method. 148
Figure 6.16: (a) Schematic diagram and (b) photograph of fabricated AMOLED test pixel for the proposed device characteristic adjusting method. 149
Figure 6.17: Block diagram of the measurement setting for the proposed device adjusting method. 150
Figure 6.18: (a) Initial ID-VGS curve of T1 in three different pixels and (b) when the proposed device adjusting method is used.(이미지참조) 151
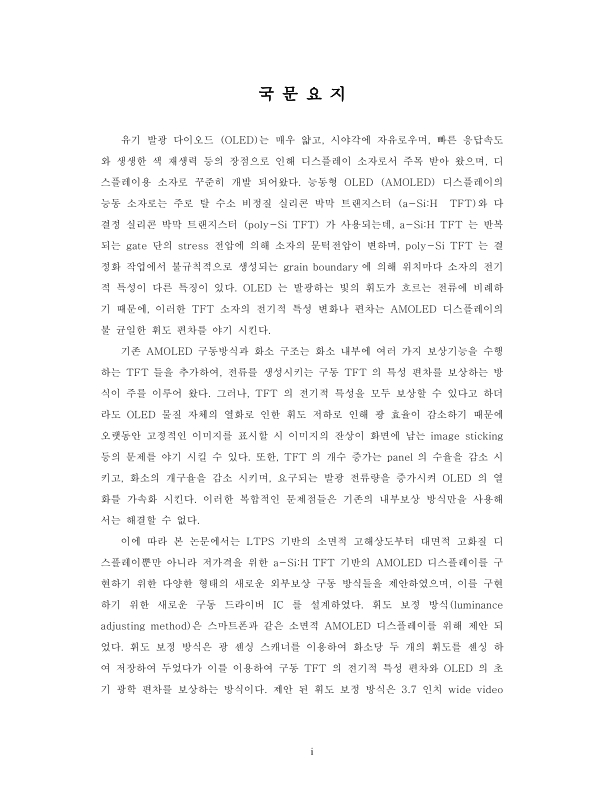
유기 발광 다이오드 (OLED)는 매우 얇고, 시야각에 자유로우며, 빠른 응답속도와 생생한 색 재생력 등의 장점으로 인해 디스플레이 소자로서 주목 받아 왔으며, 디스플레이용 소자로 꾸준히 개발 되어왔다. 능동형 OLED (AMOLED) 디스플레이의 능동 소자로는 주로 탈수소 비정질 실리콘 박막 트랜지스터 (a-Si:H TFT)와 다결정 실리콘 박막 트랜지스터 (poly-Si TFT) 가 사용되는데, a-Si:H TFT 는 반복되는 gate 단의 stress 전압에 의해 소자의 문턱전압이 변하며, poly-Si TFT 는 결정화 작업에서 불규칙적으로 생성되는 grain boundary 에 의해 위치마다 소자의 전기적 특성이 다른 특징이 있다. OLED 는 발광하는 빛의 휘도가 흐르는 전류에 비례하기 때문에, 이러한 TFT 소자의 전기적 특성 변화나 편차는 AMOLED 디스플레이의불 균일한 휘도 편차를 야기 시킨다.
기존 AMOLED 구동방식과 화소 구조는 화소 내부에 여러 가지 보상기능을 수행하는 TFT 들을 추가하여, 전류를 생성시키는 구동 TFT 의 특성 편차를 보상하는 방식이 주를 이루어 왔다. 그러나 TFT 의 전기적 특성을 모두 보상할 수 있다고 하더라도 OLED 물질 자체의 열화로 인한 휘도 저하로 인해 광 효율이 감소하기 때문에 오랫동안 고정적인 이미지를 표시할 시 이미지의 잔상이 화면에 남는 image sticking등의 문제를 야기 시킬 수 있다. 또한, TFT 의 개수 증가는 panel 의 수율을 감소시키고, 화소의 개구율을 감소시키며, 요구되는 발광 전류량을 증가시켜 OLED 의 열화를 가속화 시킨다. 이러한 복합적인 문제점들은 기존의 내부보상 방식만을 사용해서는 해결할 수 없다.
이에 따라 본 논문에서는 LTPS 기반의 소면적 고해상도부터 대면적 고화질 디스플레이뿐만 아니라 저가격을 위한 a-Si:H TFT 기반의 AMOLED 디스플레이를 구현하기 위한 다양한 형태의 새로운 외부보상 구동 방식들을 제안하였으며, 이를 구현하기 위한 새로운 구동 드라이버 IC 를 설계하였다. 휘도 보정 방식(luminance adjusting method)은 스마트폰과 같은 소면적 AMOLED 디스플레이를 위해 제안 되었다. 휘도 보정 방식은 광 센싱 스캐너를 이용하여 화소당 두 개의 휘도를 센싱 하여 저장하여 두었다가 이를 이용하여 구동 TFT 의 전기적 특성 편차와 OLED의 초기 광학 편차를 보상하는 방식이다. 제안 된 휘도 보정 방식은 3.7 인치 wide videographics array (WVGA) 해상도의 AMOLED 패널을 통해 검증하였으며 패널의 휘도 편차가 7.01 LSB 에서 1.81 LSB 로 향상 되는 결과를 얻었다.
전기적 특성 센싱 및 보상 방식 (electrical characteristic sensing and compensation method)은 노트북이나 모니터와 같은 중대면적 AMOLED 디스플레이를 위해 제안 되었다. 전기적 특성 센싱 및 보상 방식은 구동 TFT 와 OLED 의 전기적 특성을 센싱 하여 저장해 두었다가 이를 이용하여 구동 TFT 의 전기적 특성 편차와 OLED 의 열화를 보상하는 방식이다. 제안 된 전기적 특성 센싱 및 보상 방식은14.1 인치 high definition (HD) 해상도의 AMOLED 패널을 통해 검증하였으며, -1.1% 에서 1.2% 사이의 매우 좋은 휘도 편차를 얻었다.
소자 특성 조절 방식(device characteristic adjusting method)은 a-Si:H TFT기반의 대면적 AMOLED 디스플레이를 위해 제안 되었다. 소자 특성 조절 방식은 모든 화소 내 a-Si:H TFT 의 문턱전압을 같은 값으로 조절함으로써, 발광 전류의 균일도를 향상 시키고, a-Si:H TFT 의 문턱전압 변화 문제를 해결하려는 방식이다. 제안된 전기적 특성 센싱 및 보상 방식은 a-Si:H TFT 기반의 테스트 화소 들을 이용하여 검증하였으며, 초기 전류 편차가 -16.3% 에서 8.6% 사이를 가지던 것이 -0.5%에서 0.8% 사이의 편차로 향상 되는 결과를 보였다.
이러한 제안 된 외부보상 AMOLED 구동 방식들은 고속구동 가능성과 간단한 화소 구조로 인한 panel 의 수율 향상, 그리고 고화질 저가격 디스플레이의 구현 가능성으로 인해 앞으로 다양한 형태의 AMOLED 디스플레이 panel 에 응용되어 사용 될 것으로 기대된다.*표시는 필수 입력사항입니다.
*전화번호 | ※ '-' 없이 휴대폰번호를 입력하세요 |
---|
기사명 | 저자명 | 페이지 | 원문 | 기사목차 |
---|
번호 | 발행일자 | 권호명 | 제본정보 | 자료실 | 원문 | 신청 페이지 |
---|
도서위치안내: / 서가번호:
우편복사 목록담기를 완료하였습니다.
*표시는 필수 입력사항입니다.
저장 되었습니다.