
 대표어
대표어


권호기사보기
| 기사명 | 저자명 | 페이지 | 원문 | 기사목차 |
|---|
결과 내 검색
동의어 포함
Title Page
Contents
Abstract 7
I. INTRODUCTION 9
II. MATERIALS AND METHODS 12
1. Animals and environmental conditions 12
2. Test chemical and treatment 12
3. Experimental groups 13
4. Observation of dams 13
4.1. Observation of animals 13
4.2. Necropsy and organ weights 14
4.3. Preparation of liver tissue homogenate 14
4.4. Determination of lipid peroxidation and GSH levels 15
4.5. Determination of antioxidant enzymes 15
5. Post-mortem examination 16
6. Statistical Analyses 17
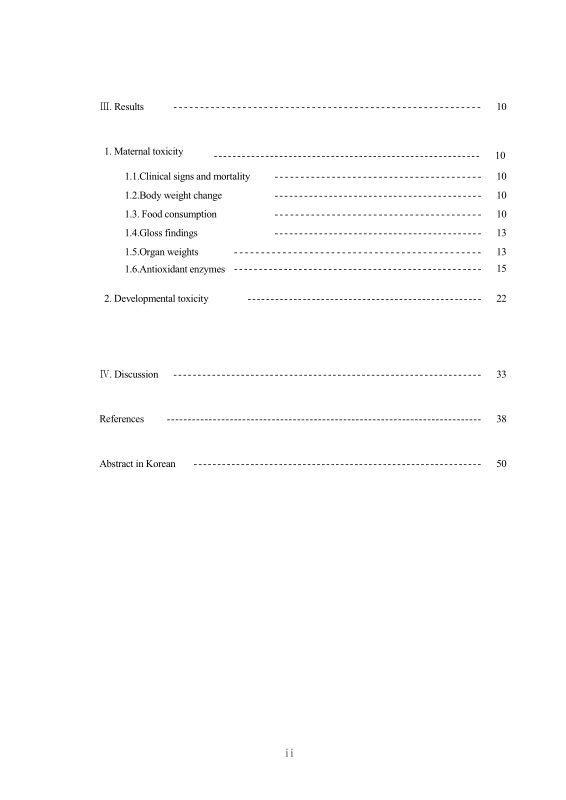
III. RESULTS 18
1. Maternal toxicity 18
1.1. Clinical signs and mortality 18
1.2. Body weight change 18
1.3. Food consumption 18
1.4. Gross findings 21
1.5. Organ weights 21
1.6. Antioxidant enzymes 23
2. Developmental toxicity 30
IV. DISCUSSION 41
REFERENCES 46
국문초록 58
Fig. 1. Malondialdehyde concentration in the liver of dams treated with CP and/or PYC. Each bar represents the mean±D of rats. 24
Fig. 2. Glutathione concentration in the liver of dams treated with CP and/or PYC. Each bar represents the mean±D of rats. 25
Fig. 3. Catalase concentration in the liver of dams treated with CP and/or PYC. Each bar represents the mean±D of rats. 26
Fig. 4. Glutathione peroxidase concentration in the liver of dams treated with CP and/or PYC. Each bar represents the mean±D of rats. 27
Fig. 5. Glutathione-S-transferase concentration in the liver of dams treated with CP and/or PYC. Each bar represents the mean±D of rats. 28
Fig. 6. Glutathione reductase concentration in the liver of dams treated with CP and/or PYC. Each bar represents the mean±D of rats. 29
*표시는 필수 입력사항입니다.
| 전화번호 |
|---|
| 기사명 | 저자명 | 페이지 | 원문 | 기사목차 |
|---|
| 번호 | 발행일자 | 권호명 | 제본정보 | 자료실 | 원문 | 신청 페이지 |
|---|
도서위치안내: / 서가번호:

우편복사 목록담기를 완료하였습니다.
*표시는 필수 입력사항입니다.
저장 되었습니다.
