
 대표어
대표어
권호기사보기
| 기사명 | 저자명 | 페이지 | 원문 | 기사목차 |
|---|
결과 내 검색
동의어 포함
표제지
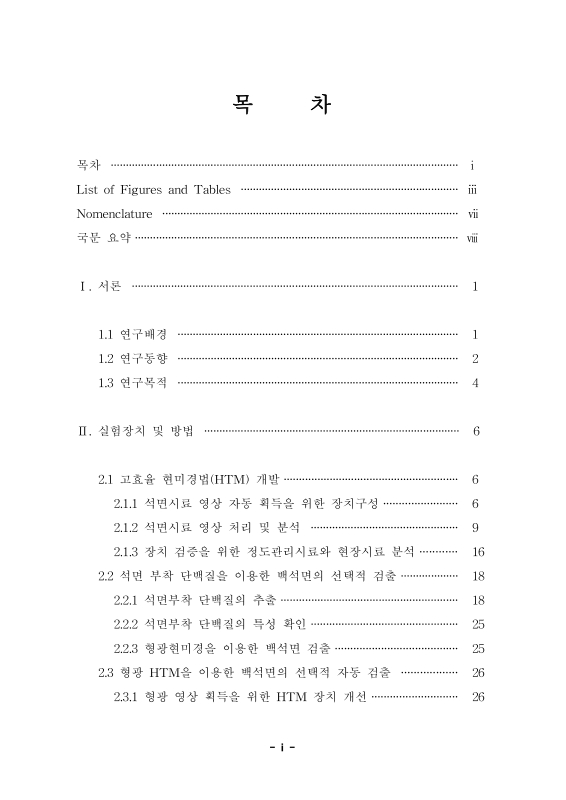
목차
Nomenclature 10
국문요약 11
1. 서론 13
1.1. 연구배경 13
1.2. 연구동향 14
1.3. 연구목적 16
2. 실험장치 및 방법 18
2.1. 고효율 현미경법(HTM) 개발 18
2.1.1. 석면시료 영상 획득을 위한 장치구성 18
2.1.2. 석면시료 영상 처리 및 분석 21
2.1.3. 장치 검증을 위한 정도관리시료와 현장시료 분석 28
2.2. 석면 부착 단백질을 이용한 백석면의 선택적 검출 30
2.2.1. 석면부착 단백질의 추출 30
2.2.2. 석면부착 단백질의 특성 확인 37
2.2.3. 형광현미경을 이용한 백석면 검출 37
2.3. 형광 HTM을 이용한 백석면의 선택적 자동 검출 38
2.3.1. 형광 영상 획득을 위한 HTM 장치 개선 38
2.3.2. 백석면의 형광 영상 분석 38
3. 결과 및 고찰 41
3.1. 석면섬유 영상 자동 분석 41
3.2. 정도관리시료와 현장시료 분석을 통한 검증 48
3.3. 실내공기시료 분석 및 분석 파라미터 최적화 51
3.4. 석면부착 단백질의 정제 61
3.5. 석면부착 단백질의 특성 검증 66
3.6. 형광 HTM을 이용한 백석면의 고효율 선택적 계수 71
4. 결론 76
참고문헌 77
Abstract 81
Fig. 1. Equipments for air sampling, procedure of sample preparation and a flow chart for PCM. 19
Fig. 2. (a) Schematic diagram of high-throughput microscopy (HTM) system and its parts. (b) A photo of HTM prototype. 20
Fig. 3. (a) Standard asbestos sample preparation using ball milling. (b) Three types of asbestos samples (chrysotile, amosite and crocidolite). 23
Fig. 4. Raw images of ball-mill ground asbestos samples. 24
Fig. 5. A photo of chrysotile images obtained by HTM device. 25
Fig. 6. Asbestos sample images undergone specific steps for image processing and analysis in HTM method 26
Fig, 7. (a) Hemocytometer. (b) Grid pattern inside the chamber. 27
Fig. 8. Sample slide for PCM analysis. 29
Fig. 9. Spectrophotometer for optical density measurement. 33
Fig. 10. Result of IPTG induction test. 34
Fig. 11. Photos of centrifuges. 35
Fig. 12. Results of protein purification. 36
Fig. 13. Schematic diagram of fluorescent high-throughput microscopy (HTM) system. 40
Fig. 14. Size of a field of view. 44
Fig. 15. Comparison of manual count and automatic image analysis on three types of asbestos 45
Fig. 16. Total fiber counts versus asbestos concentration affected by change in the parameter 46
Fig. 17. Comparison between manual count and automatic count in accordance with the variation of parameter sets. 47
Fig, 18. (a) Comparison of asbestos concentrations of indoor air samples resulted from HTM and PCM methods, (b) Comparison of asbestos concentrations of PAT standard samples analyzed by HTM and PCM. 67
Fig. 19. Principle of "Triangle" method. 54
Fig. 20. Processure of image analysis using "Threshold-triangle" method. 55
Fig. 21. Process of image analysis applying "Auto Local Threshold" varying 'threshold" and 'radius' values. 56
Fig. 22. The field-sample images with noisy background. From the first line, sample1. sample2. sample3, sample4 and sample5 analyzed in Table 6. Bar=100 μm. 57
Fig. 23. A flow chart for recombinant protein manufacturing 62
Fig. 24. Amplified DNA fragment followed by PCR using E.coli genomic DNA. 63
Fig. 25. Commercial kits for protein chromatography and dialysis 64
Fig. 26. Result of peptide mapping of the recombinant protein 65
Fig. 27. Verification for the properties of DksA adhered to chrysotile. 69
Fig. 28. Result of protein binding test on three types of asbestos. 70
Fig. 29. Comparison between specified number of microspheres and measured number of microspheres by modified HTM. 73
Fig. 30. Comparison of analyzed asbestos images between bright field image and fluorescence image. (a) Bright-field image of chrysotile, (b) Result after image analysis, (c) Fluorescence image of chrysotile and (d) Result after fluorescence image analysis. 74
Fig. 31. Results of asbestos fiber count obtained by HTM and PCM. 75
*표시는 필수 입력사항입니다.
| 전화번호 |
|---|
| 기사명 | 저자명 | 페이지 | 원문 | 기사목차 |
|---|
| 번호 | 발행일자 | 권호명 | 제본정보 | 자료실 | 원문 | 신청 페이지 |
|---|
도서위치안내: / 서가번호:

우편복사 목록담기를 완료하였습니다.
*표시는 필수 입력사항입니다.
저장 되었습니다.
