
 대표어
대표어


권호기사보기
| 기사명 | 저자명 | 페이지 | 원문 | 기사목차 |
|---|
결과 내 검색
동의어 포함
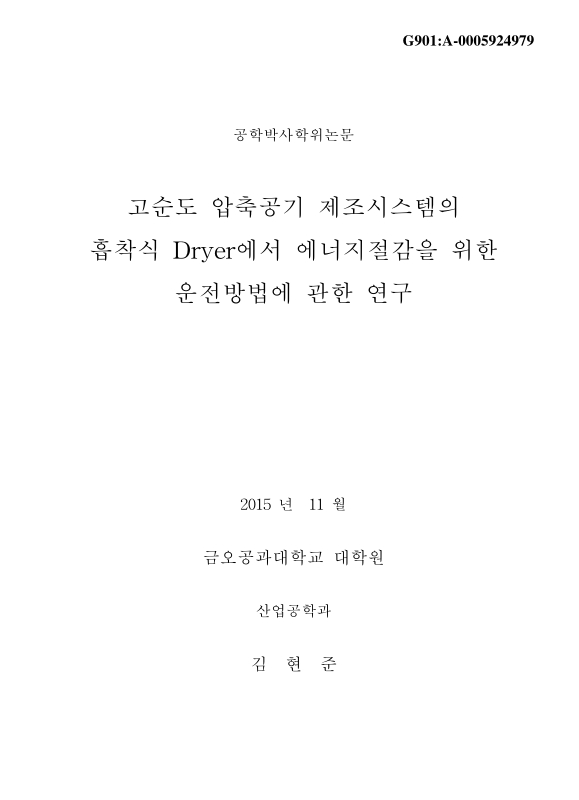
표제지
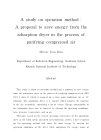
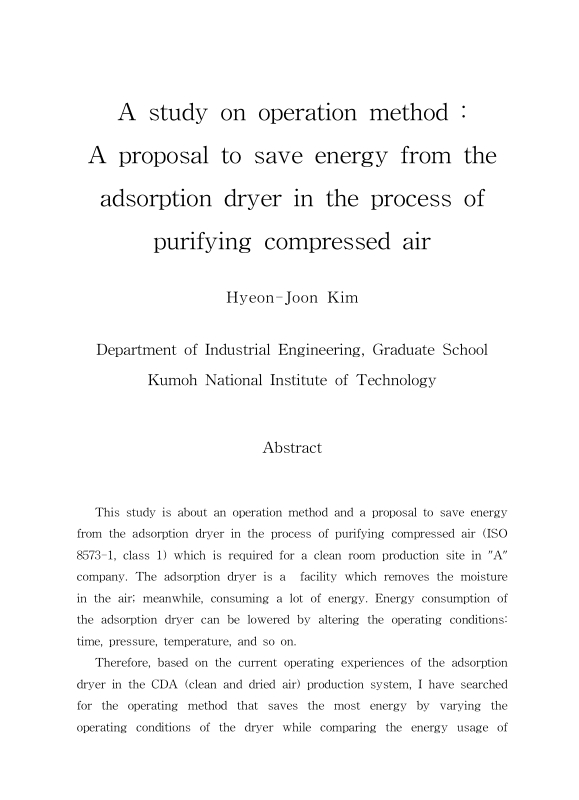
Abstract
목차
제1장 서론 15
1.1. 연구 배경 및 목적 15
1.2. 연구 방법 및 내용 17
1.2.1. 평가특성치의 선정 17
1.2.2. 시료 및 실험 조건 17
제2장 이론적 배경 20
2.1. 고순도 압축공기 제조시스템 개요 20
2.1.1. 고순도 압축공기 제조시스템의 구성 요소 20
2.1.2. Air Compressor(공기압축기)의 종류 21
2.1.3. Air Compressor의 구조 24
2.1.4. 고순도 압축공기의 압력 및 노점 32
2.2. 주요설비의 작동 원리 35
2.2.1. Turbo Air Compressor 35
2.2.2. 냉동식 Dryer 39
2.2.3. 흡착식 Dryer 42
2.3. 부대설비의 종류 및 기능 47
2.3.1. Receiver Tank 47
2.3.2. After Cooler 50
2.3.3. Filter 52
2.3.4. 냉각수 Pump 54
2.3.5. Cooling Tower(냉각탑) 57
2.3.6. 응축수 Drain Trap 62
2.4. 고순도 압축공기 제조시스템의 소비 전력 65
2.4.1. Air Compressor의 소비전력 65
2.4.2. Air Compressor의 소비전력 저감 67
2.5. 고순도 압축공기 제조시스템에서의 에너지절감에 대한 선행연구 70
2.5.1. 국내·외 연구동향 70
제3장 연구 방법 79
3.1. "A"사의 클린룸 현황 79
3.1.1. 클린룸의 청정도 관리 79
3.1.2. 클린룸의 공조 Process 80
3.2. "A"사의 고순도 압축공기 제조시스템의 구성 현황 81
3.3. "A"사의 고순도 압축공기 제조시스템의 전력 소비 현황 83
3.4. 흡착식 Dryer의 주요 인자 84
3.4.1. 재생 압력 84
3.4.2. Heating 온도 85
3.4.3. 재생시간 86
3.5. 흡착식 Dryer의 주요 운전 방식 87
3.5.1. Time 운전 87
3.5.2. 노점 운전 89
3.6. 실험 환경 93
3.6.1. 고순도 압축공기의 품질 수준 93
3.6.2. 실험 측정 계측기 94
3.6.3. 흡착식 Dryer Specification 96
3.6.4. Monitoring 시스템 구축 97
3.6.5. 실험 전제 조건 99
제4장 결과 및 고찰 101
4.1. Time 운전에 대한 실험 결과 101
4.1.1. 재생 압력 변경 실험 102
4.1.2. Heating 온도 변경 실험 107
4.1.3. Time 운전 실험 114
4.2. 노점운전에 대한 실험 결과 121
4.2.1. 노점 운전 실험 121
4.2.2. Delay Time 적용 실험 123
4.2.3. Delay Time & PSR 적용 실험 131
제5장 결론 137
참고문헌 142
Fig. 1-1. The flow chart of this study 19
Fig. 2-1. Composition and flow of purifying ccmpressed air system 21
Fig. 2-2. Types of wide use air compressor 22
Fig. 2-3. Classification by flow direction of turbo air compressor 24
Fig. 2-4. Compression stroke of reciprocating type air compressor 25
Fig. 2-5. Compression stroke of rotary type air compressor 26
Fig. 2-6. Structure of oil free air compressor 27
Fig. 2-7. Compression flow of oil free air compressor 28
Fig. 2-8. Structure of oil injection air compressor 29
Fig. 2-9. Compression flow of oil injection air compressor 30
Fig. 2-10. Structure of turbo type air compressor 32
Fig. 2-11. Internal structure of turbo compressor 36
Fig. 2-12. Air flow of turbo compressor 38
Fig. 2-13. Air flow of refrigeration type dryer 41
Fig. 2-14. Adsorption Process 43
Fig. 2-15. Heated Type Dryer and Air Flow 44
Fig. 2-16. Receiver Tank 48
Fig. 2-17. Capacity and air consumption of receiver tank 49
Fig. 2-18. Air flow of water chilling type after cooler 51
Fig. 2-19. Filter installation cases of purifying compressed air... 52
Fig. 2-20. Types of centrifugal pump 55
Fig. 2-21. Circulation flow of cooling water in purifying compressed air... 57
Fig. 2-22. Cooling characteristic of cooling tower 58
Fig. 2-23. Classification by contact direction of air and water 59
Fig. 2-24. Condensed water drain trap installation cases from... 63
Fig. 2-25. Performance principle and structure of ccndensed water drain... 64
Fig. 2-26. Power consumption and content of compressor unit 66
Fig. 3-1. Air handling unit process in clean room 81
Fig. 3-2. Distribution diagram of purifying compressed air system in "A"... 82
Fig. 3-3. Power usage status in "A" company (accumulated by... 83
Fig. 3-4. Power consumption for each purifying compressed air... 84
Fig. 3-5. Operating characteristic of adsorption type dryer 86
Fig. 3-6. Time based operation 88
Fig. 3-7. Dew point based operation 90
Fig. 3-8. Delay time application test 91
Fig. 3-9. Delay time & PSR application test 92
Fig. 3-10. Particle Gauge 95
Fig. 3-11. Dew point gauge 96
Fig. 3-12. Installation monitoring system about dryer in "A" company 98
Fig. 3-13. Extraction point of major factor from purifying compressed air... 99
Fig. 4-1. Control panel of adsorption type air dryer 101
Fig. 4-2. Dew point temperature by pressure 102
Fig. 4-3. Dew point temperature by pressure 103
Fig. 4-4. Upper tower temperature purge volume by pressure 104
Fig. 4-5. Power consumption by pressure 105
Fig. 4-6. Dew point by heating temperature 107
Fig. 4-7. Dew point by heating temperature 108
Fig. 4-8. Purge volume by heating temperature 108
Fig. 4-9. Upper tower temperature by heating temperature 109
Fig. 4-10. Purge temperature by heating temperature 109
Fig. 4-11. Power consumption by heating temperature 110
Fig. 4-12. temperature of heating section by heating temperature 110
Fig. 4-13. temperature of cooling section by heating temperature 111
Fig. 4-14. System performance @H6_C6(heating temperature 200~210°C) 115
Fig. 4-15. System performance @H6_C6(heating temperature 210~220°C) 115
Fig. 4-16. Dew point purge vol. trend @H6_C6(heating temperature... 116
Fig. 4-17. Dew point purge vol. trend @H6_C6(heating temperature... 116
Fig. 4-18. Dew point trend by regeneration time(14hr, 16hr) 118
Fig. 4-19. System performance @H7_C7(heating temperature 200~210°C) 119
Fig. 4-20. System performance @H8_C8(heating temperature 200~210°C) 119
Fig. 4-21. Dew point of dew point operation @H7_C7, 200~210°C, 2.5 bar 122
Fig. 4-22. Dew point of dew point operation @H8_C8, 200~210°C, 2.5 bar 122
Fig. 4-23. Temperature of regeneration, upper tower, lower tower,... 124
Fig. 4-24. Temperature of regeneration, upper tower, lower tower, purge.... 124
Fig. 4-25. Upper tower, purge temperature by purge temperature... 125
Fig. 4-26. Dew point, purge temperature @H12, C12 operation, lower... 126
Fig. 4-27. Dew point, purge temperature @H14, C14 operation, lower... 126
Fig. 4-28. Upper tower temperature by pressure 127
Fig. 4-29. Heating temperature, Purge temperature by pressure 128
Fig. 4-30. Lower tower temperature by pressure 129
Fig. 4-31. Dew point of PSR test 131
Fig. 4-32. Heating, Purge temperature of PSR test 132
Fig. 4-33. Purge volume of PSR test 132
Fig. 4-34. Exit temperature to refrigerator from upper tower temperature... 133
Fig. 4-35. Optimization concept of both sides extension of supply and... 135
*표시는 필수 입력사항입니다.
| 전화번호 |
|---|
| 기사명 | 저자명 | 페이지 | 원문 | 기사목차 |
|---|
| 번호 | 발행일자 | 권호명 | 제본정보 | 자료실 | 원문 | 신청 페이지 |
|---|
도서위치안내: / 서가번호:

우편복사 목록담기를 완료하였습니다.
*표시는 필수 입력사항입니다.
저장 되었습니다.
