
 대표어
대표어

권호기사보기
| 기사명 | 저자명 | 페이지 | 원문 | 기사목차 |
|---|
결과 내 검색
동의어 포함
Title Page
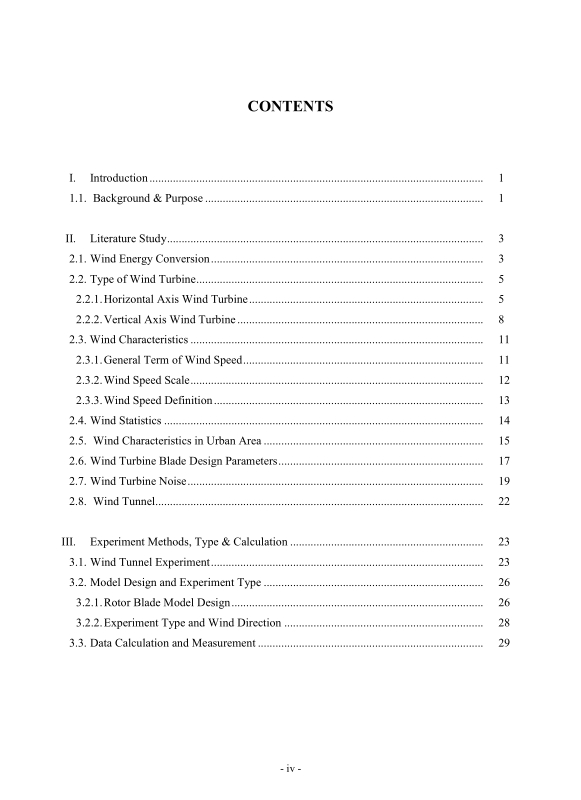
Contents
I. Introduction 9
1.1. Background & Purpose 9
II. Literature Study 11
2.1. Wind Energy Conversion 11
2.2. Type of Wind Turbine 13
2.2.1. Horizontal Axis Wind Turbine 13
2.2.2. Vertical Axis Wind Turbine 16
2.3. Wind Characteristics 19
2.3.1. General Term of Wind Speed 19
2.3.2. Wind Speed Scale 20
2.3.3. Wind Speed Definition 21
2.4. Wind Statistics 22
2.5. Wind Characteristics in Urban Area 23
2.6. Wind Turbine Blade Design Parameters 25
2.7. Wind Turbine Noise 27
2.8. Wind Tunnel 30
III. Experiment Methods, Type & Calculation 31
3.1. Wind Tunnel Experiment 31
3.2. Model Design and Experiment Type 34
3.2.1. Rotor Blade Model Design 34
3.2.2. Experiment Type and Wind Direction 36
3.3. Data Calculation and Measurement 37
IV. Results and Discussion 39
4.1. RPM Review 39
4.2. Tip Speed Ratio (λ) Review 42
4.3. Power Coefficient (Cp) Review 45
4.3.1. Power Coefficient (Cp) and Wind Speed 45
4.3.2. Power Coefficient (Cp) and Tip Speed Ratio (λ) 48
4.4. Wind Direction Review 51
4.4.1. Vertical Position 51
4.4.2. Horizontal Position 57
4.5. Rotor Blade Noise 64
4.6. Discussion 67
V. Conclusion 69
References 70
ABSTRACT 73
국문초록 75
Fig.2.1. Drag and Lift Force 12
Fig.2.2. Actuator Disk Theory 12
Fig.2.3. Three-Bladed Wind Turbine 13
Fig.2.4. Poul La Cour Wind Turbine in Denmark 1891 14
Fig.2.5. Dutch Windmill and Multi-blade Windmill 15
Fig.2.6. Darrieus-type Wind Turbine 16
Fig.2.7. Savonius-type Wind Turbine 17
Fig.2.8. Combined Darrieus-Savonius Type 18
Fig.2.9. Time and Space Scales of Atmospheric Motion 19
Fig.2.10. Urban Wind Variation (Time Scale) 23
Fig.2.11. Wind Flow Pattern 24
Fig.2.12. Power Coefficient by Various Wind Turbine Designs 26
Fig.2.13. Leq and Time Varying RMS 28
Fig.2.14. Frequency Weighting Graph 29
Fig.3.1. Wind Tunnel Schematic 31
Fig.3.2. Wind Tunnel Opening and Test Model 32
Fig.3.3. Noise Measurement Outline 33
Fig.3.4. Rotor Blade Model Schematic 34
Fig.3.5. Rotor Blade Model Setup 35
Fig.3.6. Test Instruments 37
Fig.4.1. RPM vs Wind Speed (B.A.0˚) 39
Fig.4.2. RPM vs Wind Speed (B.A. 25˚) 40
Fig.4.3. RPM vs Wind Speed (B.A. 40˚) 40
Fig.4.4. RPM vs Wind Speed by Model 41
Fig.4.5. λ vs Wind Speed (B.A. 0˚) 42
Fig.4.6. λ vs Wind Speed (B.A. 25˚) 43
Fig.4.7. λ vs Wind Speed (B.A. 40˚) 43
Fig.4.8. λ vs Wind Speed by Model 44
Fig.4.9. Cp vs Wind Speed (B.A. 0˚) 45
Fig.4.10. Cp vs Wind Speed (B.A. 25˚) 46
Fig.4.11. Cp vs Wind Speed (B.A. 40˚) 46
Fig.4.12. Cp vs Wind Speed by Model 47
Fig.4.13. Cp vs λ (B.A. 0˚) 48
Fig.4.14. Cp vs λ (B.A. 25˚) 49
Fig.4.15. Cp vs λ (B.A. 40˚) 49
Fig.4.16. Cp vs λ by Model 50
Fig.4.17. RPM vs Wind Speed by Wind Directions (B.A. 0˚) 52
Fig.4.18. RPM vs Wind Speed by Wind Directions (B.A. 40˚) 52
Fig.4.19. RPM vs Wind Speed by Bending Angle (Vertical) 53
Fig.4.20. λ vs Wind Speed by Wind Directions (B.A. 0˚) 54
Fig.4.21. λ vs Wind Speed by Wind Directions (B.A. 40˚) 54
Fig.4.22. λ vs Wind Speed by Bending Angle (Vertical) 55
Fig.4.23. Cp vs Wind Speed by Wind Directions (B.A. 0˚) 56
Fig.4.24. Cp vs Wind Speed by Wind Directions (B.A.40˚) 56
Fig.4.25. Cp vs Wind Speed by Bending Angle (Vertical) 57
Fig.4.26. RPM vs Wind Speed by Wind Direction (B.A. 0˚) 58
Fig.4.27. RPM vs Wind Speed by Wind Direction (B.A. 40˚) 58
Fig.4.28. RPM vs Wind Speed by Bending Angle (Horizontal) 59
Fig.4.29. λ vs Wind Speed by Wind Direction (B.A. 0˚) 60
Fig.4.30. λ vs Wind Speed by Wind Direction (B.A. 40˚) 60
Fig.4.31. λ vs Wind Speed by Bending Angle (Horizontal) 61
Fig.4.32. Cp vs Wind Speed by Wind Direction (B.A. 0˚) 62
Fig.4.33. Cp vs Wind Speed by Wind Direction (B.A. 40˚) 62
Fig.4.34. Cp vs Wind Speed by Bending Angle (Horizontal) 63
Fig.4.35. Wind Tunnel Noise Measurement 64
Fig.4.36. Sound Level Ratio (4㎧, 47㏈) 66
Fig.4.37. Sound Level Ratio (8㎧, 63.5㏈) 66
*표시는 필수 입력사항입니다.
| 전화번호 |
|---|
| 기사명 | 저자명 | 페이지 | 원문 | 기사목차 |
|---|
| 번호 | 발행일자 | 권호명 | 제본정보 | 자료실 | 원문 | 신청 페이지 |
|---|
도서위치안내: / 서가번호:

우편복사 목록담기를 완료하였습니다.
*표시는 필수 입력사항입니다.
저장 되었습니다.
