
 대표어
대표어
권호기사보기
| 기사명 | 저자명 | 페이지 | 원문 | 기사목차 |
|---|
결과 내 검색
동의어 포함
표제지
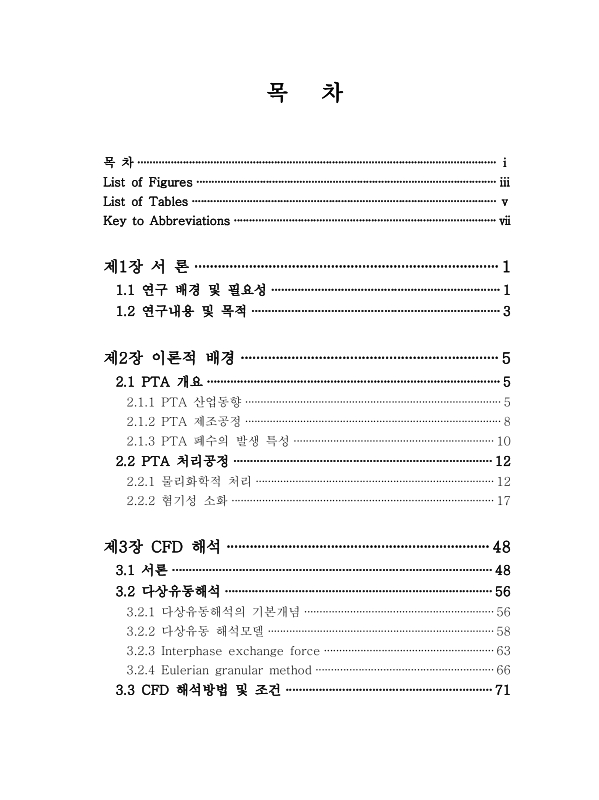
목차
Key to Abbreviations 10
제1장 서론 12
1.1. 연구 배경 및 필요성 12
1.2. 연구내용 및 목적 14
제2장 이론적 배경 16
2.1. PTA 개요 16
2.1.1. PTA 산업동향 16
2.1.2. PTA 제조공정 19
2.1.3. PTA 폐수의 발생 특성 21
2.2. PTA 처리공정 23
2.2.1. 물리화학적 처리 23
2.2.2. 혐기성 소화 28
제3장 CFD 해석 59
3.1. 서론 59
3.2. 다상유동해석 67
3.2.1. 다상유동해석의 기본개념 67
3.2.2. 다상유동 해석모델 69
3.2.3. Interphase exchange force 74
3.2.4. Eulerian granular method 77
3.3. CFD 해석방법 및 조건 82
3.4. CFD 해석 결과 91
3.4.1. UASB Zone 유동해석 결과 91
3.4.2. 반응조 내부의 그래뉼 입자 거동 100
3.4.3. AF Zone 유동해석 결과 103
3.5. 소결 107
제4장 실증 Plant를 이용한 처리효율 및 미생물 생장특성 분석 109
4.1. 서론 109
4.2. 실험장치 및 방법 110
4.2.1. 혐기성 반응조 110
4.2.2. 실험항목 및 방법 111
4.2.3. 유입수 성상분석 112
4.2.4. 운전조건 114
4.2.5. 그래뉼 분석 114
4.2.6. 미생물 활성평가 116
4.3. 실험결과 120
4.3.1. COD 제거효율 및 바이오가스 발생량 120
4.3.2. TA, BA, p-Toluene and 4-CBA 123
4.3.3. pH, Alkalinity and VFA/Alkalinity ratio 125
4.3.4. 그래뉼 특성분석 126
4.3.5. 미생물 활성평가 127
4.3.6. 미생물 증식량 산정 129
4.3.7. 공정별 경제성 평가 131
4.4. 소결 133
제5장 종합결론 135
참고문헌 137
국문초록 148
ABSTRACT 150
Fig. 2.1. Business field using PTA 16
Fig. 2.2. PTA producing process 19
Fig. 2.3. Chemical reaction in PTA producing process 20
Fig. 2.4. Possible degradation pathway for TPA by advanced... 25
Fig. 2.5. Generation comparison of anaerobic digestion process 30
Fig. 2.6. Sludge concentration and volumetric loading over... 37
Fig. 2.7. Relationship on various parameters for sludge granulation 37
Fig. 2.8. Total suspended solids(㎎/L) and percent volatility on... 40
Fig. 2.9. Attached solids(express as ㎎/L) and percent volatility... 40
Fig. 2.10. Anaerobic digestion process 43
Fig. 2.11. General anaerobic degradation 44
Fig. 2.12. Anaerobic degradation on TA 45
Fig. 2.13. Optimum pH of acidogensis and methanogensis 51
Fig. 2.14. pH-CO₂-Alkalinity relation 53
Fig. 2.15. The effect of concentration of a typical inhibitory... 56
Fig. 3.1. Overview of CFD analysis procedure 62
Fig. 3.2. Procedure of SIMPLE scheme 63
Fig. 3.3. Analysis process of Ansys Workbench 65
Fig. 3.4. 3D modelling of a UASB and AF Zone 83
Fig. 3.5. Generated mesh condition of a UASB Zone 85
Fig. 3.6. Generated mesh condition of a AF Zone 86
Fig. 3.7. Boundary conditions of wall 89
Fig. 3.8. Flow analysis results by efflux angle of distributor(Side View) 92
Fig. 3.9. Flow analysis results by efflux angle of distributor(Top View) 94
Fig. 3.10. Flow analysis results by flow rate(Side View) 96
Fig. 3.11. Flow analysis results by flow rate(Top View) 98
Fig. 3.12. Granule conc. in effluent over inflow rate 99
Fig. 3.13. Particle tracking result for Granules 101
Fig. 3.14. Flow analysis result for outflow pipe(Side View) 104
Fig. 3.15. Flow analysis result for outflow pipe(Top View) 104
Fig. 3.16. Flow analysis result for outflow pipe and reactor(Side View) 106
Fig. 3.17. Flow analysis result for outflow pipe and reactor(Top View) 106
Fig. 4.1. Schematic diagram of a combined process of UASB and AF 110
Fig. 4.2. BMP Test procedure 118
Fig. 4.3. Pictures on experimental apparatuses 119
Fig. 4.4. Biogas production over VLR 121
Fig. 4.5. COD removal efficiency during operating periods 121
Fig. 4.6. VFA/Alkalinity ratio change during operating periods 125
Fig. 4.7. Scanning electron microscopy of suspended and Granule... 126
Fig. 4.8. Accumulative biogas yield over experimental periods 128
Fig. 4.9. Accumulative CH₄ yield over experimental periods 128
Fig. 4.10. COD variation over heights of anaerobic digestor 130
*표시는 필수 입력사항입니다.
| 전화번호 |
|---|
| 기사명 | 저자명 | 페이지 | 원문 | 기사목차 |
|---|
| 번호 | 발행일자 | 권호명 | 제본정보 | 자료실 | 원문 | 신청 페이지 |
|---|
도서위치안내: / 서가번호:

우편복사 목록담기를 완료하였습니다.
*표시는 필수 입력사항입니다.
저장 되었습니다.
