
 대표어
대표어

권호기사보기
| 기사명 | 저자명 | 페이지 | 원문 | 기사목차 |
|---|
결과 내 검색
동의어 포함
Title Page
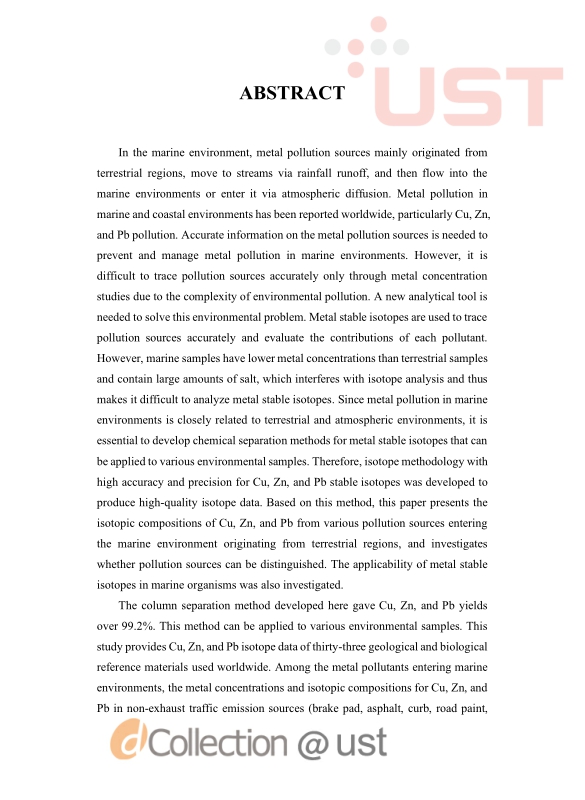
ABSTRACT
국문 초록
Contents
CHAPTER 1. General introduction 22
1.1. Characteristics of environmental metal pollution 23
1.2. Application of metal stable isotopes in environmental studies 25
1.2.1. Cu isotopes 25
1.2.2. Zn isotopes 25
1.2.3. Pb isotopes 26
1.2.4. Approach of metal stable isotopes as an environmental forensic tool 27
1.3. Objectives 28
CHAPTER 2. Copper, zinc and lead isotopic delta values and isotope ratios of various geological and biological reference materials 30
2.1. Introduction 31
2.2. Experimental procedure 32
2.2.1. Sample preparation 32
2.2.2. Column chemistry 33
2.2.3. Isotope measurement by MC-ICP-MS 35
2.3. Results and discussion 36
2.3.1. Chromatographic separation of Cu/Zn and Pb 36
2.3.2. Precision and bias of Cu, Zn, and Pb isotopes 42
2.3.3. Cu, Zn and Pb delta values and isotope ratios of thirty-three commercial RMs 46
2.4. Conclusions 53
CHAPTER 3. Characteristics of potentially toxic elements and multi-isotope signatures (Cu, Zn, Pb) in non-exhaust traffic emission sources 54
3.1. Introduction 56
3.2. Materials and methods 58
3.2.1. Sample collection and PTEs analysis 58
3.2.2. Cu, Zn, and Pb isotope analysis 59
3.3. Results and discussion 60
3.3.1. PTEs concentrations of non-exhaust traffic emission sources 60
3.3.2. Cu, Zn, and Pb isotopic signature of non-exhaust traffic emission sources 65
3.3.3. Multi-isotope approach as a useful tool for identifying metal pollution sources 71
3.4. Conclusions 76
CHAPTER 4. Toxic metal concentrations and Cu-Zn-Pb isotopic compositions in tires 77
4.1. Introduction 78
4.2. Materials and methods 80
4.2.1. Toxic metal analysis 80
4.2.2. Cu, Zn, and Pb isotope analysis 81
4.3. Results and discussion 82
4.3.1. Toxic metal concentrations 82
4.3.2. Cu isotopic composition 85
4.3.3. Zn isotopic composition 87
4.3.4. Pb isotopic composition 88
4.3.5. Application of multi-isotopes as a useful tool for source identification in urban environments 90
4.4. Conclusions 92
CHAPTER 5. Characteristics of potentially toxic elements, risk assessments, and isotopic compositions (Cu‒Zn‒Pb) in the PM10 fraction of road dust in Busan, South Korea 93
5.1. Introduction 94
5.2. Materials and methods 96
5.2.1. Study area 96
5.2.2. Sampling and measurement of PTEs 96
5.2.3. Pollution and ecological risk assessments 97
5.2.4. Heath risk assessment 99
5.2.5. Measurement of Cu, Zn, and Pb isotopes 101
5.3. Results and discussion 101
5.3.1. Characteristics of PTEs in road dust (〈10 μm) 101
5.3.2. Pollution source and environmental impact of PTEs in the PM10 fraction of road dust[이미지참조] 110
5.4. Conclusions 117
CHAPTER 6. Multi-isotope signatures (Cu, Zn, Pb) of different particle sizes in road-deposited sediments: A case study from industrial area 119
6.1. Introduction 120
6.2. Material and methods 122
6.2.1. Study area and sample collection 122
6.2.2. Heavy metal analysis 123
6.2.3. Cu, Zn and Pb isotopes analysis 124
6.2.4. Heavy metal loadings on a grain size fraction 125
6.3. Results and discussion 126
6.3.1. Heavy metal concentrations in different RDS size fractions and TSS 126
6.3.2. Cu isotopic compositions of different RDS size fractions 131
6.3.3. Zn isotopic compositions of different RDS size fractions 134
6.3.4. Pb isotopic compositions of different RDS size fractions 136
6.3.5. Relationship between different RDS size fractions and TSS in runoff 137
6.3.6. Application of multi-isotopes as a useful tool for source identification in RDS studies 141
6.4. Conclusions 144
CHAPTER 7. Investigations of Pb and Cu isotopes to trace contamination sources from the artificial Shihwa Lake in Korea 145
7.1. Introduction 146
7.2. Methods 147
7.2.1. Study area 147
7.2.2. Heavy metals, Cu and Pb isotope analysis 147
7.3. Results 149
7.3.1. Heavy metal concentrations in stream sediments 149
7.3.2. Pb and Cu isotopic compositions 150
7.4. Discussion 152
7.4.1. Difference in metal concentrations between streams 152
7.4.2. Tracing metal pollution sources using Pb and Cu isotopes 153
7.5. Conclusions 157
CHAPTER 8. A nationwide survey of trace metals and Zn isotopic signatures in mussels (Mytilus edulis) and oysters (Crassostrea gigas) from the coast of South Korea 158
8.1. Introduction 159
8.2. Materials and methods 161
8.2.1. Sampling 161
8.2.2. Trace metal analysis 163
8.2.3. The biota sediment accumulation factor (BSAF) 165
8.2.4. Zn isotope analysis 166
8.3. Results and discussion 168
8.3.1. Trace metal concentrations in mussels, oysters, and surface sediments 168
8.3.2. Correlation of trace metals between bivalve mollusk tissues and sediments 174
8.3.3. Zn isotopic signatures in mussels and oysters 178
8.4. Conclusions 183
CHAPTER 9. Conclusions 184
REFERENCES 189
APPENDIXES 253
CURRICULUM VITAE 286
Fig. 1.1. Graphical abstract 24
Fig. 1.2. Schematic view 28
Fig. 2.1. Schematic view of the procedures for Cu/Zn and Pb isotope analysis. 34
Fig. 2.2. Elution curve of the Cu, Fe, and Zn separation procedure for first column using... 38
Fig. 2.3. Elution curves of Cu in different quantities (20 mg, 50 mg, and 100 mg) from... 40
Fig. 2.4. Long-term stability of the isotope standards (ERM-AE647 δ65CuAE647: 0.00 ± 0.02,...[이미지참조] 42
Fig. 2.5. Long-term stability of the isotope standards (IRMM-3702 δ66ZnIRMM-3702: 0.00 ±...[이미지참조] 43
Fig. 2.6. Long-term stability of the isotope standards Pb isotopic compositions (208Pb/206Pb...[이미지참조] 44
Fig. 2.7. Cu isotopic composition in geological and biological reference materials. The... 50
Fig. 2.8. Zn isotopic composition in geological and biological reference materials. The... 51
Fig. 2.9. Pb isotopic composition in geological reference materials. The error bar represents... 52
Fig. 3.1. Comparison of Cu, Zn, and Pb isotopic compositions in this study and the... 68
Fig. 3.2. Comparison of Pb isotope ratios in various non-exhaust emission sources of this study. 70
Fig. 3.3. Comparison of elemental concentrations (mg/kg) and isotopic compositions for... 72
Fig. 3.4. Plots of δ66Zn vs δ65Cu, 206Pb/207Pb vs δ65Cu, and 206Pb/207Pb vs δ66Zn of this study.[이미지참조] 75
Fig. 4.1. Comparisons of toxic metal concentrations (mg/kg) and isotopic compositions of... 84
Fig. 4.2. Plots of concentrations (mg/kg) versus isotopic compositions (δ value) of Cu (a)... 87
Fig. 4.3. Pb concentration (mg/kg) versus 206Pb/207Pb ratio (a) and 206Pb/207Pb ratio versus...[이미지참조] 89
Fig. 4.4. Plots of Cu versus Zn concentrations (a), δ65CuAE647 versus δ66ZnIRMM3702 (b),...[이미지참조] 91
Fig. 5.1. Sampling sites for road dust (RD) from the Busan metropolitan city, South... 97
Fig. 5.2. Spatial distribution of potentially toxic elements in PM10 of road dust in this study.[이미지참조] 103
Fig. 5.3. Comparison of mean ± standard deviation (1 s) values for concentrations (a),... 105
Fig. 5.4. Comparison of mean ± standard deviation (1 s) values for hazard index (HI) for... 109
Fig. 5.5. Component-loading plot for the principal component analysis of the potentially... 111
Fig. 5.6. Plots of concentrations versus isotopic compositions of Cu, Zn, and Pb ((a): this... 114
Fig. 5.7. Plots of concentrations and isotopic values of Cu, Zn, and Pb (a: this study, b:... 116
Fig. 6.1. Study area and sampling sites of RDS and TSS in rainfall runoff at industrial... 123
Fig. 6.2. Comparison of heavy metal concentrations in different sizes of RDS and TSS in... 128
Fig. 6.3. Comparison of isotopic composition and concentration (mg/kg) for Cu (a), Zn (b),... 132
Fig. 6.4. Comparison of Cu, Zn, and Pb isotopic composition in this study and other... 134
Fig. 6.5. Heavy metal loading percentage (%) of six different particle sizes in RDS. 138
Fig. 6.6. Dendrogram showing clustering of the TSS in runoff and six different particle... 140
Fig. 6.7. Multi-isotope diagrams of this study and other literature data using δ65CuAE647 vs...[이미지참조] 143
Fig. 7.1. Sampling sites in the stream sediments flowing into Shihwa Lake, Korea 148
Fig. 7.2. Distribution of metal concentrations (mg/kg) in the stream sediments. Error bars... 150
Fig. 7.3. Plot of 206Pb/207Pb vs. 208Pb/206Pb in stream sediments (A-G) around Shihwa...[이미지참조] 151
Fig. 7.4. Comparison of Cu isotopic composition [δ65CuAE647 (‰)] in stream sediments...[이미지참조] 152
Fig. 7.5. Comparison of Pb isotopic ratios of stream sediments around Shihwa Lake with... 154
Fig. 7.6. Plot of 208Pb/206Pb vs. δ65CuAE647 for stream sediments (A-G) around Shihwa Lake.[이미지참조] 156
Fig. 8.1. Study area for collecting bivalve mollusks (mussels and oysters) and surface... 162
Fig. 8.2. Relationship of trace metals (mg/kg) between sediments and soft tissue of mussels... 175
Fig. 8.3. Comparison of mean value for biota sediment accumulation index (BSAF) in... 176
Fig. 8.4. Zn isotopic compositions (δ66ZnIRMM3702) in mussels and oysters from the coast of...[이미지참조] 180
Fig. 8.5. Zn concentrations (mg/kg dry weight) and Zn isotopic compositions (‰) in... 182
Fig. 9.1. Cu, Zn, and Pb isotopic compositions in potential pollution sources into the marine environment 185
Fig. 9.2. Comparison of Cu, Zn, and Pb isotopic signatures in various environmental samples 187
Fig. 9.3. Plots of δ66Zn vs δ65Cu, 206Pb/207Pb vs δ65Cu, and 206Pb/207Pb vs δ66Zn in various...[이미지참조] 188
*표시는 필수 입력사항입니다.
| 전화번호 |
|---|
| 기사명 | 저자명 | 페이지 | 원문 | 기사목차 |
|---|
| 번호 | 발행일자 | 권호명 | 제본정보 | 자료실 | 원문 | 신청 페이지 |
|---|
도서위치안내: / 서가번호:

우편복사 목록담기를 완료하였습니다.
*표시는 필수 입력사항입니다.
저장 되었습니다.
