
 대표어
대표어






권호기사보기
| 기사명 | 저자명 | 페이지 | 원문 | 기사목차 |
|---|
결과 내 검색
동의어 포함
표제지
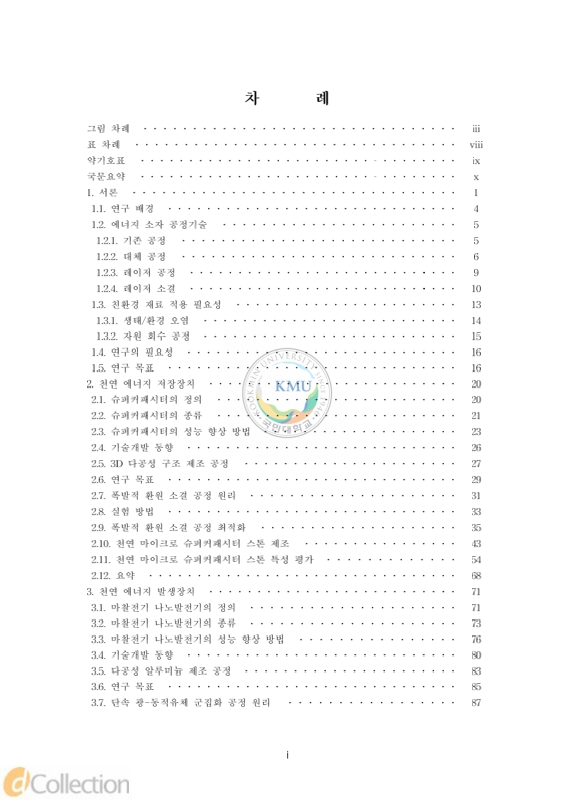
목차
약기호표 13
국문요약 14
1. 서론 17
1.1. 연구 배경 20
1.2. 에너지 소자 공정기술 21
1.2.1. 기존 공정 21
1.2.2. 대체 공정 22
1.2.3. 레이저 공정 25
1.2.4. 레이저 소결 26
1.3. 친환경 재료 적용 필요성 29
1.3.1. 생태/환경 오염 30
1.3.2. 자원 회수 공정 31
1.4. 연구의 필요성 32
1.5. 연구 목표 32
2. 천연 에너지 저장장치 36
2.1. 슈퍼커패시터의 정의 36
2.2. 슈퍼커패시터의 종류 37
2.3. 슈퍼커패시터의 성능 향상 방법 39
2.4. 기술개발 동향 42
2.5. 3D 다공성 구조 제조 공정 43
2.6. 연구 목표 45
2.7. 폭발적 환원 소결 공정 원리 47
2.8. 실험 방법 49
2.9. 폭발적 환원 소결 공정 최적화 51
2.10. 천연 마이크로 슈퍼커패시터 스톤 제조 59
2.11. 천연 마이크로 슈퍼커패시터 스톤 특성 평가 70
2.12. 요약 84
3. 천연 에너지 발생장치 87
3.1. 마찰전기 나노발전기의 정의 87
3.2. 마찰전기 나노발전기의 종류 89
3.3. 마찰전기 나노발전기의 성능 향상 방법 92
3.4. 기술개발 동향 96
3.5. 다공성 알루미늄 제조 공정 99
3.6. 연구 목표 101
3.7. 단속 광-동적유체 군집화 공정 원리 103
3.8. 실험 방법 106
3.9. 단속 광-동적유체 군집화 공정 최적화 107
3.10. 천연 레인 스톤 제조 127
3.11. 천연 레인스톤 특성 평가 134
3.12. 요약 151
4. 결론 153
참고문헌 155
Abstract 180
Fig.1. Classification of various energy types and methods of using electrical energy 17
Fig.2. Energy consumption structure (a) changes in global primary energy consumption, (b) renewable energy distribution of developing countries 18
Fig.3. Lithium mines and polluted sulfuric acid waste reservoir 19
Fig.4. Renewable energy and ESS market 20
Fig.5. Pattern fabrication process (a) photolithography, (b) reactive ion etching 22
Fig.6. Inkjet process (a) schematic of process, (b) fabricated nozzle hole, (c) printed pattern 23
Fig.7. Roll-to-roll process (a) schematic of process, (b) picture of printed pattern, (c) SEM image of printed pattern 24
Fig.8. Imprinting process (a) schematic of process using various curing methodes, (b) 3D stacked... 25
Fig.9. Laser process (a) cutting y, (b) welding, (c) laser assisted machining, (d) water jet guided laser 26
Fig.10. Mechanism of nanoparticle laser sintering (a) photo thermal sintering,(b) photo thermochemical sintering 27
Fig.11. Fabrication method for porous structure using a laser (a) multi photon absorption, (b) mechanism of growth sintering, (c) fabrication of... 28
Fig.12. Waste energy devices and market size 29
Fig.13. Environmental pollution caused by waste energy devices 30
Fig.14. Cause of death by environmental factors 31
Fig.15. Resource recovery process of waste energy device 32
Fig.16. Concept of natural device 33
Fig.17. Concept of natural energy device fabricated using stone and laser material interface 35
Fig.18. Characteristics and various application fields of supercapacitors 37
Fig.19. Classification and structure of supercapacitors 39
Fig.20. Structure for the enhanced performance of supercapacitors 41
Fig.21. Characteristics of transition metal oxides (a) theoretical capacitance (b) voltage range 42
Fig.22. Research trends of supercapacitors (a) various shapes, (b) high performance materials, (c) application of functionality, (d) new materials 43
Fig.23. 3D porous structure fabrication method (a) molten gas injection method, (b) particulate leaching method, (c) 3D printing, (d) Laser induced forward transfer 45
Fig.24. Research object 46
Fig.25. Natural MSC stone design 47
Fig.26. Mechanism of ERS process for 3D porous Cu structure 48
Fig.27. Multi stage photo thermochemical reaction 49
Fig.28. 3D porous Cu patterning using ERS process 49
Fig.29. Residual CuO spray cleaning 49
Fig.30. Schematics of 3D porous Cu pattern fabrication process 51
Fig.31. Schematics of natural MSC stone fabrication process 51
Fig.32. Structural change of 3D porous Cu dependent on residual solvent amount 53
Fig.33. Pattern edge uniformity dependent on residual solvent amount 53
Fig.34. Comparison schematics of surface area of simplified structure (a) 2D porous, (b) 3D porous 53
Fig.35. SEM images of the fabricated 3D porous Cu (a) low magnification surface, (b) high magnification surface, (c) cross section 54
Fig.36. High magnification SEM images of multiscale structures of 3D porous Cu (a) surface, (b) cross section 54
Fig.37. XRD data of marble, CuO and reduced Cu 55
Fig.38. Resistivity and surface area according to patterning speed 57
Fig.39. Extracted surface area images according to patterning speed 57
Fig.40. Surface SEM images according to patterning speed 58
Fig.41. Electrode peeled off at 12 mm/s patterning speed 58
Fig.42. Corss section SEM images according to patterning speed 59
Fig.43. Tilted SEM image of a biscuit 3D porous Cu 59
Fig.44. Roughness of marble polished with different sandpaper 60
Fig.45. 3D porous Cu patterns fabricated on marble with different roughness 61
Fig.46. SEM and TEM images of electrochemical deposited sponge structure of Mn₃O₄ 63
Fig.47. SEM and TEM images of electrochemical deposited coral structure of Fe₃O₄ 64
Fig.48. Structural change with different TMO loading mass 64
Fig.49. XPS data of 3D porous Cu 66
Fig.50. XPS data of sponge structure of Mn₃O₄ 66
Fig.51. XPS data of coral structure of Fe₃O₄ 66
Fig.52. FTIR data of 3D porous Cu, Mn₃O₄, Fe₃O₄ 67
Fig.53. 3D porous Cu patterned natural MSC stone 68
Fig.54. TMO electrochemical deposited natural MSC stone (a) Picture of device, (b) microscopy image (c) SEM image 68
Fig.55. EDS mapping image of Cu, Fe, Mn 69
Fig.56. Cell configuration and nyquist plot for EIS 70
Fig.57. CV curves of three working principles 72
Fig.58. CV curves graph at different voltage ranges 72
Fig.59. CV curves graph at different TMO mass 73
Fig.60. CV curves graph at different scan rate 73
Fig.61. Areal capacitance change at different scan rate 74
Fig.62. GCD curves graph at different current density 74
Fig.63. Nyquist plot of natural MSC stone measured by EIS 75
Fig.64. Capacitance retention of natural MSC stone 76
Fig.65. Ragone plot of natural MSC stone 77
Fig.66. Natural MSC modules in series connection 78
Fig.67. CV curve graph of Natural MSC modules in series connection 79
Fig.68. GCD curve graph of Natural MSC modules in series connection 79
Fig.69. Natural MSC modules in parallel connection 79
Fig.70. CV curve graph of natural MSC modules in parallel connection 80
Fig.71. GCD curve graph of natural MSC modules in parallel connection 80
Fig.72. Designed large scale of natural MSC stone 81
Fig.73. Plug-in method for large area easy connection 81
Fig.74. Large scale connected natural MSC module 81
Fig.75. Mechanical stability test of natural MSC module 82
Fig.76. Capacitance stability under repeated shock 82
Fig.77. Natural MSC stone eco-recycleing process after use 83
Fig.78. Waste component and weight comparison 84
Fig.79. Eco-friendly energy storage platform with natural MSC module 86
Fig.80. Characteristics of TENG and harvestable energy 88
Fig.81. Roadmap of TENG technology 89
Fig.82. Type of TENG working mode 90
Fig.83. Working mechanism of single electrode rain cell 92
Fig.84. Positive and negative charge affinity materials 93
Fig.85. Methods for improving the performance of TENG 96
Fig.86. Representative structure of rain cell (a) droplet driven, (b) single electrode, (c) bi-electrode, (d) S-TIGER 97
Fig.87. Hybrid devices integrated with S-TIGER (a) piezoelectric, (b) solar cell, (c) streaming power generation, (d) applied additional layer 98
Fig.88. Porous Al fabrication method (a) shoot penning, (b) high temperature imprinting, (c) etching, (d) anodic aluminum oxide 100
Fig.89. Defects in Al thermal process 101
Fig.90. Research object 102
Fig.91. Natural rain stone design 103
Fig.92. Mechanism of IPHC process for porous Al structure 105
Fig.93. Mechanism of hydrophobic clustering 105
Fig.94. Laser induced marangoni effect (a) laser power, (b) random scattering, (c) droplet movement 105
Fig.95. Schematics of porous Al fabrication process 107
Fig.96. Schematics of rain stone fabrication process 107
Fig.97. Size distribution frequency of Al particle 108
Fig.98. Oxide volume ratio of different Al particle size 108
Fig.99. Structural ch/different laser power 110
Fig.100. Structural change of porous Al at the fixed pulse width of 200 ns and varying repetition rate 111
Fig.101. Structural change of porous Al at the fixed pulse width of 100 ns and varying repetition rate 111
Fig.102. Characteristic of pulse laser parameters (a) pulse energy and temperature, (b) repetition rate and temperature, (c) pulse energy and penetration depth, (d) pulse... 114
Fig.103. Change of laser penetration depth according to pulse width 115
Fig.104. Structural change of porous Al with repetition rate 115
Fig.105. Sheet resistance and surface area change under different pulse width 116
Fig.106. Extracted surface area images at different repetition rate 117
Fig.107. EDS data of porous Al 118
Fig.108. XRD data of marble, Al particle and sintered Al 118
Fig.109. Al electrode FPCB fabrication experiment steps (a) Al particle coating on PI film, (b) IPHC process, (c) residual Al particle cleaning 119
Fig.110. Al electrode FPCB fabricated on PI film (a) flat image, (b) bent image 119
Fig.111. Al electrode PCB fabricated on Glass 119
Fig.112. Comparison of thermal diffusion CW and pulse laser 120
Fig.113. Before and after etching image of Al electrode fabricated using CW laser and pulse laser 121
Fig.114. SEM Images of fabricated Al electrode at various speeds on PI film (a) 0.08 m/s, (b) 0.1 m/s (c) 0.12 m/s (d) 0.14 m/s 122
Fig.115. Electrical characteristics and line width of Al electrode fabricated at various speeds on PI film 123
Fig.116. High resolution Al electrode fabricated on PI film 123
Fig.117. FPCB bent with different radius 125
Fig.118. Resistance change with different radius 125
Fig.119. Change in resistance at the number of repeated bending 125
Fig.120. Demonstrated flexible micro heater 126
Fig.121. Adhesion test of fabricated PCB 126
Fig.122. Gravel-like structure fabricated by IPHC process 127
Fig.123. Roughness of marble substrate polished with sandpaper at different grit mesh 128
Fig.124. Fabricated porous Al patterns in different roughness marbles 129
Fig.125. Composition of natural rain stones matched with FET 131
Fig.126. Selected positively charged and negatively charged materials 131
Fig.127. Working mechanism of natural rain stone 131
Fig.128. Time-dimensional voltage characteristics according to the behavior of water droplet falling on natural rain stone 132
Fig.129. Designed natural rain stone 133
Fig.130. Defects in sheet formation at different pulse repetition rates 133
Fig.131. DIY raining simulation system 134
Fig.132. Voltage generation at different PDMS thicknesses 135
Fig.133. Image of different PDMS thicknesses 135
Fig.134. Voltage generation at different pulse repetition rates 137
Fig.135. Current generation at different pulse repetition rates 137
Fig.136. Surface area at different repetition rates 138
Fig.137. Performance enhancement mechanisms of natural rain stone 138
Fig.138. Voltage generation at different active layer area 139
Fig.139. Current generation at different active layer area 140
Fig.140. Fallen droplet spread area 140
Fig.141. Energy per unit area that generate in different areas 141
Fig.142. Voltage generation at different falling hight 142
Fig.143. Voltage generation at different droplet volume 142
Fig.144. Voltage generation at different falling frequency 143
Fig.145. Long time stability of natural rain stone 143
Fig.146. Voltage and current at different external resistances 144
Fig.147. Power and current density at different external resistances 145
Fig.148. Ragone plot of natural rain stone 145
Fig.149. Natural rain stone used as LED power source 146
Fig.150. Contact angle of natural rain stone 147
Fig.151. Cell array of natural rain stone 147
Fig.152. Voltage generation of each cell according to water drop movement 148
Fig.153. Mechanical stability (a) smashing test, (b) rubbing test 148
Fig.154. Schematic of hybrid system of solar cell and rain stone 149
Fig.155. Power density of hybrid system at various weather 149
Fig.156. Natural rain stone eco-recycleing process after use 150
Fig.157. Efficient repair method of natural rain stone and weight of waste 150
Fig.158. Natural rain stone applied eco-friendly energy generation platform 152
세계적인 기후 변화의 영향으로 발생하는 이상 기후, 자연재해, 해수면 상승, 생태계 변화 등으로 인해 인류를 포함한 지구의 모든 동식물이 생존이 위협을 받고 있다. 기후 변화의 가장 큰 원인인 온실가스 배출의 대부분은 화석연료를 통한 에너지 생산이며, 생산되는 에너지 대부분은 높은 적용성과 전환성을 가진 전기 에너지이다. 전기 에너지는 산업이 고도화됨에 따라 수요가 폭발적으로 증가하고 있으며, 이에 대응하기 위해 온실가스를 배출하지 않는 친환경적인 발전 방법인 태양광, 풍력, 수력발전 같은 신재생에너지를 사용한 발전 방법이 주목받고 있다. 따라서 친환경 발전 방법인 신재생에너지를 사용한 발전량과 설비가 지속적으로 증가하고 있고, 발전 환경에 따라 불규칙적으로 생성된 에너지를 저장 및 공급할 수 있는 에너지 저장시설 역시 함께 증가하고 있다. 이러한 신재생에너지 시스템의 수요에 맞추어 에너지 발전과 저장을 위한 소자의 생산이 빠르게 늘어나고 있지만, 역설적으로 에너지 소자의 생산 과정 중 많은 양의 유독한 화학물질과 온실가스가 배출되어 기후 변화를 가속하고 있다. 그뿐만 아니라 수명이 다한 사용 후 폐 에너지 소자의 배출이 생산량에 비례하여 증가하고 있고, 이에 함유되어있는 플라스틱, 중금속 등의 물질이 토양, 바다, 공기를 오염시켜 또 다른 문제를 일으키고 있다.
이러한 문제의 해결 방법의 하나인 주변에서 쉽게 구할수 있는 석재, 목재, 나뭇잎, 가죽 같은 천연 재료에 레이저, 잉크젯, 롤투롤, 3D 프린팅 같은 친환경 고효율 공정을 사용하여 다양한 기능을 부여한 천연 소자(Natural Device)는 전기 전자, 에너지, 웨어러블 등의 다양한 분야에 목적에 맞는 기능과 함께 천연 재료가 갖는 고유의 특성인 높은 접근성, 무독성, 생분해성, 생체 적합성 등을 그대로 가지고 있으므로 탄소 배출 절감과 폐기물 문제의 해결을 위한 유망한 해법이다. 하지만, 천연 소자 중 에너지를 저장 또는 생산할 수 있는 천연 에너지 소자(Natural Energy Device)는 대부분이 유기물 기반의 재료로 구성되어 다양한 공정의 적용이 어렵기 때문에 다양한 재료의 적용에 제한을 가지므로 우수한 성능의 구현이 어렵다.
따라서 본 연구에서는 천연 소자 그 중 에너지를 생산 또는 저장할 수 있는 천연 에너지 소자를 우수한 기계적 특성과 외관을 가지는 천연 재료인 석재와 친환경 공정인 레이저 공정을 사용해서 제작하는 방법으로, 유기물 기반의 재료로부터 탈피할 수 있는 금속, 세라믹, 복합체 등 다양한 재료에 적용 가능한 공정을 개발하였다. 개발된 공정을 바탕으로 높은 표면적을 갖는 다공성 구조를 제작하여 천연 에너지 소자에 적용하는 접근으로 천연 에너지 소자의 개념을 확립하고, 최적화를 통해 고성능의 천연 에너지 소자인 에너지를 저장할 수 있는 천연 MSC 스톤(Natural Micro Supercapacitor Stone)과 에너지를 생산할 수 있는 천연 레인 스톤(Natural Rain Stone)을 개발하였다.
천연 에너지 저장 소자 그 중 슈퍼커패시터에 해당하는 천연 MSC 스톤은 천연 소재인 대리석 기판 위에 CuO 나노파티클(Nano Particle, NP)의 폭발적 환원 소결을 이용하는 Explosive Reduction Sintering(ERS) 공정을 사용하여 높은 표면적을 가지는 3D 다공성 Cu 구조를 제작한 후 우수한 용량, 출력 특성을 가지는 스펀지 형상의 Mn₃O₄, 산호 형상의 Fe₃O₄ 를 전착하고, LiClO₄-PVA 겔-폴리머 전해질을 사용함으로서 6.55 μWh/cm² 의 에너지 밀도와 1.2 mW/cm² 의 전력 밀도의 우수한 성능을 가지는 효율적으로 전기 에너지를 저장할 수 있는 천연 MSC 스톤의 제작을 완료하였다.
천연 에너지 소자 그 중 Triboelectric Nanogenerator(TENG)에 해당하는 천연 레인 스톤은 천연 소재인 대리석 기판 위에 Al 파티클의 소수성 군집화 중 발생하는 마랑고니 효과를 이용하는 Intermittent Photo Hydrodynamic Clustering(IPHC) 공정을 사용하여 높은 표면적을 가지는 다공성 Al 구조를 제작한 후 Polydimethylsiloxane(PDMS) 유전체층과 Al 상부 전극을 적층함으로서 24.54 W/m² 의 우수한 전력 밀도를 가지는 빗방울의 수력 에너지를 수확할 수 있는 천연 레인 스톤의 제작을 완료하였다.
또한, 천연 에너지 시스템의 사용 후 폐기 혹은 수리가 필요한 천연 에너지 소자만을 적출한 후 가벼운 폴리싱을 통해서 활성층만을 제거하여 대리석 기판을 재사용할 수 있다. 이러한 접근 방법을 통해서 생산 비용의 절감뿐만 아니라 적은 양의 친환경 폐기물의 배출 그리고 사용 후 폐 에너지 소자의 친환경 처리 방안을 제시하였다.
최종적으로 천연 에너지 소자는 훌륭한 외관과 우수한 기계적 특성을 바탕으로 건축물, 보도블록, 조형물과 같이 기능 없이 낭비되고 있는 주변 요소에 단순히 부착시키는 방법으로 기존 신재생에너지 소자가 가지는 공간적 제약, 환경 파괴, 사고 위험으로부터 탈피함과 동시에 주변 환경에 자연스럽게 적용되어 도심의 모든 공간에서 에너지의 저장과 생산을 할 수 있게 한다. 이를 통해 기존 도심 외부에서 생산되어 저장된 에너지를 송전을 통해 가져와 사용하는 비효율적인 기존 에너지 수급 방식을 벗어나 방, 건물, 도시 단위에서 필요한 에너지를 공간 자체에서 자급자족할 수 있는 현대 도심에 적합한 친환경 에너지 독립형 스마트 시티의 실현을 위한 개념을 확립하였다.*표시는 필수 입력사항입니다.
| 전화번호 |
|---|
| 기사명 | 저자명 | 페이지 | 원문 | 기사목차 |
|---|
| 번호 | 발행일자 | 권호명 | 제본정보 | 자료실 | 원문 | 신청 페이지 |
|---|
도서위치안내: / 서가번호:

우편복사 목록담기를 완료하였습니다.
*표시는 필수 입력사항입니다.
저장 되었습니다.
