
 대표어
대표어
 학술연구정보서비스(KERIS)



권호기사보기
| 기사명 | 저자명 | 페이지 | 원문 | 기사목차 |
|---|
결과 내 검색
동의어 포함
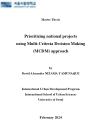
Title Page
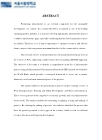
ABSTRACT
Contents
ABBREVIATION 15
1. INTRODUCTION 16
1.1. Background 16
1.1.1. Infrastructure Development Investment 16
1.1.2. Context of Economic Growth in Peru 18
1.1.3. Infrastructure Development in Peru 19
1.1.4. National Infrastructure Plan (PNIC) of Peru 20
1.2. Research Objectives 23
1.2.1. General Objective 23
1.2.2. Specific Objective 23
1.3. Significance of the Research 24
2. LITERATURE REVIEW 26
2.1. Challenges of Infrastructure in Latin America 26
2.2. The importance of infrastructure provision 27
2.3. National Infrastructure Plans 29
2.4. Project Evaluation Method: Cost Benefit Analysis 31
2.5. Multi-Criteria Decision Methodologies (MCDM) 32
2.5.1. Analytic Hierarchy Process (AHP) 33
2.5.2. Infrastructure Prioritization Framework (IPF) 35
2.5.3. Technique for Order of Preference by Similarity to Ideal Solution 38
2.5.4. Elimination and Choice Expressing Reality (ELECTRE) 39
3. RESEARCH METHODOLOGY 40
3.1. Selection of Method of Project Prioritization 40
3.1.1. Infrastructure Prioritization Framework (IPF) method and its Application in Infrastructure Projects 40
3.1.2. Analytic Hierarchy Process (AHP) and its Role in Establishing Relative Importance of Criteria 44
3.1.3. Justification for the Proposed Hybrid Approach 45
3.2. Methodology Approach 46
3.2.1. Step 1: Identification of Strategic Sectors 48
3.2.2. Step 2: Criteria Definition and Construction of Indices 51
3.2.3. Step 3: Weight Criteria Definition 62
4. DATA ANALYSIS AND INTERPRETATIONS 68
4.1. Survey Results 68
4.1.1. Project Evaluation Criteria 68
4.1.2. FEI and SEI Variables Weights 81
4.2. Prioritization of Key Projects 100
4.2.1. Transportation Sector 102
4.2.2. Housing and Urban Development Sector 130
4.2.3. Water and Sanitation Sector 140
5. CONCLUSIONS AND RECOMMENDATIONS 150
5.1. Conclusion 150
5.2. Recommendations 152
5.3. Limitations 154
BIBLIOGRAPHY 156
ANNEXES 160
ANNEX 1. Ranking of Transportation Sector Projects 160
ANNEX 2. Ranking of Housing and Urban Planning Projects 163
ANNEX 3. Ranking of Water and Sanitation Projects 163
초록 164
Figure 1. Variation of Gross Domestic Product (GDP) in Peru. 18
Figure 2. Infrastructure Investment in Peru (in USD Billions). 19
Figure 3. Long-term infrastructure gap in Peru (USD billions). 22
Figure 4. Example of a Hierarchy of Criteria/ Objectives 34
Figure 5. Variables IFP method: Financial-Economic (FEI) and... 35
Figure 6. Indices Methodology IPF: 1) Financial-economic index (FEI), 2) Social-Environmental Index (SEI) 40
Figure 7. Standard Normal Distribution - Cumulative Distribution Function (CDF, Φ(Zij)) 42
Figure 8. Cartesian Plane with variables: FEI (X axis) - SEI (Y axis). 43
Figure 9. IFP Methodology Approach Diagram in the Thesis. 47
Figure 10. Identification of Strategic Sectors in Peru. 50
Figure 11. Thesis survey QR code 62
Figure 12. Comparison Rating Scale. 63
Figure 13. Sequence IFP Methodology Approach Diagram. 67
Figure 14. Importance of Financial, Economic, Social, and Environmental Criteria in project evaluation in Peru 69
Figure 15. Comparative of importance between criteria. 70
Figure 16. FEI and SEI weights 72
Figure 17. Priority order of FEI variables 73
Figure 18. Priority order of SEI variables 76
Figure 19. Comparison Rating Scale. 81
Figure 20. Professional Profile - Transportation Sector. 82
Figure 21. Professional Profile - Water and Sanitation Sector. 94
Figure 22. Ranked projects in the transportation sector. FEI Index. 115
Figure 23. Ranked projects in the transportation sector. SEI Index. 125
Figure 24. Prioritization Matrix, Peru. Transportation Sector. 126
Figure 25. Ranked projects in the transportation sector. FEI Index. 133
Figure 26. Ranked projects in the Housing and Urban Development sector. SEI Index. 136
Figure 27. Prioritization Matrix, Peru. Housing and Urb. Develop. Sector. 137
Figure 28. Ranked projects in the Water and Sanitation sector. FEI Index. 143
Figure 29. Ranked projects in the Water and Sanitation sector. SEI Index. 146
Figure 30. Prioritization Matrix, Peru. Water and Sanitation Sector. 147
인프라의 우선순위를 정하는 것은 국가의 지속가능한 발전을 위한 필수 요소이다. 전 세계적으로 선도적인 신흥 시장 중 하나로 인정받는 페루와 같은 국가에서는 특히 국가의 제한된 재정 자원을 고려할 때 인프라 격차를 해소하기 위해 고급 인프라 프로젝트를 개발하는 것이 중요하다. 따라서 자원을 최적화하고 이를 국가와 국민에게 최대의 이익을 창출할 수 있는 프로젝트에 분배하는 것이 가장 중요하다.
이 연구는 다기준 의사결정(Multi-Criteria Decision Making, MCDM) 접근법을 사용하여 페루의 상황에서 국가 인프라 프로젝트의 우선 순위를 정하는 데 중점을 두었다. 본 연구의 목적은 프로젝트의 경제적, 재정적, 사회적, 환경적 측면을 평가하기 위한 구조화된 프레임워크를 제공하는 세계은행이 개발한 인프라 우선순위 체계(Infrastructure Prioritization Framework, IPF)를 기반으로 인프라 프로젝트의 포괄적인 포트폴리오를 식별하는 것이었다.
분석을 통해 페루의 세 가지 전략적 부문인 교통, 주택 및 도시 개발, 수자원 및 위생 부문에서 프로젝트의 우선순위를 다루었다. 이러한 부문은 경쟁적 (경제 성장) 그리고 사회적 인프라(기본 수요)와 모두 관련이 있다. 분석을 통해 프로젝트의 구조화, 가중치, 점수 산정, 순위를 검토하였다. 본 연구는 프로젝트 순위를 정렬함으로써 국가 내 격차를 줄일 수 있는 가능성이 가장 큰 프로젝트를 식별했으며, 이는 효율적인 자원 할당과 장기적인 개발에 필수적입니다.
본 연구는 투명성, 지속적인 모니터링, 적응성에 중점을 두고 인프라 프로젝트 우선 순위에 대한 정보에 입각한 의사 결정을 확실히 분석하였다. 따라서 본 연구는 유사한 자원 할당 및 개발 계획 문제에 직면한 국가에 모범사례가 되는 주요 통찰력과 권고 사항을 제공하였다.
전반적으로, 본 연구는 페루의 국가 기반 시설 프로젝트의 체계적이고 데이터 중심적인 우선 순위 설정에 기여할 수 있으며, 국가 기반 시설 환경의 효율적인 자원 할당과 많은 개선을 위한 로드맵을 제공하였다. 또한 정책 입안자와 이해관계자가 인프라 프로젝트 우선 순위 및 투자에 관해 정보에 입각한 의사결정을 할 수 있는 중요한 프레임워크를 제공하여 궁극적으로 페루의 사회 경제적 발전에 기여할 수 있다.*표시는 필수 입력사항입니다.
| 전화번호 |
|---|
| 기사명 | 저자명 | 페이지 | 원문 | 기사목차 |
|---|
| 번호 | 발행일자 | 권호명 | 제본정보 | 자료실 | 원문 | 신청 페이지 |
|---|
도서위치안내: / 서가번호:

우편복사 목록담기를 완료하였습니다.
*표시는 필수 입력사항입니다.
저장 되었습니다.
