
 대표어
대표어

권호기사보기
| 기사명 | 저자명 | 페이지 | 원문 | 기사목차 |
|---|
결과 내 검색
동의어 포함
Title Page
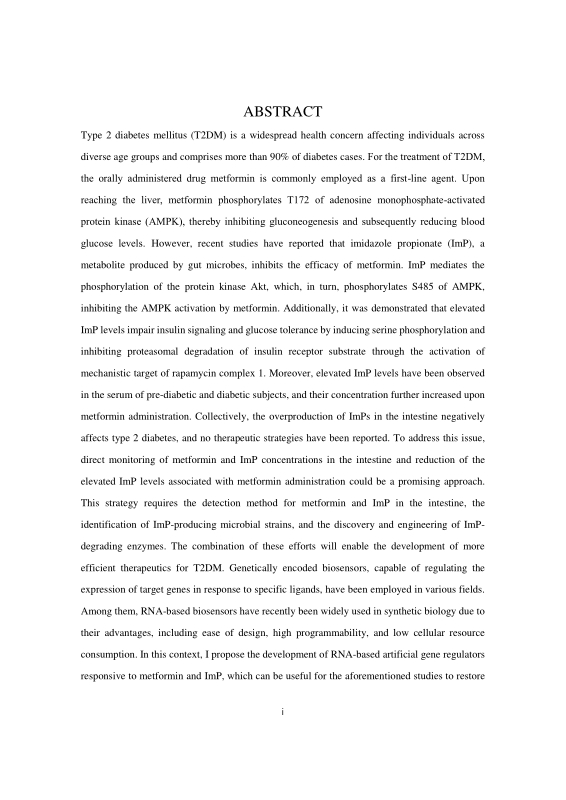
ABSTRACT
Contents
Chapter 1. Introduction 13
1.1. Therapeutic approaches for type 2 diabetes and their constraints 13
1.2. The necessity for gene regulators responsive to T2DM-related molecules 19
1.2.1. Managements of T2DM through eLBPs 20
1.3. Systems for controlling gene expression via nucleic acids 22
1.3.1. Regulation of gene expression using genetically encoded biosensors 22
1.3.2. RNA-based biosensors: advantages over transcription factor-based biosensors 24
1.4. Research goals and approach 27
Chapter 2. Materials and Methods 28
2.1. Materials 28
2.1.1. Bacterial strains, culture media and conditions 28
2.1.2. Vectors and primers 28
2.1.3. Enzymes and other reagents 28
2.2. Methods 31
2.2.1. Plasmids preparation 31
2.2.2. NUPACK 31
2.2.3. In vitro selection of RNA aptamers 31
2.2.4. In vivo fluorescence measurements 34
2.2.5. FACS-based In vivo selection for RNA regulators 35
Chapter 3. Results and Discussion 36
3.1. Design of metformin or ImP-responsive gene regulator 36
3.2. In vitro selection of RNA aptamers for metformin or ImP 39
3.2.1. Design of aptamer library for in vitro selection 40
3.2.2. In vitro Capture-SELEX 46
3.3. Control test to validate the feasibility of our design 52
3.4. Cloning of aptamer library in STAR plasmids 52
3.5. FACS-based in vivo selection 56
3.5.1. Optimization of conditions for FACS-based in vivo selection 56
3.5.2. Enrichment of ligand-responsive RNA regulators 58
3.6. Characterization of metformin or ImP-responsive RNA-based gene regulators 67
Chapter 4. Conclusion 69
Reference 71
국문 초록 78
Figure 1. Trends in the prescription of antidiabetic medications. 17
Figure 2. Visualization of the mechanism through which imidazole propionate undermines the glucose-lowering efficacy of metformin. 18
Figure 3. Computational design of synthetic RNA regulatory systems. 26
Figure 4. Schematic illustration of design for gene regulator in modulating gene expression in the presence or absence of ligands. (a) Designs of STAR and target plasmids and (b) Mechanisms of action for metformin or ImP-responsive gene regulators. 38
Figure 5. Design of library for Capture-SELEX. 42
Figure 6. Ensemble pair fraction plots of the complex with DS and primers. (a) Forward primer/DS and (b) Reverse primer/DS. 45
Figure 7. Overview of the Capture-SELEX process. 48
Figure 8. Aptamer interaction mechanism with and without ligand in Capture-SELEX. 49
Figure 9. Eluted RNA profiles for metformin or ImP. (a) For metformin and (b) For ImP. * means no RNA detected. 51
Figure 10. Fluorescence measurements of plasmids in the presence and absence of STAR, and with added sequences complementary to STAR. (a) Fold activation calculated from fluorescence characterization and (b) Flow cytometry histogram a target RNA expressing sfGFP in the... 53
Figure 11. Illustration of the aptamer pool integration into a STAR plasmid using a type IIs enzyme in the cloning process. 54
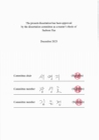
Figure 12. Sequencing results of the constructed gene regulator. 55
Figure 13. Overview of FACS-based in vivo selection process. 59
Figure 14. Flow cytometry histogram of metformin-responsive gene regulator by ligand concentration and incubation time (a) 4 h incubation (b) 18 h incubation. 60
Figure 15. Flow cytometry histogram of imidazole propionate-responsive gene regulator by ligand concentration and incubation time (a) 4 h incubation (b) 18 h incubation. 61
Figure 16. Fold activation of gene regulator under different conditions, computed from the geometric mean value derived from flow cytometry measurements (a) For metformin (b) For ImP. 62
Figure 17. Flow cytometry histogram for each round of FACS-based in vivo selection of 5' library for metformin. Sorting range is shown in green for positive selection and gray for negative selection. 63
Figure 18. Flow cytometry histogram for each round of FACS-based in vivo selection of 3' library for metformin. Sorting range is shown in green for positive selection and gray for negative selection. 64
Figure 19. Flow cytometry histogram for each round of FACS-based in vivo selection of 5' library for ImP. Sorting range is shown in green for positive selection and gray for negative selection. 65
Figure 20. Fold activation of gene regulators for each round of in vivo selection. (a) 5' library and (b) 3' library for metformin (c) 5' library for ImP. Fold activation was calculated as the ratio of the mean fluorescence intensity (MFI) with ligand to the MFI without ligand measured by... 66
*표시는 필수 입력사항입니다.
| 전화번호 |
|---|
| 기사명 | 저자명 | 페이지 | 원문 | 기사목차 |
|---|
| 번호 | 발행일자 | 권호명 | 제본정보 | 자료실 | 원문 | 신청 페이지 |
|---|
도서위치안내: / 서가번호:

우편복사 목록담기를 완료하였습니다.
*표시는 필수 입력사항입니다.
저장 되었습니다.
