
 대표어
대표어







권호기사보기
| 기사명 | 저자명 | 페이지 | 원문 | 기사목차 |
|---|
결과 내 검색
동의어 포함
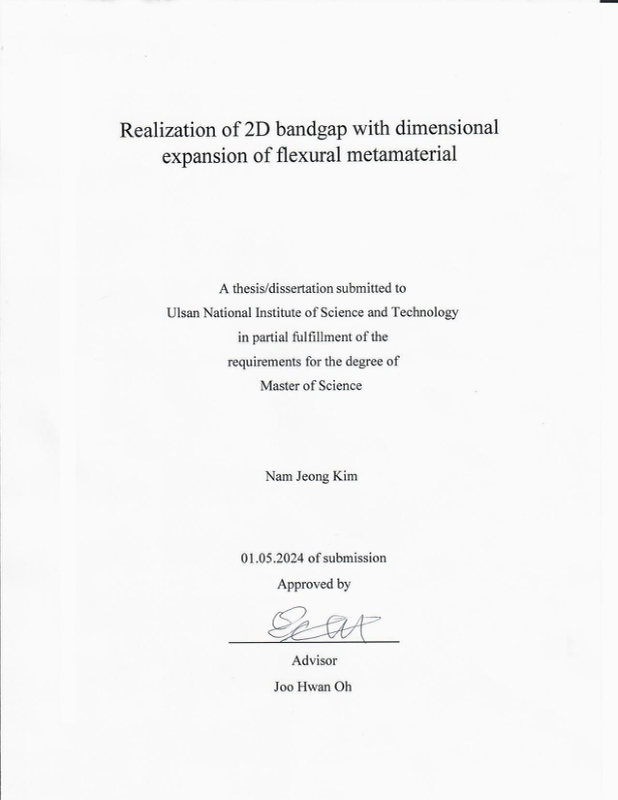
Title Page
Abstract
Contents
Ⅰ. Introduction 9
1.1. Background of flexural metamaterial 9
1.1.1. Wave, Vibration and Metamaterial 9
1.1.2. Flexural wave and Flexural metamaterial 9
1.1.3. Previous research 10
1.2. Research objective and organization 10
Ⅱ. Theoretical basis for bandgap by flexural metamaterials 11
2.1. 1D flexural metamaterial 11
2.1.1. Mass-spring system for beam 11
2.1.2. Analysis of dispersion curve 13
Ⅲ. Band gap formation in two dimensions through theoretical development 14
3.1. 2D flexural metamaterial 14
3.1.1. Mass-spring system for plate 14
3.1.2. Analysis of dispersion curve 17
3.1.3. Unit cell design to meet conditions for band gap formation 19
3.2. Experimental validation 25
3.3. Experimental validation 27
Conclusion 29
Ⅴ. Appendix 30
A. Unit cell with connectors arranged horizontally 30
B. Unit cell with asymmetric structure between x and y directions 31
References 33
Figure 1. Mass-spring system for continuum beam. 11
Figure 2. Dispersion curve in 1D flexural metamaterial 13
Figure 3. Mass-spring system for continuum plate. 14
Figure 4. Unit cell consisting of a cubic mass and one connector. 17
Figure 5. Dispersion curve without bandgap in diagonal direction. 18
Figure 6. I/m change depending on mass shape. 19
Figure 7. Derivation of (a) shear stiffness, (b) bending stiffness, and (c)torsional stiffness. 20
Figure 8. Thickness and length of connector. 20
Figure 9. Parameter study regarding to (a) shear stiffness, (b) bending stiffness, (c) and torsional stiffness depending on thickness of connector. 20
Figure 10. Parameter study regarding to (a) shear stiffness, (b) bending stiffness, (c) and torsional stiffness depending on length of connector. 21
Figure 11. Design at (a) d=0 mm, (b) d=30 mm. 21
Figure 12. (a) Shear stiffness, (b) bending stiffness, (c) torsional stiffness corresponding to distance between two connectors. 22
Figure 13. Unit cell design with spherical mass and two connectors. 22
Figure 14. Dispersion curve with bandgap through theoretical analysis. 23
Figure 15. Dispersion curve with bandgap through numerical analysis. 24
Figure 16. Mode shape corresponding to (a) shear, (b) bending, (c) torsion. 24
Figure 17. Simulation setting in (a) x-direction and (b) diagonal direction. 25
Figure 18. Simulation setting in 2D. 25
Figure 19. Simulation result in x-direction at (a) first pass band, (b) bandgap, (c) second pass band and diagonal direction at (d) first pass band, (e) bandgap, (f) second pass band. 26
Figure 20. Simulation result in x-y plane at (a) second pass band, (b) bandgap, (c) first pass band. 26
Figure 21. Experimental setting. 27
Figure 22. Transmission coefficient at (a) 3rd, (b) 5th, (c) 5'th unit cell.[이미지참조] 28
Figure 23. Unit cell with connectors arranged horizontally. 30
Figure 24. Dispersion curve of the designed unit cell. 30
Figure 25. Asymmetric unit cell. 31
Figure 26. Dispersion curve of the designed unit cell. 32
*표시는 필수 입력사항입니다.
| 전화번호 |
|---|
| 기사명 | 저자명 | 페이지 | 원문 | 기사목차 |
|---|
| 번호 | 발행일자 | 권호명 | 제본정보 | 자료실 | 원문 | 신청 페이지 |
|---|
도서위치안내: / 서가번호:

우편복사 목록담기를 완료하였습니다.
*표시는 필수 입력사항입니다.
저장 되었습니다.
