
 대표어
대표어

권호기사보기
| 기사명 | 저자명 | 페이지 | 원문 | 기사목차 |
|---|
결과 내 검색
동의어 포함
Title Page 1
ABSTRACT 3
Contents 6
CHAPTER Ⅰ. INTRODUCTION 20
1.1. Background Information 20
1.2. Objectives & Methodology 23
1.3. Structure of the Thesis 27
CHAPTER Ⅱ. LITERATURE REVIEW 28
2.1. Introduction 28
2.2. Decomposition Analysis 29
2.2.1. Das Gupta's Method 29
2.2.2. Bashir's Method 31
2.2.3. Cheng's Method 33
2.3. Population structure-based projection models 37
2.3.1. APC (Age-period-cohort) model 37
2.3.2. NORDPRED (NP) model 39
2.3.3. BAPC (Bayesian Age-period-cohort) Model 41
2.4. Non-population structure-based projection models 43
2.4.1. JOINPOINT (JP) Model 43
2.4.2. Time Series Forecasting Model 45
2.5. Summary 49
CHAPTER Ⅲ. SELECTION AGEING RELATED CANCER AND CURRENT TREND ANALYSIS IN 2000 TO 2019 51
3.1. Introduction 51
3.2. Selection of ageing-related cancer 51
3.2.1. Selection of ageing-related cancer with incidence 52
3.2.2. Selection of ageing-related cancer with mortality 58
3.2.3. Final selection of ageing-related cancer to both incidence and mortality 64
3.3. Validation selection of ageing-related cancer 69
3.3.1. Age-Period-Cohort Effect in 2000 to 2019 69
3.4. Summary 88
CHAPTER Ⅳ. COMAPRISON BY PROJECITON MODELS WITH AND WITHOUT POPULATION STRUCTURE EFFECTS 89
4.1. Introduction 89
4.2. Population structure-based model 90
4.3. Non-population structure-based model 92
4.4. Projection results between population structure-based model and non-population structure-based model 93
4.4.1. Projection results for male incidence and mortality rates by models 93
4.4.2. Projection results for female incidence and mortality rates by models 99
4.5. Compare model characteristics based on outcomes by cancer type 104
4.6. Summary 109
CHAPTER Ⅴ. FUTURE PREDICITONS ACCORDING TO POPULATION AGEING SCENARIOS 111
5.1. Introduction 111
5.2. Scenarios setting 112
5.3. Applying decomposition analysis in future projection 113
5.4. Comparison of projection according to prospective population projection scenarios 116
5.4.1. Comparison male incidence and mortality rates by scenarios 116
5.4.2. Comparison female incidence and mortality rates by scenarios 122
5.5. Comparison of decomposition about projection according to prospective population projection scenarios 128
5.5.1. Comparison decompose male incidence and mortality by scenarios 128
5.5.2. Comparison decompose female incidence and mortality by scenarios 141
5.6. Summary 153
CHAPTER Ⅵ. CONCLUSION 154
BIBLIOGRAPHY 158
Figure 1. Ageing related cancer selection framework 26
Figure 2-1. Age-Period-Cohort Effect for Male Incidence (Esophagus, Stomach, Colorectal Cancer) 72
Figure 2-2. Age-Period-Cohort Effect for Male Incidence (Liver, Gallbladder, Pancreas Cancer) 73
Figure 2-3. Age-Period-Cohort Effect for Male Incidence (Lung, Prostate, Bladder Cancer) 74
Figure 2-4. Age-Period-Cohort Effect for Male Incidence (Kidney Cancer, Non-Hodgkin Lymphoma) 75
Figure 3-1. Age-Period-Cohort Effect for Male Mortality (Esophagus, Stomach, Colorectal Cancer) 76
Figure 3-2. Age-Period-Cohort Effect for Male Mortality (Liver, Gallbladder, Pancreas Cancer) 77
Figure 3-3. Age-Period-Cohort Effect for Male Mortality (Lung, Prostate, Bladder Cancer) 78
Figure 3-4. Age-Period-Cohort Effect for Male Mortality (Kidney Cancer, Non-Hodgkin Lymphoma) 79
Figure 4-1. Age-Period-Cohort Effect for Female Incidence (Stomach, Colorectal, Liver Cancer) 82
Figure 4-2. Age-Period-Cohort Effect for Female Incidence (Gallbladder, Pancreas, Lung Cancer) 83
Figure 4-3. Age-Period-Cohort Effect for Female Incidence (Cervix Uteri Cancer, Non-Hodgkin Lymphoma, Leukemia) 84
Figure 5-1. Age-Period-Cohort Effect for Female Mortality (Stomach, Colorectal, Liver Cancer) 85
Figure 5-2. Age-Period-Cohort Effect for Female Mortality (Gallbladder, Pancreas, Lung Cancer) 86
Figure 5-3. Age-Period-Cohort Effect for Female Mortality (Cervix Uteri Cancer, Non-Hodgkin Lymphoma, Leukemia) 87
Figure 6-1. Projection for male age-adjusted incidence & mortality rates in 2000 to 2040 using population structure-based models and non-population structure-based models (Esophagus, Stomach, Colorectal, Colorectal & Anus, Liver Cancer) 96
Figure 6-2. Projection for male age-adjusted incidence & mortality rates in 2000 to 2040 using population structure-based models and non-population structure-based models (Gallbladder, Pancreas, Lung Prostate Cancer) 97
Figure 6-3. Projection for male age-adjusted incidence & mortality rates in 2000 to 2040 using population structure-based models and non-population structure-based models (Kidney, Bladder Cancer, Non-Hodgkin Lymphoma) 98
Figure 7-1. Projection for female age-adjusted incidence & mortality rates in 2000 to 2040 using population structure-based models and non-population structure-based models (Stomach, Colorectal, Colorectal & Anus, Liver, Gallbladder 101
Figure 7-2. Projection for female age-adjusted incidence & mortality rates in 2000 to 2040 using population structure-based models and non-population structure-based models (Pancreas, Lung, Cervix uteri Cancer, Non-Hodgkin 102
Figure 7-3. Projection for female age-adjusted incidence & mortality rates in 2000 to 2040 using population structure-based models and non-population structure-based models (Leukemia) 103
Figure 8-1. Projection for male age-adjusted incidence & mortality rates in 2000 to 2040 using NP model by Scenarios (Esophagus, Stomach, Colorectal, Colorectal & Anus, Liver Cancer) 117
Figure 8-2. Projection for male age-adjusted incidence & mortality rates in 2000 to 2040 using NP model by Scenarios (Gallbladder Pancreas, Lung, Prostate Cancer) 118
Figure 8-3. Projection for male age-adjusted incidence & mortality rates in 2000 to 2040 using NP model by Scenarios (Kidney, Bladder Cancer, Non-Hodgkin Lymphoma) 119
Figure 9-1. Projection for female age-adjusted incidence & mortality rates in 2000 to 2040 using NP model by Scenarios (Stomach, Colorectal, Colorectal & Anus, Liver, Gallbladder Cancer) 123
Figure 9-2. Projection for female age-adjusted incidence & mortality rates in 2000 to 2040 using NP model by Scenarios (Pancreas, Lung, Cervix Uteri, Cancer, Non-Hodgkin Lymphoma) 124
Figure 9-3. Projection for female age-adjusted incidence & mortality rates in 2000 to 2040 using NP model by Scenarios (Leukemia) 125
Figure 10-1. Comparison decomposition for male incidence in 2000 to 2040 using NP by Median, Fast Ageing Slow Ageing Scenarios (Esophagus, Stomach, Colorectal, Colorectal & Anus, Liver Cancer) 131
Figure 10-2. Comparison decomposition for male incidence in 2000 to 2040 using NP by Median, Fast Ageing Slow Ageing Scenarios (Gallbladder, Pancreas, Lung, Prostate Cancer) 132
Figure 10-3. Comparison decomposition for male incidence in 2000 to 2040 using NP by Median, Fast Ageing Slow Ageing Scenarios (Kidney, Bladder Cancer, Non-Hodgkin lymphoma) 133
Figure 11-1. Comparison decomposition for male mortality in 2000 to 2040 using NP by Median, Fast Ageing Slow Ageing Scenarios (Esophagus, Stomach, Colorectal, Colorectal & Anus, Liver Cancer) 134
Figure 11-2. Comparison decomposition for male mortality in 2000 to 2040 using NP by Median, Fast Ageing Slow Ageing Scenarios (Gallbladder, Pancreas, Lung, Prostate Cancer) 135
Figure 11-3. Comparison decomposition for male mortality in 2000 to 2040 using NP by Median, Fast Ageing Slow Ageing Scenarios (Gallbladder, Pancreas, Lung, Prostate Cancer) 136
Figure 12-1. Comparison decomposition for female incidence in 2000 to 2040 using NP by Median, Fast Ageing Slow Ageing Scenarios (Stomach, Colorectal, Colorectal & Anus, Liver, Gallbladder Cancer) 143
Figure 12-2. Comparison decomposition for female incidence in 2000 to 2040 using NP by Median, Fast Ageing Slow Ageing Scenarios (Pancreas, Lung, Cervix Uteri Cancer, Non-Hodgkin lymphoma) 144
Figure 12-3. Comparison decomposition for female incidence in 2000 to 2040 using NP by Median, Fast Ageing Slow Ageing Scenarios (Leukemia) 145
Figure 13-1. Comparison decomposition for female mortality in 2000 to 2040 using NP by Median, Fast Ageing Slow Ageing Scenarios (Stomach, Colorectal, Colorectal & Anus, Liver, Gallbladder Cancer) 146
Figure 13-2. Comparison decomposition for female mortality in 2000 to 2040 using NP by Median, Fast Ageing Slow Ageing Scenarios (Pancreas, Lung, Cervix Uteri Cancer, Non-Hodgkin lymphoma) 147
Figure 13-3. Comparison decomposition for female mortality in 2000 to 2040 using NP by Median, Fast Ageing Slow Ageing Scenarios (Leukemia) 148
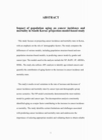
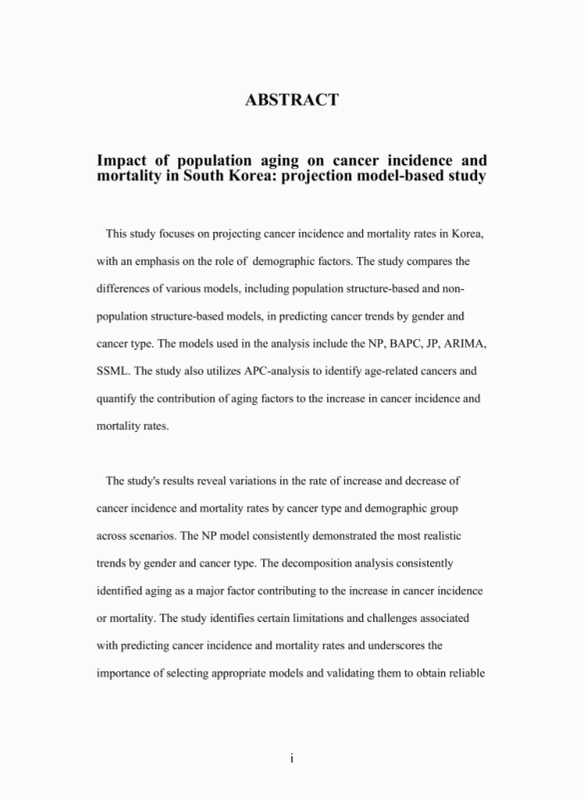
This study focuses on projecting cancer incidence and mortality rates in Korea, with an emphasis on the role of demographic factors. The study compares the differences of various models, including population structure-based and nonpopulation structure-based models, in predicting cancer trends by gender and cancer type. The models used in the analysis include the NP, BAPC, JP, ARIMA, SSML. The study also utilizes APC-analysis to identify age-related cancers and quantify the contribution of aging factors to the increase in cancer incidence and mortality rates.
The study's results reveal variations in the rate of increase and decrease of cancer incidence and mortality rates by cancer type and demographic group across scenarios. The NP model consistently demonstrated the most realistic trends by gender and cancer type. The decomposition analysis consistently identified aging as a major factor contributing to the increase in cancer incidence or mortality. The study identifies certain limitations and challenges associated with predicting cancer incidence and mortality rates and underscores the importance of selecting appropriate models and validating them to obtain reliable and accurate predictions.
Overall, this study highlights the significant role of aging and other demographic factors in cancer incidence and mortality rates and provides insights into the potential impact of these factors on future cancer trends in Korea. The findings have important implications for cancer prevention and control efforts and can help inform policy decisions aimed at reducing the burden of cancer in aging societies. The study's approach and methodology can also be applied to other settings to project cancer trends and quantify the contribution of demographic factors to cancer burden.*표시는 필수 입력사항입니다.
| 전화번호 |
|---|
| 기사명 | 저자명 | 페이지 | 원문 | 기사목차 |
|---|
| 번호 | 발행일자 | 권호명 | 제본정보 | 자료실 | 원문 | 신청 페이지 |
|---|
도서위치안내: / 서가번호:

우편복사 목록담기를 완료하였습니다.
*표시는 필수 입력사항입니다.
저장 되었습니다.
