
 대표어
대표어

권호기사보기
| 기사명 | 저자명 | 페이지 | 원문 | 기사목차 |
|---|
결과 내 검색
동의어 포함
Title Page 1
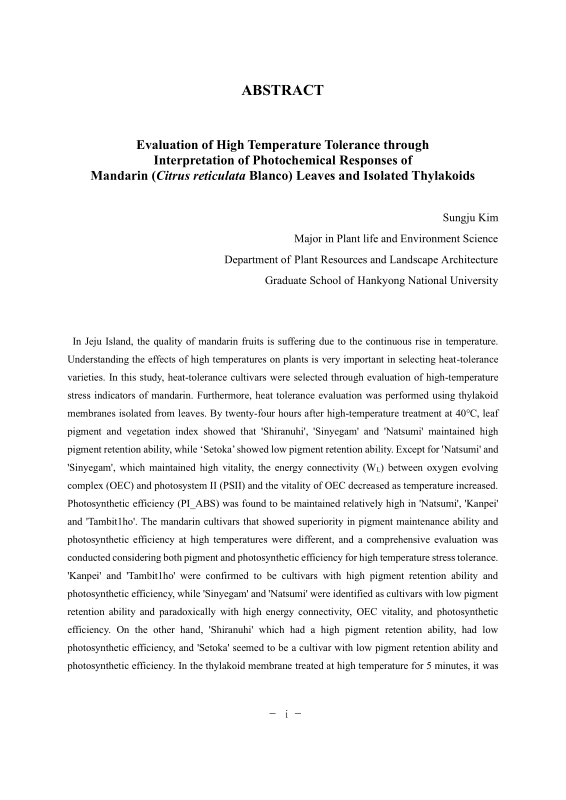
ABSTRACT 4
Contents 6
Nomenclature 11
1. Introduction 12
1.1. Climate change-induced reduction in crop productivity 12
1.2. Effects of climate change on mandarin 12
1.3. Damage to the photosynthetic device by high temperature 14
1.4. Thylakoid and chlorophyll fluorescence analysis 15
1.5. Research objectives 15
2. Materials and Methods 16
2.1. Sample collection 16
2.2. Leaf high-temperature stress analysis 16
2.2.1. Measuring the Chlorophyll Fluorescence Response 17
2.2.2. Measuring the Vegetation indices 17
2.2.3. Measuring Pigment Content in Leaves 17
2.3. Analysis of high temperature stress of thylakoid 22
2.3.1. Thylakoid isolation 22
2.3.2. Analysis of thylakoid content 22
2.3.3. Temperature treatment 23
2.4. Statistical analysis 23
3. Results and discussion 24
3.1. Evaluation of high temperature tolerance using leaves of each mandarin cultivar 24
3.1.1. Correlation between temperature and pigment 24
3.1.2. Correlation between temperature and vegetation indices 34
3.1.3. Analysis of chlorophyll fluorescence response by temperature 45
3.2. Evaluation of high temperature tolerance using thylakoid 68
3.2.1. Analysis of chlorophyll fluorescence response of thylakoid by temperature 70
3.2.2. Changes in Relative Variable Chlorophyll Fluorescence of thylakoid with Temperature 74
3.2.3. Changes in thylakoid JIP-test with temperature 78
3.2.4. Selection of high temperature tolerance cultivars 81
4. Conclusion 88
Bibliography 90
Summary in Korean 95
Fig. 2.1. Leaf temperature treatment 17
Fig. 3.1. Pigment correlation heatmap for 24 hour temperature treatments on mandarin cultivars 26
Fig. 3.2. Variation in Pigment content with temperature by cultivars 27
Fig. 3.3. Variation in Pigment ratio at high temperatures by cultivars 33
Fig. 3.4. Vegetative indices and Pigments correlation heatmap for 24 hour temperature treatments on mandarin cultivars 35
Fig. 3.5. Radar graphs of Vegetation indices after 24 hour temperature treatment by cultivars 38
Fig. 3.6. Simple linear regression of Pigments and Vegetation indices 41
Fig. 3.7. Variation in Vegetation indices at high temperatures by cultivars 43
Fig. 3.8. OJIP graph after 24 hour temperature treatment by cultivar 47
Fig. 3.9. Variation in maximum and minimum fluorescence with temperature treatment by mandarin... 49
Fig. 3.10. ∆VOK graph after 24 hour temperature treatment by cultivar[이미지참조] 51
Fig. 3.11. ∆VOJ graph after 24 hour temperature treatment by cultivar 53
Fig. 3.12. Variation in ∆WL and OEC Centers with temperature treatment by mandarin cultivars[이미지참조] 55
Fig. 3.13. JIP-test parameters correlation heatmap for 24 hour temperature treatments on mandarin cultivars 57
Fig. 3.14. Radar graphs of JIP-test after 24 hour temperature treatment by cultivars 60
Fig. 3.15. Simple linear regression of JIP-test parameters 63
Fig. 3.16. Variation in JIP-test parameters at high temperatures of leaves from mandarin cultivars 64
Fig. 3.17. High temperature PCA analysis of OJIP, Vegetative indices, Pigment in leaves 67
Fig. 3.18. JIP-test parameters correlation heatmap for 5 minutes temperature treatments on isolated thylakoids from mandarin cultivars 69
Fig. 3.19. OJIP graph after 5 minutes temperature treatment of isolated thylakoid from mandarin cultivars 71
Fig. 3.20. OJIP Parameters after 5 minutes temperature treatment of isolated thylakoid from mandarin cultivars 73
Fig. 3.21. ∆VOK graph after 24 hour temperature treatment of isolated thylakoid from mandarin cultivars[이미지참조] 75
Fig. 3.22. Variation in ∆WL and OEC Centers with temperature treatment of isolated thylakoid from mandarin cultivars[이미지참조] 77
Fig. 3.23. Variation in JIP-test parameters at 40℃ of isolated thylakoid from mandarin cultivars 79
Fig. 3.24. The HFI graph depicting the effects of abrupt high-temperature stress on leaves and... 83
Fig. 3.25. The HFI graph depicting the effects of sustained high-temperature stress on leaves and... 85
*표시는 필수 입력사항입니다.
| 전화번호 |
|---|
| 기사명 | 저자명 | 페이지 | 원문 | 기사목차 |
|---|
| 번호 | 발행일자 | 권호명 | 제본정보 | 자료실 | 원문 | 신청 페이지 |
|---|
도서위치안내: / 서가번호:

우편복사 목록담기를 완료하였습니다.
*표시는 필수 입력사항입니다.
저장 되었습니다.
