
 대표어
대표어

권호기사보기
| 기사명 | 저자명 | 페이지 | 원문 | 기사목차 |
|---|
결과 내 검색
동의어 포함
Title Page 1
ABSTRACT 4
Contents 6
Nomenclature 11
1. Introduction 12
2. Background 14
2.1. Physiological response of soybean under drought stress condition 14
2.2. Changes reflectance and pigment in plant under drought stress condition 17
2.2.1. Vegetation index analysis 18
2.2.2. Hyperspectral imaging analysis 22
2.3. Chlrorophyll fluoresecence analysis under drought stress condition 24
3. Method and material 26
3.1. Cultivation test 26
3.2. Irrigation treatment 27
3.3. Measurement 29
3.3.1. Chlorophyll fluorescence 29
3.3.2. Vegetation index 33
3.3.3. Leaf chlorophyll content 33
3.3.4. Free proline analysis 34
3.3.5. Hyperspecctral image analysis 36
3.3.6. Relative water contetnt and water saturation deficits 38
3.3.7. Measure ment of crop yield 39
3.4. Statistical analysis 41
4. Results and discussion 42
4.1. Temperature, relative humidity and soil moisture content during the growth period 42
4.1.1. Soil moisture content 42
4.1.2. Temperature and relative humidity 44
4.2. Growth analysis by various drought levels of soybean 46
4.3. Free proline analysis by various drought levels of soybean 49
4.4. Relative water content and water saturation deficits 52
4.5. Analysis of Chlorophyll fluorescence analysis by various drought levels 54
4.5.1. Comparison of Chlorophyll fluorescence analysis by various drought levels 54
4.5.2. Kinetic difference of ∆VOK change by various drought levels[이미지참조] 60
4.6. Analysis of spectral reflectance and leaf chlorophyll content 62
4.6.1. Comparison of vegetation index by various drought levels of soybean 62
4.6.2. Hyperspectral image analysis 68
4.6.3. Leaf chlorophyll content 73
4.7. Analysis of the variable importance and establishment the yield prediction of soybean under drought stress 75
5. Conclusion 81
Bibliography 83
Summary in Korean 98
Appendix 100
Fig 2.1. Chlorophyll a induction transients graph 24
Fig 3.1. Soil moisture characteristics curve (SMCC) by sandy loam 28
Fig 3.2. Four water treatment applied to beans for growth stage (A) Control and treatments for N days... 28
Fig 3.3. Free proline content measurement method based on Bates, at al. (1973) (A) homogenized fresh... 35
Fig 3.4. Hyperspectral image measurement. (A) take raw data in the field; (B) image pretreatment in... 37
Fig 3.5. Hyperspectral data analysis work flow 37
Fig 3.6. Soybean yield by control and treatment plots (A) dry entire crop; (B) count the number of pods... 40
Fig 4.1. Changes in soil moisture contents of soybean under various drought stress levels (A) during... 43
Fig 4.2. Daily average temperature and Humidity of the test field in Vegetative stage and reproductive... 45
Fig 4.3. Seed and pod yield by various drought levels of soybean (A) Seed mass/plant; (B) Seed... 48
Fig 4.4. Average free proline under various drought stress levels in soybean leaves (A) Free proline accumulation under various drought levels in... 51
Fig 4.5. RWC(Treatment/Control) and WSD(Treatment/Control) under various drought stress levels... 53
Fig 4.6. Comparison of chlorophyll fluorescence polar plot analysis under drought stress at vegetative/reproductive stage during stressed/recovered... 57
Fig 4.7. Kinetic difference of ∆VOK after double normalization of the steps OJIP[∆VOK=VOK (Treatment)-VOK(Control)] on the leaves soybean under...[이미지참조] 61
Fig 4.8. Average vegetation index between stressed and recovered moment under various drought stress levels at vegetative/reproductive stage (A)... 67
Fig 4.9. Average HSI reflectance index between stressed and recovered moment under various drought stress levels at vegetative/reproductive stage (A)... 72
Fig 4.10. Leaf chlorophyll content(SCMR) under various drought stress levels in soybean leaves (A) SCMR in vegetative stage under various drought... 74
Fig 4.11. Analysis of variable importance under various drought stress levels at vegetative/reproducetive stage of weight seeds per plant of soybean... 76
Fig 4.12. Yield prediction of soybean under drought stress condition during vegetative stage with high relative importance indices (A) ABS/CS; (B)... 77
Fig 4.13. Yield prediction of soybean under drought stress condition during vegetative stage with high relative importance indices (A) ET2o/RC; (B)... 78
Fig 4.14. Yield prediction of soybean under drought stress condition during vegetative stage with high relative importance indices (A) Proline; (B)... 79
Fig 4.15. Yield prediction of soybean under drought stress condition during vegetative stage with high relative importance indices (A) RWC; (B)... 80
본 연구는 생육 시기별 건조 스트레스가 콩 (Glycine max L.)의 생육 건전성 및 수확량에 미치는 영향을 구명하기 위해 광화학적 분석, 프롤린 및 상대 수분 함량 분석을 실시하여 건조 스트레스 진단을 위한 지표선발 및 회귀분석을 통한 수확량 예측을 진행하였다.
건조 스트레스 처리는 V3기의 식생 성장 단계와 R1기의 생식 성장 단계에 적용하였다. 영구위조점에 도달한 후 5일, 10일, 15일 동안 건조 처리를 실시한 후 회복을 위한 재수화를 실시하였다. 생육단계별 건조 스트레스 수준에 따른 수확량 감소를 예측하기 위한 분석을 수행하였다. 이어서 각 분석에서 수확량과 유의성을 보이는 매개변수와 식생지수에 변수 중요도 분석을 실시하였다. 생육단계별 건조 스트레스로 인한 수확량 변동 추정을 위해 중요도가 높은 것으로 파악된 상위 4개 변수를 회귀분석을 통해 모형을 개발하였다.
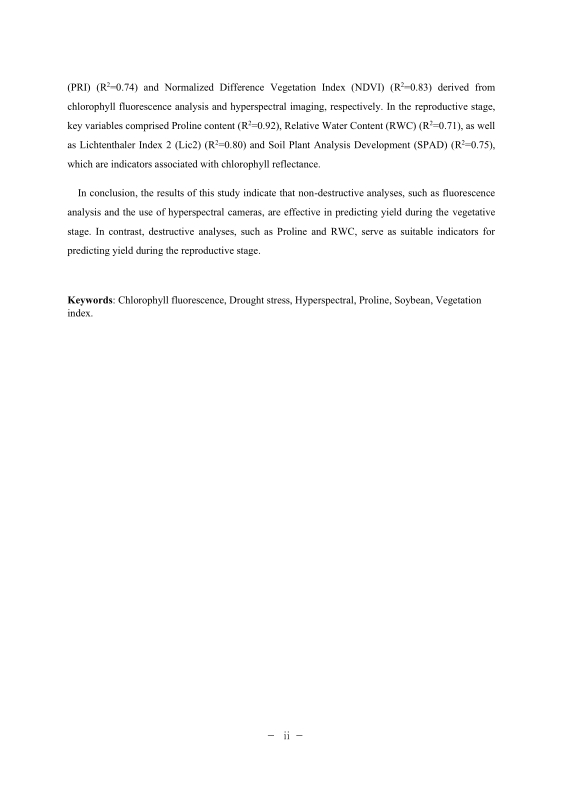
생육 시기별 건조 스트레스 수준에 따른 수확량 예측을 위한 모형을 2차 회귀 곡선으로 작성하였으며 이때의 통계적 유의성이 인정되었다. 영양생장기에는 엽록소 형광분석의 매개변수인 Absorption flux per CS (ABS/CS) (R²=0.93), Electron transport flux from QA to QB per RC (ET2o/RC) (R²=0.66) 및 초분광 이미지의 식생지수인 Photochemical Reflectance Index (PRI) (R²=0.74), Normalized Difference Vegetation Index (NDVI) (R²=0.83)의 변수가 주요하였다. 생식생장기에는 프롤린 함량 (R²=0.92), 상대 수분 함량 (RWC) (R²=0.71) 및 엽록소 반사율과 관련된 지표인 Lichtenthaler Indix 2 (Lic2) (R²=0.80), Soil plant analysis development (SPAD) (R²=0.75)의 변수가 주요하였다.
본 연구의 결과는 영양생장기에는 형광분석 및 초분광 카메라와 같은 비파괴적 분석이 수확량 예측에 적합하며 생식생장기에는 Proline, RWC와 같은 파괴적 분석이 수확량을 예측에 적합한 지표가 될 수 있음을 보여준다.*표시는 필수 입력사항입니다.
| 전화번호 |
|---|
| 기사명 | 저자명 | 페이지 | 원문 | 기사목차 |
|---|
| 번호 | 발행일자 | 권호명 | 제본정보 | 자료실 | 원문 | 신청 페이지 |
|---|
도서위치안내: / 서가번호:

우편복사 목록담기를 완료하였습니다.
*표시는 필수 입력사항입니다.
저장 되었습니다.
