대표어
 학술연구정보서비스(KERIS)






권호기사보기
| 기사명 | 저자명 | 페이지 | 원문 | 기사목차 |
|---|
결과 내 검색
동의어 포함
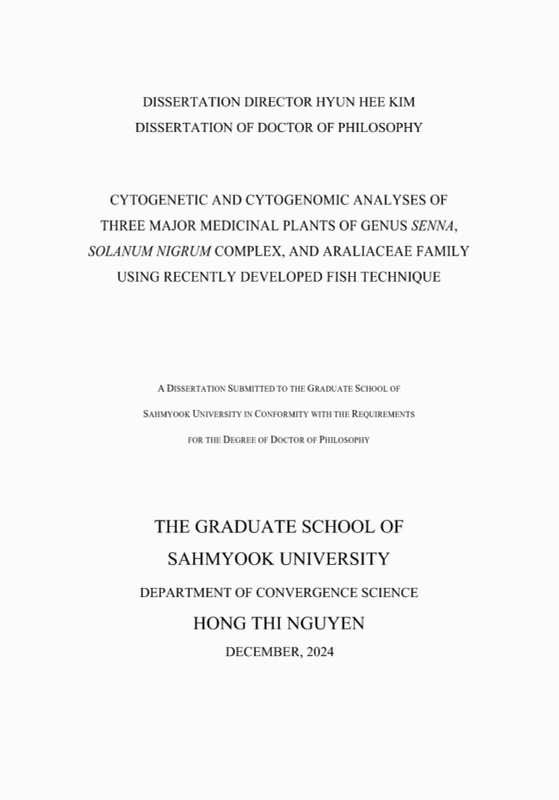
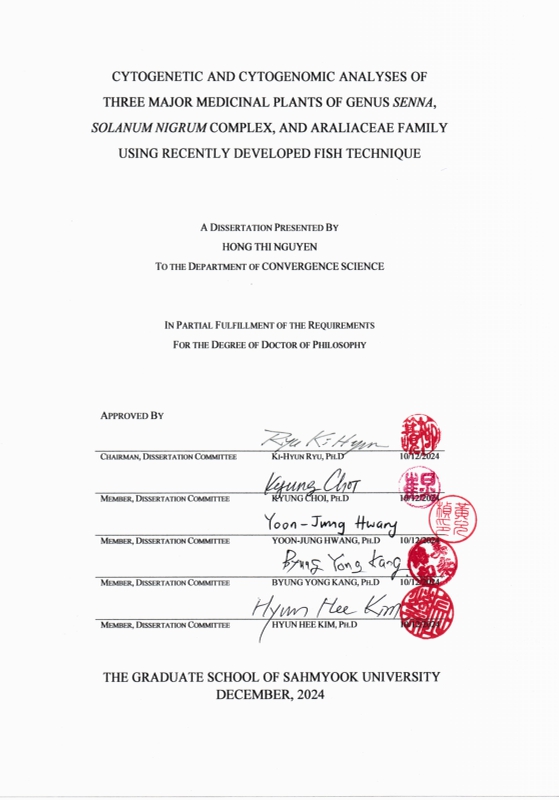
Title Page 2
Contents 10
LIST OF ABBREVIATIONS 17
GENERAL ABSTRACT 19
GENERAL INTRODUCTION 22
LITERATURE REVIEW 26
A. Cytogenetic markers 26
1. Ribosomal DNA and telomeric repeats 26
2. Tandem repeats 27
3. Genome size estimation using flow cytometry 27
B. Cytogenomic markers 28
1. PLOP-FISH and advanced chromosomal mapping 29
2. Barcode oligo-FISH for comparative chromosome mapping 29
3. Chloroplast genome sequences 29
C. The medicinal plants: Senna, Solanum nigrum complex, and Araliaceae species 30
1. Senna species 31
2. Solanum nigrum complex 31
3. Araliaceae species 32
REFERENCES 33
CHAPTER 1. CHROMOSOMAL DYNAMICS IN SENNA: COMPARATIVE PLOP-FISH ANALYSIS OF TANDEM REPEATS 38
ABSTRACT 39
Ⅰ. INTRODUCTION 40
Ⅱ. MATERIALS AND METHODS 42
A. Plant materials 42
B. Chromosome spread preparation 43
C. Repeat mining, probes preparation, and fluorescence in situ hybridization(FISH) 43
Ⅲ. RESULTS 47
A. Chromosome counts 47
B. Distribution of nine S. tora-TR probes 47
Ⅳ. DISCUSSION 74
Ⅴ. CONCLUSION 80
REFERENCES 81
CHAPTER 2. THE COMPLETE CHLOROPLAST GENOME SEQUENCES OF SEVEN SENNA SPECIES: INSIGHTS INTO GENOME EVOLUTION AND PHYLOGENETIC RELATIONSHIPS WITHIN GENUS SENNA 87
ABSTRACT 88
Ⅰ. INTRODUCTION 89
Ⅱ. MATERIALS AND METHODS 92
A. Plant material and DNA extraction 92
B. Chloroplast genome sequencing, assembly, mapping, annotation, and structure 92
C. Codon usage analysis 92
D. Identification of simple sequence repeats (SSRs) and long repeat sequences 93
E. Genome comparison and analysis, IR border, and divergence analyses 93
F. Phylogenetic inference 93
Ⅲ. RESULTS 96
A. Chloroplast genome structure and features 96
B. Repeats structure analysis 100
C. Codon usage bias 101
E. Comparative chloroplast genomic analysis within seven Senna species 105
F. Divergent hotspots in the Senna cp genomes 106
G. Phylogenetic analysis 107
Ⅳ. DISCUSSION 109
A. Chloroplast genome structure and features 109
B. Repeats structure analysis 109
C. Codon usage bias 110
D. Inverted repeat contraction and expansion 110
E. Comparative chloroplast genomic analysis 111
F. Divergent hotspots in the Senna cp genomes 111
G. Phylogenetic analysis 112
Ⅴ. CONCLUSION 113
REFERENCES 114
CHAPTER 3. POLYPLOID EVOLUTION AND CHROMOSOMAL DYNAMICS IN THE SOLANUM NIGRUM COMPLEX: INSIGHTS FROM OLIGO-FISH CHROMOSOME BARCODING 119
ABSTRACT 120
Ⅰ. INTRODUCTION 122
Ⅱ. MATERIALS AND METHODS 125
A. Plant materials 125
B. Chromosome barcode design 125
C. Chromosome preparation 126
D. Fluorescence in situ hybridization (FISH) 126
Ⅲ. RESULTS 128
A. Development of oligo-FISH barcode probes for chromosome identification using single-copy sequences 128
B. Karyotyping of S. americanum 130
C. Karyotyping of S. villosum using S. americanum chromosome barcode 132
D. Karyotyping of S. nigrum using S. americanum chromosome barcode 135
Ⅳ. DISCUSSION 141
Ⅴ. CONCLUSION 143
REFERENCES 144
CHAPTER 4. COMPARATIVE CYTOGENOMICS OF ARALIACEAE: GENOME SIZE EXPANSION, CHROMOSOME EVOLUTION, AND CONSERVATION OF FAMILY-SPECIFIC TANDEM REPEATS 147
ABSTRACT 148
Ⅰ. INTRODUCTION 149
Ⅱ. MATERIALS AND METHODS 151
A. Plant materials 151
B. Repeat mining and quantification 152
C. Probe design 155
D. Chromosome counting and FISH karyotype analysis 157
E. Flow cytometry and genome size estimation 157
Ⅲ. RESULTS 159
A. Chromosomal distribution of rDNAs and telomeric repeat 159
B. Genome size estimation 160
C. Holoploid and monoploid genome sizes 164
D. Total and monoploid karyotype lengths 165
E. FISH revealed a predominant (peri) centromeric distribution of Araliaceae family-specific tandem repeats 165
Ⅳ. DISCUSSION 169
A. Genome size and chromosomal information in the evolutionary context 169
B. Genome expansion in P. ginseng 170
C. Genome dynamics in Araliaceae 170
D. Family-specific TRs in Araliaceae species 171
E. Direction in Araliaceae evolutionary cytogenomics research 172
V. CONCLUSION 174
REFERENCES 175
국문 초록 179
Figure 1.1. FISH images of S. tora-TRs on metaphase chromosomes of the 18 Senna species. Nine TRs... 51
Figure 1.2. FISH karyogram of 18 Senna species obtained using S. tora-TRs. StoTR01_86 is mainly... 52
Figure 1.3. Distribution of StoTR01_86 in metaphase spreads in 18 Senna species. StoTR01_86 signals are... 55
Figure 1.4. Distribution of StoTR03_178 in metaphase spreads in 18 Senna species. StoTR03_178 signal is... 56
Figure 1.5. Distribution of StoTR05_180 in metaphase spreads in 18 Senna species. StoTR05_180 signals are... 57
Figure 1.6. Distribution of StoTR04_55 in metaphase spreads in 18 Senna species. StoTR04_55 signals are... 58
Figure 1.7. Distribution of StoTR06_159 in metaphase spreads in 18 Senna species. StoTR06_159 signals are... 59
Figure 1.8. Distribution of StoIGS_463 in metaphase spreads in 18 Senna species. The StoIGS_463 signal is... 60
Figure 1.9. Distribution of Sto_5S, Sto_45S, and Sto_Tel repeat probes in the metaphase spreads in 18 Senna... 61
Figure 1.10. FISH karyogram showing TR probe distribution in S. aciphylla. Scale bar=5 µm 62
Figure 1.11. FISH karyogram showing TR probe distribution in S. angulata. Scale bar=5 µm 63
Figure 1.12. FISH karyogram showing TR probe distribution in S. aphylla. Scale bar=5 µm 64
Figure 1.13. FISH karyogram showing TR probe distribution in S. artemisioides subsp. petiolaris. Scale bar=... 65
Figure 1.14. FISH karyogram showing TR probe distribution in S. artemisioides nothosubsp. sturtii. Scale bar... 66
Figure 1.15. FISH karyogram showing TR probe distribution in S. bauhinioides. Scale bar=5 µm 66
Figure 1.16. FISH karyogram showing TR probe distribution in S. covesii. Scale bar=5 µm 67
Figure 1.17. FISH karyogram showing TR probe distribution in S. durangensis. Scale bar=5 µm 67
Figure 1.18. FISH karyogram showing TR probe distribution in S. glutinosa subsp. glutinosa. Scale bar=5... 68
Figure 1.19. FISH karyogram showing TR probe distribution in S. hirsuta var. hirta. Scale bar=5 µm 69
Figure 1.20. FISH karyogram showing TR probe distribution in S. lindheimeriana. Scale bar=5 µm 69
Figure 1.21. FISH karyogram showing TR probe distribution in S. obtusifolia. Scale bar=5 µm 70
Figure 1.22. FISH karyogram showing TR probe distribution in S. odorata. Scale bar=5 µm 71
Figure 1.23. FISH karyogram showing TR probe distribution in S. pallida. Scale bar=5 µm 71
Figure 1.24. FISH karyogram showing TR probe distribution in S. reticulata. Scale bar=5 µm 72
Figure 1.25. FISH karyogram showing TR probe distribution in S. roemeriana. Scale bar=5 µm 72
Figure 1.26. FISH karyogram showing TR probe distribution in S. sophera. Scale bar=5 µm 73
Figure 1.27. FISH karyogram showing TR probe distribution in S. wislizeni. Scale bar=5 µm 73
Figure 2.1. Gene structural map of the seven Senna chloroplast genomes. The genes inside and outside the... 97
Figure 2.2. Comparison of SSRs in the chloroplast genomes of seven Senna species. (A): The number of... 100
Figure 2.3. Analysis of long repeat sequences in seven Senna species. (A) The number of four types of... 101
Figure 2.4. Codon composition for the 20 amino acids and stop codons across all protein-coding genes in the... 102
Figure 2.5. Comparison of SSC, LSC, IRa, and IRb boundary regions in the chloroplast genomes of seven... 104
Figure 2.6. Comparison of seven Senna chloroplast genomes using m-VISTA. The gray arrows and thick black... 105
Figure 2.7. Sliding window test of nucleotide diversity (Pi) in the entire chloroplast genome of seven Senna... 106
Figure 2.8. Maximum likelihood(ML) phylogenetic tree based on 70 protein-coding genes from 13 Senna... 108
Figure 3.1. Diagram showing the barcode loci in each chromosome and corresponding barcode libraries.... 126
Figure 3.2. Count of non-overlapping 45-bp oligonucleotides in each S. americanum chromosome 129
Figure 3.3. Chromosomal distribution of oligo probes from the green and red barcode libraries, 5S rDNA, 45S... 130
Figure 3.4. Karyogram of S. americanum shows the distribution of rDNAs, Arabidopsis-type telomeric repeat,... 131
Figure 3.5. Chromosomal distribution of oligo probes from the green and red barcode libraries, 5S rDNA, 45S... 133
Figure 3.6. Karyogram of S. villosum showing the distribution of rDNA, Arabidopsis-type telomeric repeats,... 134
Figure 3.7. Chromosomal distribution of oligo probes from the green and red barcode libraries, 5S rDNA, 45S... 137
Figure 3.8. Karyogram of S. nigrum showing the distribution of 5S rDNA, 45S rDNA, Arabidopsis-type... 138
Figure 3.9. Comparative chromosomal distribution of oligo probes from the green and red barcode libraries,... 139
Figure 3.10. Comparative karyogram between S. americanum, S. villosum, and S. nigrum. Merged signals of... 139
Figure 3.11. Karyotype idiogram of S. americanum, S. villosum, and S. nigrum. The grey chromosomes... 140
Figure 4.1. FISH analysis of 5S rDNA, 45S rDNA, and telomeric repeat in 13 Araliaceae species. Green, red,... 159
Figure 4.2. FISH karyogram of the 13 Araliaceae species. The 5S rDNA, 45S rDNA, and telomeric repeats... 160
Figure 4.3. Flow histogram overlay of G. max, A. elata, and D. mobiferus. G. max and A. elata have... 161
Figure 4.4. Flow histograms of nuclear DNA contents of the 13 Araliaceae species. All major peaks represent... 162
Figure 4.5. FISH metaphase spread of 13 Araliaceae species using ArTR_1, ArTR_2, and ArTR_3 repeat... 167
Figure 4.6. FISH metaphase spread of 13 Araliaceae species using ArTR_4 repeat probes. All species show... 168
약용식물은 전통의학과 약리학의 연구대상이 되어 왔으며, 그 효과는 복잡한 유전체 구조와 진화적 역사에 근원한다. 세포유전학과 유전체학은 염색체 조성, 염색체 재배열, 유전체 구조, 종분화 경로와 같은 유전적 기초를 추적할 수 있는 유용한 도구가 되어 왔으며 약효의 기초를 이해하는 데 기여를 하고 있다. 핵유전체 내 DNA 반복서열 및 단일서열과 엽록체 DNA 분석 등을 통한 세포유전학적 및 세포유전체학적 연구는 식물 유전체 지도를 작성하고 계통발생적 유연관계를 추적하며 종분화를 이해하는 데 필수적이다. 본 연구는 분자생물학적 기술과 생물정보학을 통해 결명자(Senna) 속 18 종, 까마중속(Solanum) 근연 3 종, 두릅나무과(Araliaceae) 13 종의 약용 식물에 대해 유전체 및 염색체 특성을 조사하고 분석하였다. 각 장은 핵유전체서열, 염색체 조성 및 엽록체서열 분석을 통해 이들 주요 약용식물들의 유전체 구조를 밝혔고 염색체 재배열 및 약용 속성의 유전적 기초에 대한 통찰을 제공하였다.
첫 번째 장에서는 콩과(Fabaceae)에 속한 약용 식물인 결명자속(Senna)에 대해 18 종의 유전체 조성 및 염색체 재배열에 미치는 종열반복서열(tandem repeat, TR)의 역할을 중점적으로 다루었다. 명윤결명(Senna tora) 특이 올리고 탐침을 이용한 형광 제자리 혼성화(FISH) 방법을 통해 배수성 및 비배수성에 따라 다양한 TR 분포 패턴이 나타나며, 종에 따라 염색체 수에서 상당한 변화가 있음을 확인하였다. 분석된 TR 중 StoTR01_8 은 종에 따라 대체로 보존적이었으나, StoTR04_55 는 S. obtusifolia에만 존재하고, StoTR03_178 은 배수성에 따라 다양한 분포를 보였다. TR 은 특히 비배수성 염색체 조성을 가진 종에서 풍부했으며, 염색체 차단부 영역에 집중되어 염색체 재배열의 핫스팟 부위로 나타났다. 이러한 결과는 결명자속 종들 간에 복잡한 염색체 재배열을 통한 종분화의 역사가 있었음을 보여주며, 염색체 조성의 다양성과 유전체 진화에 대한 이해를 증진한다.
두 번째 장에서는 결명자속 7 종에 대해 차세대 엽록체 유전체 서열분석을 통해 계통적 유연관계를 추적하였다. 엽록체 유전체는 사중 구조 및 보존적 유전자 구성을 보여 주었으며, 8 개의 특이 마커 핫스팟이 확인되었다. 엽록체 유전체 서열을 활용한 유연관계 분석으로 결명자속 내의 종 분화적 관계를 명확히 할 수 있었으며, 집단 및 생태적 연구의 유전학적 기초를 제공하였다.
세 번째 장에서는 올리고- FISH 바코딩 기법을 사용하여 가지과(solanaceae)의 약용 식물로 알려진 까마중 근연 3 종; 미국까마중(S. americanum), 노랑까마중(S. villosum), 까마중(S. nigrum)에 대해 고해상도 염색체 식별을 위한 분석을 수행하였다. 까마중속(Solanum)은 가지과 내에서 가장 큰 속으로, 주요 작물인 감자, 토마토, 가지 등을 포함하고 있으며, 까마중과 야생 근연종들에 대한 염색체 수준에서의 유전체 조성 분석은 이들 주요 작물에 대한 배수체 진화 및 유전적 다양성에 대한 귀중한 통찰을 제공한다. 본 연구는 단일서열 DNA 영역에서 60,000 개의 올리고뉴클레오타이드를 발굴하고 이를 형광으로 표식한 탐침으로 제작하여 염색체에 형광 제자리 혼성화함으로써 염색체 고유 바코드를 생성케 하였고 고해상도의 염색체 확인 및 종 간 염색체 재배열에 대한 추적을 가능케 했다.
네 번째 장에서는 두릅나무과(Araliaceae)의 약용 가치를 탐구하며, 종간 염색체 재배열에 관련된 종 분화를 추적하기 위해 종열반복서열을 중점적으로 염색체 수준의 유전체 조성을 분석했다. 두릅나무과 식물 10 종에 대한 전장 유전체 서열을 활용하여 Repeat Explorer 의 Read Clusterinbg Algorism 을 통해 두릅나무과 식물 특이 종열반복서열 (ArTR_01, ArTR_02, ArTR_03, ArTR_04)을 발굴하였다. ArTR_04 는 Araliaceae 종의 동원체 영역에 풍부하게 존재하였으나 Panax ginseng에서는 나타나지 않아 구조적 분화를 보였다.
본 연구 결과는 주요 약용 식물에 대한 염색체 수준에서의 유전체 조성 및 종분화 기작을 이해하는 포괄적인 접근법을 제시하였으며 이는 이들 약용식물의 육종 및 개발을 위한 유용한 기초정보가 될 것으로 사료된다.*표시는 필수 입력사항입니다.
| 전화번호 |
|---|
| 기사명 | 저자명 | 페이지 | 원문 | 기사목차 |
|---|
| 번호 | 발행일자 | 권호명 | 제본정보 | 자료실 | 원문 | 신청 페이지 |
|---|
도서위치안내: / 서가번호:
우편복사 목록담기를 완료하였습니다.
*표시는 필수 입력사항입니다.
저장 되었습니다.