대표어
 학술연구정보서비스(KERIS)
권호기사보기
| 기사명 | 저자명 | 페이지 | 원문 | 기사목차 |
|---|
결과 내 검색
동의어 포함
Title Page 1
Abstract 4
Contents 6
Chapter 1. Introduction 14
1.1. Problem Statement 14
1.2. Background Information 16
1.2.1. Evaluation metrics for selecting GCMs 16
1.2.2. Bias Correction Method 17
1.2.3. Quantifying Uncertainty using Bayesian Statistics 17
1.2.4. Extreme Climate Indices Analysis 18
1.3. Objectives of the Research 20
1.4. Structure of the Dissertation 21
Chapter 2. Methodology, Study Area, and Data 23
2.1. Study area 23
2.2. Brief description of data used in this study 23
2.3. Brief description of methods used 24
2.3.1. Spatial Performance Indicators and Comprehensive Rating Metric 24
2.3.2. Bias correction methods 25
2.3.3. Bayesian Modeling with PyMC3 25
2.3.4. ECIs analysis 26
Chapter 3. Evaluation and Selection of CMIP6 GCMs for Long-term Hydrological Projections Based on Spatial Performance Assessment Metrics 28
3.1. Abstract 28
3.2. Introduction 28
3.3. Study Area and Data 32
3.3.1. Study Area 32
3.3.2. Weather Station and CMIP6 Datasets 33
3.4. Research Process and Methodology 35
3.4.1. Research Process 35
3.4.2. Spatial Petjbrmance Indicators 36
3.4.3. Comprehensive Rating Metric 39
3.5. Results and Discussion 40
3.5.1. Assessment of Spatial Pattern of Mean Annual Precipitation (MAP) and Mean Monsoon Precipitation (MMP) 40
3.5.2. Ranking of GCMs based on different Indicators and Comprehensive Rating Metric 45
3.5.3. Evaluation of the Bias for the Selected GCMs Subset 48
3.6. Conclusion 52
Chapter 4. Selecting Bias Correction Methods, Estimating Spatio-Temporal Future Precipitation Variability, and Utilizing Bayesian Inference for Uncertainty Distribution in Bias-Corrected CMIP6 Projections 54
4.1. Abstract 54
4.2. Introduction 55
4.3. Study Area and Data 58
4.4. Approach method 60
4.4.1. Study flowchart 60
4.4.2. Select the best-performing Bias correction method 61
4.4.3. Evaluate the future multiscale precipitation 64
4.4.4. The uncertainty distribution of model parameters 65
4.5. Results and Discussions 69
4.5.1. The best-performing Bias Correction method 69
4.5.2. Adjusting future simulations for niultiscale precipitation 77
4.5.3. Evaluate the uncertainty of predicted precipitation 94
4.6. Conclusions 107
Chapter 5. Assessing CMIP6 Model Performance on Extreme Precipitation Using ETCCDI Indices 110
5.1. Abstract 110
5.2. Introduction 111
5.3. Data and Methodology 114
5.3.1. Data 114
5.3.2. Methodology 116
5.4. Results and Discussion 120
5.4.1. Spatial distribution of ECIs 120
5.4.2. Analysis of Kling-Gupta Efficiency (KGE) 131
5.4.3. Annual trend analysis 132
5.4.4. Temporal patterns 134
5.4.5. Probability distribution 135
5.5. Conclusions 137
Chapter 6. Summary, Conclusions, and Future Works 140
6.1. Summary 140
6.2. Conclusions 141
6.2.1. Conclusions regarding evaluating GCM performance and selecting High-Performing CMIP6 GCMs 141
6.2.2. Conclusions regarding Bias correction methods, future precipitation variability, and Bayesian Inference on uncertainty quantification 142
6.2.3. Conclusions regarding assessing CMIP6 model performance on extreme precipitation using ETCCDI indices 142
6.3. Limitations and Future Work 144
REFERENCES 146
List of abbreviations 160
국문초록 162
Figure 3.1. A map showing South Korea and the weather station 32
Figure 3.2. An interpolation procedure of climate data from weather stations and... 36
Figure 3.3. Spatial distribution of mean annual precipitation (MAP) over the historical... 43
Figure 3.4. Spatial distribution of mean monsoon precipitation (MMP) over the... 44
Figure 3.5. Spatial patterns of the mean monsoon precipitation (MMP) over the... 49
Figure 3.6. Spatial patterns of the mean monsoon precipitation (MMP) over the... 49
Figure 3.7. Spatial patterns of the mean monsoon precipitation (MMP) over the... 50
Figure 3.8. Spatial patterns of MMP over 1973-2014. The bias-corrected MMP... 51
Figure 4.1. The study area 60
Figure 4.2. The study flowchart 61
Figure 4.3. Bayesian work flow 66
Figure 4.4. The relationship between each parameter for the Normal distribution (a)... 69
Figure 4.5. Comparison between observed data and uncorrected historical monthly... 70
Figure 4.6. Comparison between observed, uncorrected, and corrected historical data... 72
Figure 4.7. Spatial distributions of total annual precipitation of CESM2, CMCC-ESM2... 74
Figure 4.7S. Spatial distributions of mean DJF (a), MAM (b), JJA (c), and SON... 75
Figure 4.8. CDF plots of annual data in the near future and far future under CESM2-... 79
Figure 4.8S1. CDF plots of seasonal (DJF, MAM, JJA, and SON) data in the near future... 80
Figure 4.8S2. CDF plots of daily data in the near future and far future under CESM2-... 82
Figure 4.9. Distributions of annual data in the near future and far future under CESM2-... 85
Figure 4.9S. Temporal distributions of seasonal data in the historical period, near (2025-... 86
Figure 4.10. Temporal distributions of observed (black lines), historical GCM (dashed... 88
Figure 4.10S. Temporal distributions of future (dashed pink lines) and corrected future... 89
Figure 411. Spatial distributions of total annual precipitation of CESM2, CMCC-... 90
Figure 4.12. Spatial distributions of mean DJF (a), MAM (b), JJA (c), and SON... 93
Figure 4.13. Spatial distributions of mean daily precipitation of CESM2, CMCC-ESM2... 93
Figure 4.14. The Posterior predictive distributions of daily data under Nomial and... 94
Figure 4.14S1. The Posterior predictive distributions of seasonal precipitation under... 95
Figure 4.14S2. The Posterior predictive distributions of annual data under Nonnal and... 96
Figure 4.15. Inference data histogram and MCMC trace for CESM2-245 near daily... 97
Figure 4.15S1. Inference Data Histogram and MCMC Trace in terms of daily data in... 98
Figure 4.15S2. Inference data histogram and MCMC trace in terms of DJF in the near... 100
Figure 4.15S3. Inference data histogram and MCMC trace in terms of JJA in the near... 102
Figure 4.15S4. Inference data histogram and MCMC trace in terms of annual data 104
Figure 5.1. Maps indicating the climatological mean bias in CDD compared to the... 121
Figure 5.2. Maps indicating the climatological mean bias in PRCPTOT compared to... 123
Figure 5.3. Maps indicating the climatological mean bias in R20mm compared to the... 125
Figure 5.4. Maps indicating the climatological mean bias in R95p compared to the... 126
Figure 5.5. Maps indicating the climatological mean bias in Rx1day compared to the... 127
Figure 5.6. Maps indicating the climatological mean bias in Rx5day compared to the... 129
Figure 5.7. Maps indicating the climatological mean bias in SDII compared to the... 130
Figure 5.8. Portrait diagram of KGE values of models for the extreme precipitation... 131
Figure 5.9. The nonnalized σ, the r, and the RMSE within the models relative to the... 134
Figure 5.10. Probability Distribution Function of (a) CDD, (b) PRCPTOT, (c)... 136
기후변화는 홍수와 가뭄과 같은 극한 기상 현상의 빈도와 심각성을 심화시켜 지구 및 지역 수자원 관리에 중대한 과제를 제기하고 있습니다. 본 연구는 한국의 기후 예측 및 수문 계획 개선을 위해 CMIP6(Coupled Model Intercomparison Project Phase 6) 지구 기후 모델(GCM)의 활용을 최적화하기 위한 통합 프레임워크를 개발합니다. 본 연구는 고성능 GCM을 발굴하고, 편향 보정 기법을 적용하며, 극한 기후 지수(ECI)를 분석하여 신뢰할 수 있는 장기 예측 및 위험 완화 전략을 지원하는 것을 목표로 합니다.
총 32개의 CMIP6 GCM을 공간 성능 지표(SPAEF, Kling-Gupta Efficiency, KGE), Cramer's V, Fractions Skill Score(FSS)를 사용하여 평가했습니다. 이 지표는 연간 및 몬순(JJAS) 기간 동안 과거 강수 패턴을 재현하는 능력을 기반으로 합니다. 강수량을 과대평가하는 일반적인 경향에도 불구하고 네 가지 모델(FIO-ESM-2-0, CESM2-WACCM, CESM2, CMCC-ESM2)이 가장 우수한 성능을 보였습니다. 본 연구는 GCM 순위를 변경하고 불일치를 유발할 수 있으므로 모델 선택 후 편향 보정을 적용해야 함을 강조합니다.
편향 보정을 위해 시간 조정에는 CDF 매칭(CDFm) 방법을, 공간적 세분화에는 경험적 분위수 매핑(EQM) 방법을 사용했습니다. PyMC3에 구현된 베이지안 선형 회귀 프레임워크를 사용하여 강수량 예측의 불확실성을 정량화했습니다. 일별 및 계절별 강수량 예측(2025~2060년 및 2065~2100년)은 상대적으로 낮은 불확실성을 보였으며, 이는 정책 및 계획 수립 시 보정된 GCM 결과의 신뢰성을 강화합니다.
극한 기상 현상 시뮬레이션에서 모델 성능을 평가하기 위해, CDD, PRCPTOT, R20mm, R95p, Rx1day, Rx5day, SDII를 포함한 ECI를 일 강수량 데이터를 사용하여 계산했습니다. 수정된 Mann-Kendall(MMK) 검정, Theil- Sen Estimator(TSE), Taylor 다이어그램, Kernel Density Estimation(KDE)과 같은 통계 도구를 활용한 분석 결과, BCC-CSM2-MR과 GFDL-CM4가 PRCPTOT, R20mm, Rx1day, Rx5day와 같은 지수를 정확하게 재현하는 것으로 나타났습니다. 또한, GISS-E2-1-G, ACCESS-CM2, IITM-ESM은 CDD와 SDII에서 우수한 성능을 보였습니다. ECI 공간 분포의 지역적 불일치 또한 지역별 편향 보정의 필요성을 강조했습니다.
전반적으로, 이 다중 규모, 모델 비의존적 접근법은 극한 기상 현상 예측의 정확도를 크게 향상시켜 적응형 수자원 관리 전략을 지원합니다. 이 프레임워크는 유연하며 다른 기후 변수, 지역 및 시간 규모로 확장될 수 있습니다. 본 연구는 한국을 비롯한 전 세계의 지속 가능한 기후 적응, 자원 관리 및 재난 위험 저감을 위한 탄탄한 과학적 기반을 제공합니다.*표시는 필수 입력사항입니다.
| 전화번호 |
|---|
| 기사명 | 저자명 | 페이지 | 원문 | 기사목차 |
|---|
| 번호 | 발행일자 | 권호명 | 제본정보 | 자료실 | 원문 | 신청 페이지 |
|---|
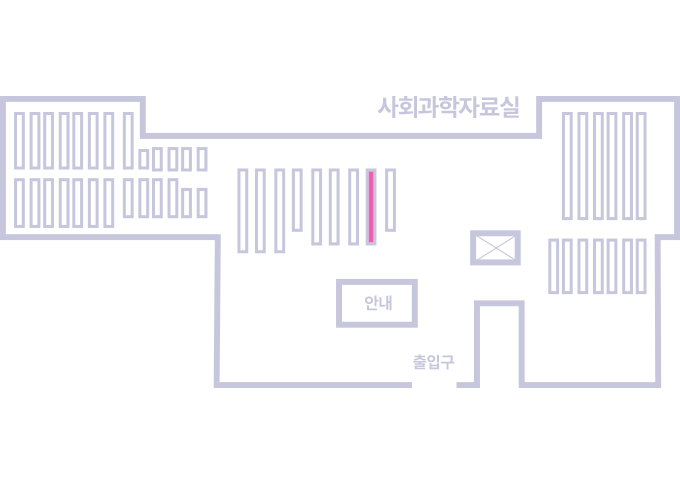
도서위치안내: / 서가번호:
우편복사 목록담기를 완료하였습니다.
*표시는 필수 입력사항입니다.
저장 되었습니다.