대표어
 학술연구정보서비스(KERIS)


권호기사보기
| 기사명 | 저자명 | 페이지 | 원문 | 기사목차 |
|---|
결과 내 검색
동의어 포함
Title Page 2
Abstract 4
Contents 6
Chapter 1. Introduction 15
1.1. Background 15
1.2. Thermo-mechanical processing Ti-6Al-4V 16
1.3. Dynamic restoration mechanisms 17
Chapter 2. Brief summary 21
2.1. Characterization of microstructure during iso-thermal compression under quasi-static condition 22
2.2. Modeling and prediction of microstructure and flow stress during isothermal compression under quasi-static condition 23
Part Ⅰ. Characterization of microstructure during isothermal compression under quasi-static condition 25
Section 1 26
Chapter 3. Experimental procedure 26
Chapter 4. Experimental results 31
Chapter 5. Discussion 32
Section 2 39
Chapter 6. Microstructure characterization procedure 39
Chapter 7. Experimental results 42
Chapter 8. Discussion 71
Chapter 9. Conclusion 102
Part Ⅱ. Modeling and prediction of microstructure and flow stress during isothermal compression under quasi-static condition 105
Chapter 10. Introduction 106
Chapter 11. A cellular automata model for simulating dynamic recrystallization and phase transformation in Ti-6Al-4V 108
11.1. Evolution of dislocation density 112
11.2. Modeling dynamic recrystallization 113
11.3. Modeling dynamic phase transformation 116
11.4. Model parameter identification 120
Chapter 12. Results and discussion 123
Chapter 13. Conclusion 126
Chapter 14. Overall conclusion 127
14.1. Summary 127
14.2. Outlook 129
Bibliography 130
Korean abstract 143
Figure 3-1. Specimen extraction from as-received bar 27
Figure 3-2. Hot compression specimen setup. (a) Spot welding of thermocouple onto... 29
Figure 3-3. (a) Phase fraction with temperature calculated from JMatPro (dashed-... 30
Figure 4-1. Isothermal compressed true stress-strain curves at temperatures 850 ℃,... 31
Figure 5-1. Specimen (left) before compression, and (right) after compression 34
Figure 5-2. Change in heat capacity (Cₚ) and density (ρ) values with temperature (in... 34
Figure 5-3. (a) Isothermal compression curves, compressed at 850 ℃, 900 ℃,... 35
Figure 6-1. Microstructure observation areas of specimens compressed to (left) 0... 41
Figure 6-2. Process schematic of α and α' phase separation, reconstruction of β, and... 41
Figure 7-1. (a) SEM micrograph of as-received microstructure. (b) EBSD phase and... 43
Figure 7-2. Grain orientation spread (GOS) map. Low GOS (LGOS) ranging from... 44
Figure 7-3. EBSD IQ-IPF maps for compression temperatures... 46
Figure 7-4. EBSD IPF maps with LAGBs (white lines) and HAGBs (black lines)... 47
Figure 7-5. EBSD GOS maps with α-low grain orientation spread (LGOS) as or-... 48
Figure 7-6. EBSD IQ-IPF maps of areas of interest (AOI) indicated in Fig. 7-5: (a)... 49
Figure 7-7. EBSD IQ-IPF maps of initial microstructures (0 εtr) of cooled speci-... 51
Figure 7-8. Enlarged view of 850 ℃ heat-treated sample at 0 εₜᵣ. (a) and (b) are... 52
Figure 7-9. (a) Phase fraction change with compression temperatures ranging from... 53
Figure 7-10. (a) HAGB and LAGB fraction change, and (b) HGOS and LGOS frac-... 55
Figure 7-11. Enlarged EBSD phase maps and corresponding GOS maps for view of... 58
Figure 7-12. For specimens compressed at 850 ℃. (a) The α-phase fraction (gray... 60
Figure 7-13. GOS and GB fraction of samples compressed at 850 ℃. α-HAGB as... 61
Figure 7-14. Specimens compressed at 950 ℃. Change in (a) phase fraction with in-... 63
Figure 7-15. GOS and GB fraction of samples compressed at 950 ℃. β-HAGB as... 64
Figure 7-16. Specimens compressed at 900 ℃. Change in (a) phase fraction with in-... 67
Figure 7-17. Specimens compressed at 925 ℃. Change in (a) phase fraction with in-... 68
Figure 7-18. Change in GB fraction and GOS fraction with strain for (a, c) α... 70
Figure 8-1. GOS map of the specimen compressed at 850 ℃, up to 0.1 εₜᵣ, with in-... 80
Figure 8-2. Schmid factor distributions of specimens compressed at 850 ℃ under... 83
Figure 8-3. Phase texture maps as IPF. Intensity given in Table 8.4 85
Figure 8-4. (a) Enlarged grains of A1 in Fig. 7-15 (near-β sample compressed to 0.1... 89
Figure 8-5. (a) Enlarged view of A2 in Fig. 7-15. IPF map with reconstructed β and... 91
Figure 8-6. At compression temperature 900 ℃. Schmid factor (SF) map with val-... 95
Figure 8-7. At compression temperature 925 ℃. (c) Schmid factor (SF) map with... 98
Figure 8-8. Schematic illustration of deformation behaviors at near-α, α+β, and near-... 101
Figure 11-1. Framework for DRX, DPT included CA model. (a) Cell and grain... 109
Figure 11-2. Flowchart of the numerical procedure for the modeling of microstructure... 111
Figure 12-1. Manifestation of DRX, DPT, and RDPT of α and β grains with in-... 125
Figure 12-2. (a) Experimental and (b) CA predicted flow curves when deformed at... 125
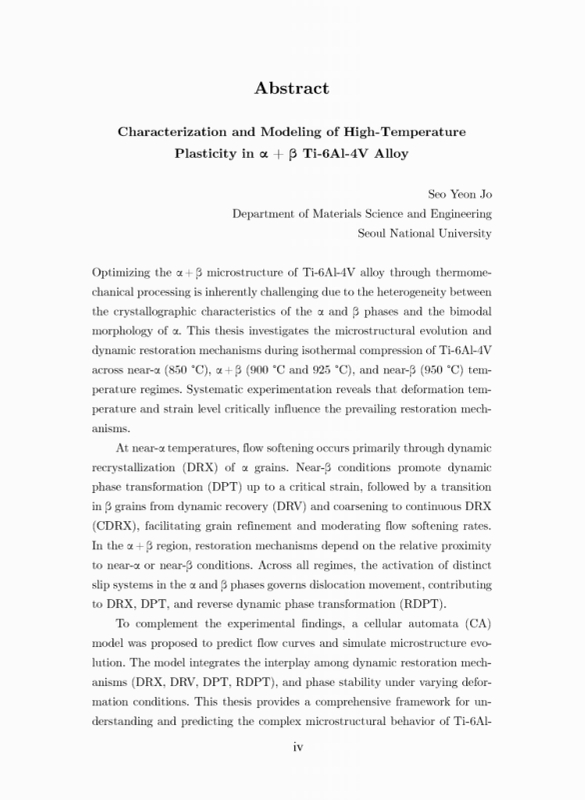
열-기계적 처리를 통해 Ti-6Al-4V 합금의 α + β 미세구조를 최적화는 α 상과 β 상의 결정학적 특성 간의 이질성과 α상의 bimodal 형태로 인해 어려움이 많다. 이 학위 논문에서는 Ti-6Al-4V의 동온 압축 동안 near-α (850 ℃), α + β (900 ℃ 및 925 ℃), near-β (950 ℃) 온도 영역에서의 미세구조 변화와 동적 회복 메커니즘을 체계적인 실험을 통해 규명하고자 한다. 변형 온도와 변형량이 회복 메커니즘에 중요한 영향을 미친다는 사실을 확인하였으며, 동적회복(DRV), 동적재결정(DRX), 동적상변태(DPT)에 더해 역동적상변태(RDPT)가 복합적으로 발생하는 것을 규명하였다.
본 학위 논문을 통해 동일 소재에서 초기 고온 미세조직에 따라 등온 변형 중 발생되는 미세조직 변화가 달라짐을 확인하였다. Near-α 온도에서는 주로 α 결정립의 DRX을 통해 유동 연화가 발생되며 near-β 조건에서는 임계 변형률까지는 DPT가 촉진되고 이 후의 변형 상태에서는 β 결정립이 DRV 및 결정립 조대화 메커니즘에서 연속 동적재결정(CDRX)로 전환됨을 규명하였다. 이러한 메커니즘 변화로 인해 유동 연화가 가속화 또는 완화되는 효과를 확인하였다. α+β 영역에서는 회복 거동이 near-α 또는 near-β에 근접한 조건인가에 따라 달라지는 것 또한 규명하였다. 상세 연구를 통해 모든 온도 영역에서 α 상과 β 상의 전단계(slip system) 활성화에 따라 전위(dislocation) 이동이 결정되며, 이는 DRX, DPT 및 RDPT에 영향을 미치는 것으로 규명하였다.
실험적으로 얻은 결과를 바탕으로 기존의 셀룰러오토마타(CA) 모델보다 강건성있게 유동 곡선 및 미세구조 변화 거동을 예측하기 위한 모델을 제안하였다. 기존의 모델과 달리 본 모델은 결정립의 동적 회복 거동인 DRX, DRV, DPT, RDPT 를 모두 반영하였다.
이 학위 논문은 고온 변형 중 Ti-6Al-4V 합금의 복잡한 미세구조 거동을 이해하고 예측하기 위한 포괄적인 프레임워크를 제공함으로써, 미세구조 제어를 통한 열-기계적 처리 최적화 연구에 기여하고자 한다.*표시는 필수 입력사항입니다.
| 전화번호 |
|---|
| 기사명 | 저자명 | 페이지 | 원문 | 기사목차 |
|---|
| 번호 | 발행일자 | 권호명 | 제본정보 | 자료실 | 원문 | 신청 페이지 |
|---|
도서위치안내: / 서가번호:
우편복사 목록담기를 완료하였습니다.
*표시는 필수 입력사항입니다.
저장 되었습니다.