대표어
 학술연구정보서비스(KERIS)
권호기사보기
| 기사명 | 저자명 | 페이지 | 원문 | 기사목차 |
|---|
결과 내 검색
동의어 포함
Title Page 2
Abstract 6
Contents 7
CHAPTER 1. INTRODUCTION 16
1.1. Background of Study 16
1.2. Problem Statement 17
1.3. Justification of Study 18
1.4. Research Aim and Objectives 18
1.5. Research Questions 19
1.6. Significance of Study 19
1.7. Scope of Study 20
CHAPTER 2. LITERATURE REVIEW 21
2.1. Conceptual and Theoretical Foundations 21
2.1.1. Water Security and Adaptive Capacity 21
2.1.2. Integrated Water Resources Management (IWRM) in Ghana 21
2.1.3. Resilience Theory in Water Systems 22
2.1.4. The Vulnerability, Resiliency, and Reliability (VRR) Framework 22
2.1.5. Adaptive Management under Uncertainty 22
2.1.6. Shared Socioeconomic Pathways (SSPs) and Climate Futures 23
2.2. Climate Variability Analysis Tools and Indices 25
2.2.1. Standardized Precipitation Index (SPI) Applications in Ghana 25
2.2.2. Comparative Drought Indices (SPEI, PDSI, RAI) 25
2.2.3. International Applications of Drought Indices 26
2.2.4. Limitations and Data Gaps in Ghana 26
2.3. Illegal Mining (Galamsey) and Water Insecurity in Ghana 26
2.3.1. Geographic Distribution of Galamsey in Ghana's Gold Belt 26
2.3.2. Hydrological Impacts of Galamsey (Pollution, Sedimentation, Turbidity) 27
2.3.3. Socio-Economic Drivers of Galamsey 27
2.3.4. Governance and Policy Responses 28
2.3.5. Climate Variability and the Double Exposure Context 28
2.4. Rainwater Barrel Sharing Network (RBSN) in Ghana and Beyond 29
2.4.1. Historical and Global Applications of RBSN 29
2.4.2. RBSN in Ghana: Pilots and Community Adoption 29
2.4.3. Evaluating RBSN Using VRR Metrics 29
2.4.4. International Lessons from Asia, India, Brazil, and South Korea 30
2.4.5. Barriers to RBSN Adoption in Ghana 30
2.5. Integrating Climate Variability, Galamsey, and RBSN 31
2.5.1. Double Exposure in Gold Belt Communities 31
2.5.2. Overlaying SPI and Galamsey Hotspots 31
2.5.3. VRR Analysis of RBSN under SSP Scenarios 32
2.5.4. International Lessons from Mining-Affected Regions 32
2.5.5. The Role of Storage-Reliability-Yield (SRY) Graphs 32
2.6. Identified Research Gaps 34
2.6.1. Theoretical Gaps 34
2.6.2. Methodological Gaps 34
2.6.3. Contextual Gaps 34
2.6.4. Scenario Gaps 35
2.6.5. Integration Gaps 35
2.7. Summary of Literature Review 35
CHAPTER 3. RESEARCH METHODOLOGY 37
3.1. Introduction to Methodology 37
3.1.1. Justification of Methodology 38
3.2. Study Areas 40
3.2.1. Geographic Location and Extent 40
3.2.2. Climate and Rainfall Patterns 41
3.2.3. Hydrological Characteristics 42
3.2.4. Socio-Economic Context (Mining and Agriculture) 42
3.3. Data Sources and Collection 43
3.3.1. Meteorological Data (Rainfall) 43
3.3.2. Hydrological and Water Resources Data 44
3.3.4. Socio-Economic and Galamsey Data 44
3.3.5. Rainwater Harvesting Data (Household and Community Systems) 44
3.4. Climate Modeling and SPI Analysis 45
3.4.1. Tools and Software (MATLAB Application) 45
3.4.2. Data Pre-Processing and Normalization 45
3.4.2. Data Cleaning 46
3.4.2. Data Conversion 46
3.4.2. SPI Calculation (1-, 3-, 6-, 12-Months Timescales) 46
3.4.2. Validation of SPI with Historical Events 47
3.4.2. Integration of SSP Scenarios (1-2.6, 2-4.5, 3-7.0, 5-8.5) 47
3.5. Rainwater Harvesting System (RBSN) Performance Evaluation 48
3.5.1. Reliability of RBSN 49
3.5.2. Resiliency of RBSN 49
3.5.3. Vulnerability of RBSN 50
3.5.4. Storage-Reliability-Yield (SRY) Analysis 50
3.5. Limitations of the Methodology 51
CHAPTER 4. RESULTS AND DISCUSSION 53
4.1. Introduction 53
4.3. Annual Maximum Daily Rainfall 54
4.3.1. Obuasi (Ashanti Region Hotspot) 55
4.3.2. Tarkwa Nsuaem (Western Region Hotspot) 57
4.3.3. Daboya (Northern Region Hotspot) 59
4.3.4. Comparative Synthesis Across Study Locations 61
4.3.4. Transition to SPI-Based Drought Assessment 62
4.4. Standardized Precipitation Index (SPI) Analysis 63
4.4.1. Obuasi (Historical SPI Results) 64
4.4.2. Obuasi - SPI under SSP1-2.6 65
4.4.3. Obuasi - SPI under SSP5-8.5 67
4.4.4. Tarkwa Nsuaem (Historical SPI Results) 70
4.4.5. Tarkwa Nsuaem - SPI under SSP1-2.6 71
4.4.6. Tarkwa Nsuaem - SPI under SSP5-8.5 73
4.4.7. Daboya - Historical SPI (12-Months) 76
4.4.8. Daboya under SSP1-2.6 77
4.4.9. Daboya - SSP5-8.5 Scenario 79
4.5. Selection of Ideal Location for Rainwater Harvesting Systems 93
4.4. Rainwater Sharing Barrel Network (RWSBN) Performance Assessment (Obuasi Case Study) 96
4.4.1. Monthly Average Rainfall Comparison 96
4.4.1. Reliability 99
4.4.2. Resiliency 102
4.4.3. Vulnerability 105
4.4.4. Storage-Reliability-Yield (SRY) Analysis 108
4.4.5. Storage Requirements Across Scenarios 111
4.4.6. Synthesis for Obuasi 113
4.4.7. Policy Implications for RBSN in Ghana 114
4.6. Key Findings and Reflections 115
CHAPTER 5. CONCLUSION 117
5.1. Summary of Findings 117
5.2. Contributions of the Study 117
5.3. Limitations of the Study 118
5.4. Policy Implications 119
5.5. Recommendations for Future Research 119
5.6. Closing Reflections 120
REFERENCES 121
초록 130
Figure 1. shows drivers of surface water vulnerability and alternative water sources 40
Figure 2. shows Map of Ghana showing the study regions: a) Northern region... 41
Figure 3. shows a conceptual community (RWSBN) illustrated with Ten households... 48
Figure 4. Annual Maximum Daily Rainfall under SSP1-2.6 and SSP5-8.5 for Obuasi... 56
Figure 5. Annual Maximum Daily Rainfall under SSP1-2.6 and SSP5-8.5 for... 58
Figure 6. Annual maximum daily rainfall under SSP1-2.6 and SSP5-8.5 for Daboya... 60
Figure 7. shows the historical rainfall 64
Figure 8. shows SPI analysis across a) 1, b) 3, c) 6, and d) 12-months timescales... 66
Figure 9. shows SPI analysis across a) 1, b) 3, c) 6, and d) 12-months timescales... 68
Figure 10. shows the historical rainfall 70
Figure 11. shows SPI analysis across a) 1, b) 3, c) 6, and d) 12-months timescales... 72
Figure 12. shows SPI analysis across a) 1, b) 3, c) 6, and d) 12-months timescales... 74
Figure 13. shows the historical rainfall 76
Figure 14. shows SPI analysis across a) 1, b) 3, c) 6, and d) 12-months timescales... 78
Figure 15. shows SPI Analysis Across 1-, 3-, 6-, and 12-Months Timescales under... 80
Figure 16. Total duration of SPI-based Drought and Wet Events under SSP1-2.6 and SSP5-8.5 Scenarios for Obuasi 82
Figure 17. Total Frequency of events under SSP1-2.6 and SSP5-8.5 Scenarios for Obuasi 85
Figure 18. Total duration of extreme drought and extreme wet events under SSP1-2.6... 89
Figure 19. Total duration of severe drought and severe wet events under SSP1-2.6... 91
Figure 20. Monthly Average Rainfall Distribution for Obuasi under a) historical b)... 97
Figure 21. Reliability of rainwater storage for 10 users in Obuasi under a)... 99
Figure 22. comparison of system reliability (r) under different storage capacities for... 100
Figure 23. Resiliency of rainwater storage for 10 users in Obuasi under a) historical,... 102
Figure 24. Comparison of system resiliency (γ) under different storage capacities for... 103
Figure 25. Vulnerability of rainwater storage for 10 users in Obuasi under a)... 105
Figure 26. Comparison of vulnerability (ν) under different storage capacities for a)... 106
Figure 27. Storage-Reliability Relationship for the Rainwater Barrel Sharing... 110
Figure 28. Change in reliability for 9-user RBSN compared to a single-user system... 112
Figure 29. Required storage volumes for different reliability targets (Re) in Obuasi... 113
본 연구는 기후 변화 시나리오 하에서 가나 오부아시(Obuasi)의 물 안보 향상을 위한 지역 맞춤형 적응 대책으로서 레인배럴 공유 네트워크(Rainwater Barrel Sharing Networks, RBSN)의 가능성을 평가하였다. 오부아시는 타르크와 은수암(Tarkwa Nsuaem)과 다보야(Daboya) 등 다른 광산 지역을 포함하는 가나 금광 지대의 대표 도시로, 이중 우기(bimodal rainfall regime)를 지니면서도 불법 소규모 채광(갤럼시, galamsey)로 인한 심각한 수질 오염이 공존하는 지역이다. 이러한 수문학적 잠재력과 사회·환경적 긴급성이 결합된 사례로서 본 연구의 주요 대상지로 선정되었다.
연구는 새로운 기후시나리오로 제시되는 공유사회경제경로(Shared Socioeconomic Pathways, SSP1-2.6 및 SSP5-8.5) 하의 과거 및 미래 강우 자료를 활용하여 표준강수지수(Standardized Precipitation Index, SPI)로 강우 변동성을 분석하고, Vulnerability-Reliability-Resiliency(VRR) 및 Storage-Reliability-Yield(SRY) 분석 틀을 적용하여 RBSN 의 성능을 평가하였다. 분석 결과, RBSN 의 신뢰도는 저장 용량이 증가할수록 향상되지만, 배출 시나리오에 따라 차이를 보였다. SSP1-2.6 에서는 안정적인 강우 패턴을 배경으로 저장용량 10-12㎥/㎡, 해당 기간 일평균 강우량 대비 수요비율 0.6 일 때 약 80-90%의 신뢰도를 달성하였다. 반면 SSP5-8.5 에서는 강우의 불규칙성이 커져 동일한 신뢰도를 유지하기 위해 14-16㎥/㎡ 의 저장용량이 필요하였으며, 건기장기화로 인해 복원력은 감소하고 취약도는 증가하였다. SRY 분석에서는 수요비율 0.6 이 산출 효율성과 저장 안정성 간의 균형을 이루는 최적 설계 기준으로 나타났다.
기술적 성능을 넘어, RBSN 은 오부아시의 수질 오염 저감과 가뭄 대응력 강화라는 이중 효과를 제공한다. 분산형 빗물 저장 시스템을 통해 오염된 지표수 의존도를 줄이고, 채광으로 인한 토양 훼손 및 홍수 피해를 완화할 수 있다. 연구는 RBSN 이 지역 강우 특성에 기반한 설계, 공동체 중심의 관리, 국가 물 관리 체계와의 통합을 전제로 할 때, 가나의 광산 지역에서 실현 가능한 기후 적응 전략임을 입증하였다. 따라서 정책 입안자들은 RBSN 을 가나 국가 기후변화 적응계획(National Climate Adaptation Plan)에 포함하고, 인센티브 제공, 기술 교육, 대중 인식 제고를 통해 장기적이고 회복력 있는 물 관리 체계를 구축할 것을 제안한다.*표시는 필수 입력사항입니다.
| 전화번호 |
|---|
| 기사명 | 저자명 | 페이지 | 원문 | 기사목차 |
|---|
| 번호 | 발행일자 | 권호명 | 제본정보 | 자료실 | 원문 | 신청 페이지 |
|---|
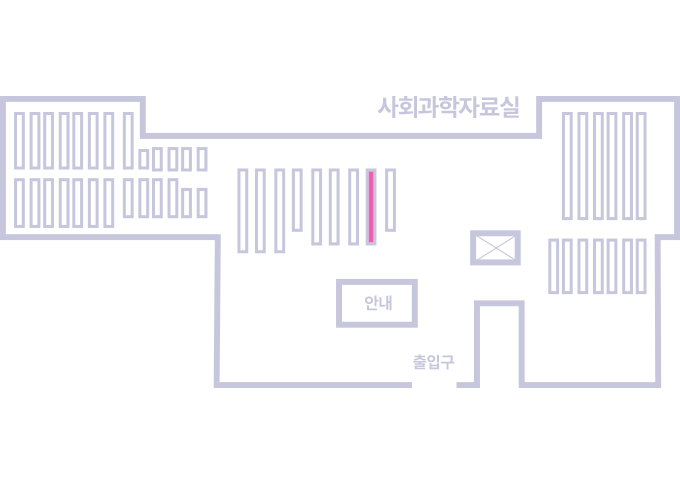
도서위치안내: / 서가번호:
우편복사 목록담기를 완료하였습니다.
*표시는 필수 입력사항입니다.
저장 되었습니다.