
 대표어
대표어


권호기사보기
| 기사명 | 저자명 | 페이지 | 원문 | 기사목차 |
|---|
결과 내 검색
동의어 포함
목차
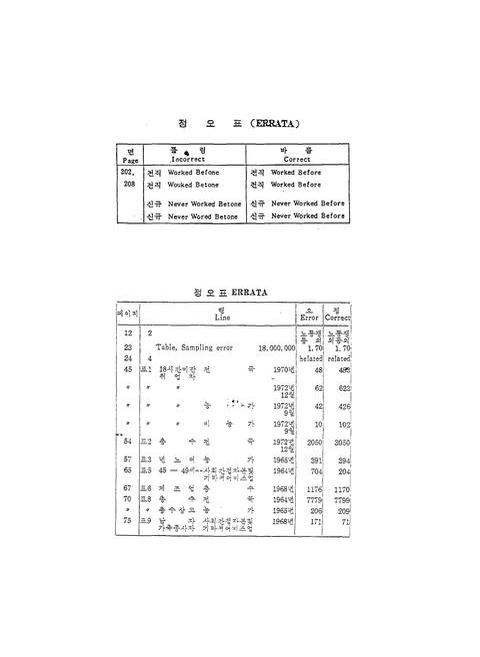
정오표=0,1,1
표제지=0,2,2
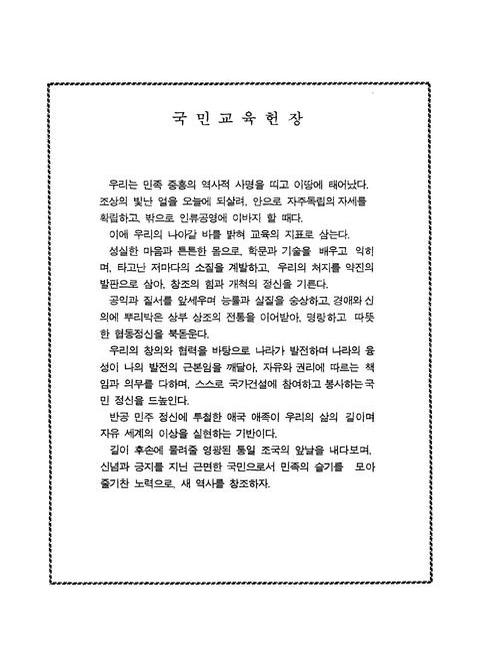
국민교육헌장=0,4,1
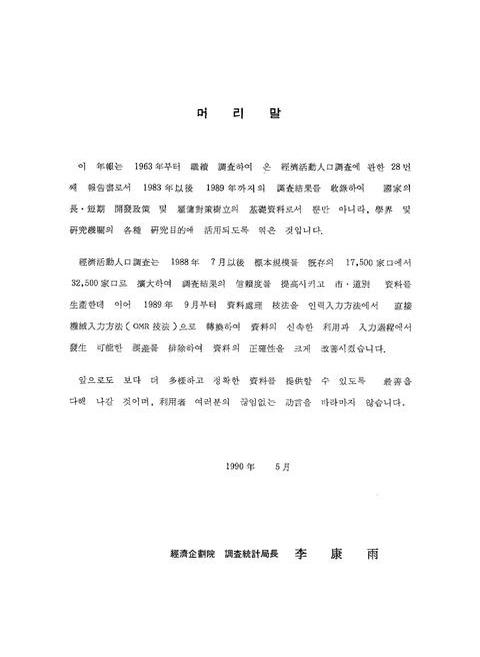
머리말=0,5,2
이용자를 위하여=0,7,1
차례=0,8,6
I. 조사개요=1,14,1
1. 조사연혁=1,14,1
2. 조사목적=1,14,1
3. 조사범위=1,14,1
4. 조사항목=1,14,2
5. 조사대상 기간=2,15,1
6. 조사방법=2,15,1
7. 용어해설=2,15,2
8. 표본설계 개요=3,16,7
II. 1989년 경제활동인구 동향=10,23,9
통계표(I) 1983~1989년(월별자료)=19,32,1
1. 경제활동인구 총괄=20,33,18
2. 연령계층별 경제활동인구=38,51,18
3. 연령계층별 비경제활동인구=56,69,18
4. 상태별 비경제활동인구=74,87,6
5. 연령계층별 취업자=80,93,18
6. 교육정도별 취업자=98,111,18
7. 산업별 취업자=116,129,6
8. 산업 및 연령계층별 취업자=122,135,6
9. 직업별 취업자=128,141,6
10. 종사상 지위별 취업자=134,147,12
11. 산업 및 종사상 지위별 취업자=146,159,6
12. 산업 및 취업시간별 취업자=152,165,10
13. 연령계층별 실업자=162,175,6
14. 교육정도별 실업자=168,181,18
15. 계절조정 실업률=186,199,1
통계표(II) 1988년도(연평균자료)=187,200,1
1. 경제활동인구 총괄=188,201,1
2. 가구주와의 관계, 배우관계 및 성별 15세이상 인구=189,202,1
3. 연령계층, 산업 및 성별 취업자=190,203,1
4. 연령계층, 직업 및 성별 취업자=191,204,1
5. 연령계층, 종사상 지위 및 성별 취업자=192,205,1
6. 취업시간, 산업 및 성별 취업자=193,206,1
7. 취업시간, 직업 및 성별 취업자=194,207,1
8. 교육정도, 종사상 지위, 산업 및 성별 취업자=195,208,1
9. 교육정도, 종사상 지위, 직업 및 성별 취업자=196,209,1
10. 직업, 산업 및 성별 취업자=197,210,1
11. 가구주와의 관계, 교육정도, 전산업 및 성별 실업자=198,211,1
12. 연령계층, 배우관계 및 성별 실업자=199,212,1
13. 전직업, 전산업 및 성별 실업자=200,213,1
14. 교육정도, 전종사상의 지위, 전직업 및 성별 전직 실업자=201,214,1
15. 구직기간별 실업자=202,215,1
통계표(III) 1989년도(연평균자료)=203,216,1
1. 경제활동인구 총괄=204,217,1
2. 가구주와의 관계, 배우관계 및 성별 15세이상 인구=205,218,1
3. 연령계층, 산업 및 성별 취업자=206,219,1
4. 연령계층, 직업 및 성별 취업자=207,220,1
5. 연령계층, 종사상 지위 및 성별 취업자=208,221,1
6. 취업시간, 산업 및 성별 취업자=209,222,1
7. 취업시간, 직업 및 성별 취업자=210,223,1
8. 교육정도, 종사상 지위, 산업 및 성별 취업자=211,224,1
9. 교육정도, 종사상 지위, 직업 및 성별 취업자=212,225,1
10. 직업, 산업 및 성별 취업자=213,226,1
11. 가구주와의 관계, 교육정도, 전산업 및 성별 실업자=214,227,1
12. 연령계층, 배우관계 및 성별 실업자=215,228,1
13. 전직업, 전산업 및 성별 실업자=216,229,1
14. 교육정도, 전종사상 지위, 전직업 및 성별 전직 실업자=217,230,1
15. 구직기간별 실업자=218,231,1
부록=219,232,1
1. 월별('89. 11)결과 주요항목별 표본오차=220,233,2
2. 연평균 결과 주요항목별 표본오차=222,235,3
3. 경제활동인구 조사표=225,238,4
판권지=229,242,1
영문목차
errata=0,1,1
title page=0,2,4
PREFACE=0,6,1
Explanatory Notes=0,7,4
CONTENTS=0,11,8
I. OUTLINE OF THE ECONOMICALLY ACTIVE POPULATION SURVEY=6,19,1
1. History of the Survey=6,19,1
2. Purpose of the Survey=6,19,1
3. Scope of the Survey=6,19,1
4. Survey Items=6,19,2
5. Date and Period of the Survey=7,20,1
6. Method of the Survey=7,20,1
7. Concepts and Definitions=7,20,1
8. Sample Design=7,20,12
Statistical Tables(I) 1983~1989(Monthly Data)=19,32,1
1. Summary Table of Economically Active Population=20,33,18
2. Economically Active Population by Age Group=38,51,18
3. Not Economically Active Population by Age Group=56,69,18
4. Not Economically Active Population by Activity Type=74,87,6
5. Employed Persons by Age Group=80,93,18
6. Employed Persons by Educational Attainment=98,111,18
7. Employed Persons by Industry=116,129,6
8. Employed Persons by Industry and Age Group=122,135,6
9. Employed Persons by Occupation=128,141,6
10. Employed Persons by Status of Workers=134,147,12
11. Employed Persons by Industry and Status of Workers=146,159,6
12. Employed Persons by Industry and Hours Worked=152,165,10
13. Unemployed Persons by Age Group=162,175,6
14. Unemployed Persons by Educational Attainment=168,181,18
15. Unemployment rates, seasonally adjusted=186,199,1
Statistical Tables(II) 1988(Yearly Data)=187,200,1
1. Summary Table of Economically Active Population=188,201,1
2. Population 15 Years Old and Over by Relationship to Household Head, Marital Status and Sex=189,202,1
3. Employed Persons by Age Group, Industry(Major Division) and Sex=190,203,1
4. Employed Persons by Age Group, Occupation (Major Group) and Sex=191,204,1
5. Employed Persons by Age Group, Status of Workers and Sex=192,205,1
6. Employed Persons by Hours Worked, Industry (Major Division) and Sex=193,206,1
7. Employed Persons by Hours Worked, Occupation (Major Group) and Sex=194,207,1
8. Employed Persons by Educational Attainment, Status of Workers, Industry (Major Division) and Sex=195,208,1
9. Employed Persons by Educational Attainment, Status of Workers, Occupation (Major Group) and Sex=196,209,1
10. Employed Persons by Occupation (Major Group), Industry (Major Division) and Sex=197,210,1
11. Unemployed Persons by Relationship to Household Head, Educational Attainment, Former Industry (Major Division) and Sex=198,211,1
12. Unemployed Persons by Age Group, Marital Status and Sex=199,212,1
13. Unemployed Persons by Former Occupation (Major Group), Former Industry (Major Division) and sex=200,213,1
14. Unemployed Persons Worked Before by Educational Attainment, Former Working Status, Former Occupation (Major Group) and Sex=201,214,1
15. Unemployed Persons by Duration of Seeking Work=202,215,1
Statistical Tables(III) 1989 (Yearly Data)=203,216,1
1. Summary Table of Economically Active Population=204,217,1
2. Population 15 Years Old and Over by Relationship to Household Head, Marital Status and Sex=205,218,1
3. Employed Persons by Age Group, Industry (Major Division) and Sex=206,219,1
4. Employed Persons by Age Group, Occupation (Major Group) and Sex=207,220,1
5. Employed Persons by Age Group, Status of Workers and Sex=208,221,1
6. Employed Persons by Hours Worked, Industry (Major Division) and Sex=209,222,1
7. Employed Persons by Hours Worked, Occupation (Major Group) and Sex=210,223,1
8. Employed Persons by Educational Attainment, Status of Workers, Industry (Major Division) and Sex=211,224,1
9. Employed Persons by Educational Attainment, Status of Workers, Occupation (Major Group) and Sex=212,225,1
10. Employed Persons by Occupation (Major Group), Industry (Major Division) and Sex=213,226,1
11. Unemployed Persons by Relationship to Household Head, Educational Attainment, Former Industry (Major Division) and Sex=214,227,1
12. Unemployed Persons by Age Group, Marital Status and Sex=215,228,1
13. Unemployed Persons by Former Occupation (Major Group), Former Industry(Major Division) and Sex=216,229,1
14. Unemployed Persons Worked Before by Educational Attainment, Former Working Status, Former Occupation (Major Group) and Sex=217,230,1
15. Unemployed Persons by Duration of Seeking Work=218,231,1
Annex=219,232,1
1. Sampling Error by Major Items(Monthly Data)=220,233,2
2. Sampling Error by Major Items(Yearly Data)=222,235,5
3. Economically Active Population Survey=227,240,3
| 등록번호 | 청구기호 | 권별정보 | 자료실 | 이용여부 |
|---|---|---|---|---|
| 0000491781 | R 312.058 ㄱ284ㄱ | 89 | 서울관 서고(열람신청 후 1층 대출대) | 이용가능 |
| 0000491782 | R 312.058 ㄱ284ㄱ | 89 | 부산관 서고(열람신청 후 2층 주제자료실) | 이용가능 |
*표시는 필수 입력사항입니다.
| 전화번호 |
|---|
| 기사명 | 저자명 | 페이지 | 원문 | 기사목차 |
|---|
| 번호 | 발행일자 | 권호명 | 제본정보 | 자료실 | 원문 | 신청 페이지 |
|---|
도서위치안내: / 서가번호:

우편복사 목록담기를 완료하였습니다.
*표시는 필수 입력사항입니다.
저장 되었습니다.
