
 대표어
대표어


권호기사보기
| 기사명 | 저자명 | 페이지 | 원문 | 기사목차 |
|---|
결과 내 검색
동의어 포함
목차
[표제지 등]=0,1,2
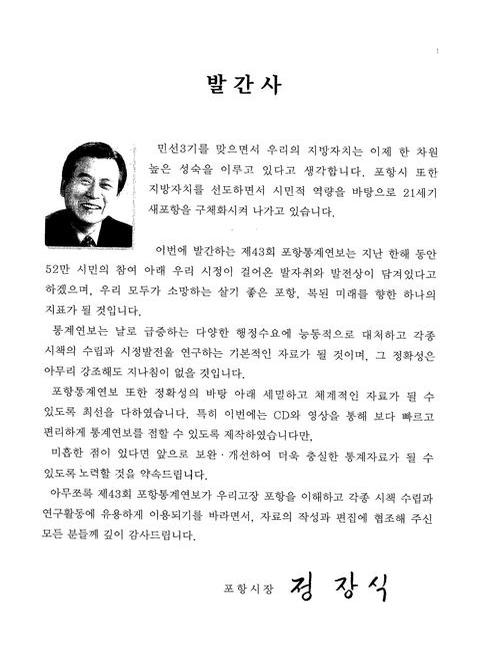
발간사=1,3,1
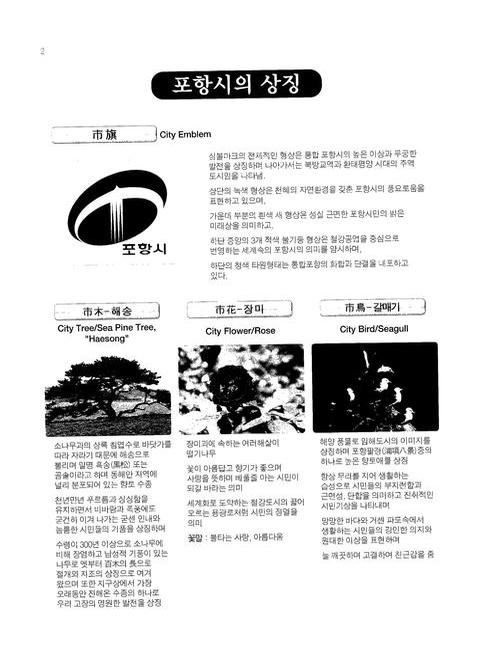
포항시의 상징=2,4,1
시정목표=3,5,1
포항시민헌장=4,6,2
포항시민의 노래=6,8,2
공무원윤리헌장=8,10,1
통계도표=9,11,15
이용자를 위하여=24,26,3
총목차=27,29,1
목차=28,30,11
I. 연혁=39,41,1
1. 연혁=39,41,6
2. 지역특성=45,47,1
II. 토지 및 기후=46,48,1
1. 위치=46,48,1
2. 행정구역=47,49,1
3. 토지지목별 현황=48,50,4
4. 일기일수=52,54,1
5. 기상개황=52,54,2
6. 강수량=54,56,1
7. 해안선 및 도서=54,56,1
III. 인구=55,57,1
1. 인구추이=55,57,1
2. 읍면동별 세대 및 인구(주민등록인구)=56,58,2
3. 리별 세대 및 인구=58,60,12
4. 연령(5세계급) 및 성별인구=70,72,4
5. 혼인상태별 인구(15세이상 인구)=74,76,2
6. 인구동태=76,78,1
7. 인구이동=76,78,2
8. 주요 국적별 외국인 등록 현황=78,80,2
IV. 노동=80,82,1
1. 노동조합=80,82,2
2. 산업연맹별 노동조합=82,84,2
3. 노사분규 발생현황=84,86,1
4. 직업훈련 현황=85,87,1
V. 사업체 총괄=86,88,1
1. 산업대분류별 사업체 총괄=86,88,1
2. 종사자규모별 사업체수 및 종사자수=86,88,2
3. 산업별 사업체 및 종사자수=88,90,2
VI. 농림수산업=90,92,1
1. 농가 및 농가인구=90,92,1
2. 경지면적=90,92,1
3. 경지정리 현황=90,92,1
4. 농업진흥지역 지정=91,93,1
5. 농지개량조합=92,94,1
6. 수리답 및 경지정리 현황=92,94,1
7. 수리시설 및 방조제 현황=92,94,2
8. 식량작물 생산량(정곡)=94,96,1
8-1. 미곡=94,96,1
8-2. 맥류=94,96,2
8-3. 잡곡=96,98,1
8-4. 두류=96,98,1
8-5. 서류=96,98,2
9. 채소류 생산량=98,100,4
10. 특용작물 생산량=102,104,1
11. 약용작물 생산량=102,104,2
12. 뽕밭면적 및 고치생산량=104,106,1
13. 과실류 생산량=104,106,1
14. 벼 품종별식부현황=104,106,2
15. 추곡수매실적=106,108,2
16. 하곡수매실적=108,110,2
17. 정부관리양곡보관창고=110,112,2
18. 정부양곡 가공공장=112,114,1
19. 미곡종합처리장 현황=112,114,2
20. 농업협동조합=114,116,2
21. 농업용기구 및 기계보유=116,118,2
22. 농업용 관정, 양수장비 현황=118,120,2
23. 비료공급=120,122,2
24. 가축사육가구 및 마리=122,124,2
25. 가축전염병 발생=124,126,2
26. 가축전염병 예방주사 실시=126,128,2
27. 수의사 분포=128,130,1
28. 도축 검사=128,130,1
29. 배합사료 생산=128,130,2
30. 축산물 위생관계 업소=130,132,2
31. 소유별 임야면적=132,134,1
32. 임상별 산림면적=132,134,2
33. 임상별 임목축적=134,136,1
34. 임산물 생산량=134,136,2
35. 수렵=136,138,1
36. 수렵면허장 발급=136,138,1
37. 사방사업=136,138,2
38. 조림=138,140,2
39. 산림피해=140,142,2
40. 산림형질변경 허가내역=142,144,1
41. 보안림 지정 현황=142,144,1
42. 토석채취 현황=142,144,2
43. 어가 및 어가인구=144,146,1
44. 어항=144,146,1
45. 어선보유=144,146,2
46. 수산물 어획고=146,148,1
47. 수산물 가공품 생산고=146,148,2
48. 수산물 계통 판매고=148,150,2
49. 수산업협동조합=150,152,2
VII. 광공업=152,154,1
1. 광업 및 제조업=152,154,1
2. 중분류별 광업 및 제조업=152,154,2
3. 광공업 중분류별 사업체수 및 종사자수=154,156,2
4. 광종별 광구수=156,158,1
5. 광산물 생산=156,158,1
6. 산업 및 농공단지=156,158,2
7. 민수용탄수급=158,160,2
8. 연탄생산량=160,162,1
9. 석유류 소비량=160,162,1
VIII. 전기ㆍ가스ㆍ수도=161,163,1
1. 발전현황=161,163,1
2. 용도별 전력 사용량=162,164,2
3. 제조업 중분류별 전력사용량=164,166,2
4. 가스공급량=166,168,2
5. 상수도=168,170,2
6. 상수도관=170,172,2
7. 급수사용량=172,174,2
8. 급수사용량 부과=174,176,2
9. 하수도=176,178,2
10. 하수사용료 부과=178,180,2
IX. 유통ㆍ금융ㆍ보험 및 기타 서비스=180,182,1
1. 시장분포=180,182,2
2. 금융기관=182,184,2
3. 금융기관예금, 대출 및 어음=184,186,2
4. 새마을금고=186,188,1
5. 농수산물 도매시장별 유통량=186,188,1
6. 수출입 통관 실적=187,189,1
6-1. 수출실적=188,190,2
6-2. 수입실적=190,192,2
7. 농림수산물 수출입실적=192,194,2
X. 주택ㆍ건설=194,196,1
1. 주택의 종류=194,196,1
2. 주택의 점유형태=194,196,1
3. 건축허가=194,196,2
4. 아파트 건립=196,198,2
5. 용도지구=198,200,2
6. 토지거래 현황=200,202,2
7. 도시계획=202,204,2
8. 공원=204,206,1
9. 하천=204,206,2
10. 하천부지점용=206,208,2
11. 도로=208,210,1
12. 도로시설물=208,210,2
13. 교량=210,212,2
14. 건설장비=212,214,1
15. 풍수해 발생=212,214,2
XI. 교통ㆍ관광 및 정보통신=214,216,1
1. 자동차 등록=214,216,2
1-1. 자동차 등록(월별 및 차종별)=216,218,2
2. 영업용 자동차 업종별 수송=218,220,2
3. 주차장=220,222,1
4. 철도수송=220,222,2
5. 항공수송=222,224,1
6. 여객선수송=223,225,1
7. 해운화물 수송(입ㆍ출항)=224,226,1
7-1. 해운화물수송(입항)=224,226,2
7-2. 해운화물수송(출항)=226,228,2
8. 관광사업체등록=228,230,2
9. 관광객수 및 관광수입=230,232,1
10. 우편시설=230,232,2
11. 우편물 취급=232,234,1
12. 우편요금 수입=232,234,2
13. 국내 전보취급=234,236,1
14. 전화사용=234,236,1
15. 전화시설 및 가입자수=234,236,2
16. 행정전산장비보유=236,238,2
16-1. 행정전산장비보유=238,240,2
XII. 보건 및 사회보장=240,242,1
1. 의료기관=240,242,2
2. 의료기관종사 의료인력=242,244,2
3. 보건소 인력=244,246,1
4. 보건지소 및 보건진료소 인력=244,246,2
5. 방문 간호사업 실적=246,248,1
6. 보건교육 실적=246,248,1
7. 부정의료업자 단속실적(의료인 등)=246,248,2
7-1. 부정의료업자 단속실적(의료기관)=248,250,2
8. 의약품 등 제조업소 및 판매업소=250,252,2
9. 예방 접종=252,254,1
10. 법정전염병 발생 및 사망=252,254,4
11. 한센병 보건소 등록=256,258,1
12. 결핵환자 보건소 등록=256,258,2
13. 가족사업계획 실적=258,260,1
14. 모자보건사업 실적=258,260,2
15. 식품위생관계업소=260,262,2
16. 공중위생관계업소=262,264,2
17. 국민건강보험 수혜자=264,266,1
18. 국민건강보험 대상자 진료실적=264,266,2
19. 국민연금 가입자=266,268,1
20. 국가보훈 대상자=266,268,2
21. 국가보훈대상자 취업=268,270,1
22. 국가보훈대상자 자녀취학=268,270,2
23. 헌혈사업실적=270,272,2
24. 국민기초생활보장수급자=272,274,2
25. 사회복지시설=274,276,2
26. 노인정(경로당)=276,278,1
27. 노인복지시설수용=277,279,1
28. 여성복지시설수용=278,280,2
29. 여성상담실시=280,282,1
30. 소년ㆍ소녀 가정현황=281,283,1
31. 보육시설=282,284,1
32. 아동복지시설 수용=282,284,2
33. 장애인등록현황=284,286,2
34. 장애인 복지시설 수용=286,288,1
35. 부랑인 시설수용=286,288,2
36. 묘지 및 납골시설=288,290,2
XIII. 환경=290,292,1
1. 환경오염물질 배출시설=290,292,2
2. 환경오염배출시설 단속 및 행정조치=292,294,2
3. 쓰레기수거=294,296,4
4. 생활폐기물 매립지=298,300,2
5. 분뇨발생량 및 처리현황=300,302,6
6. 하수처리장 및 처리실적=306,308,2
XIV. 교육 및 문화=308,310,1
1. 학교 총개황=308,310,2
2. 유치원=310,312,1
3. 초등학교=310,312,2
4. 중학교(국ㆍ공립)=312,314,1
5. 중학교(사립)=312,314,2
6. 일반계고등학교(국ㆍ공립)=314,316,1
7. 일반계고등학교(사립)=314,316,2
8. 실업계고등학교(국ㆍ공립)=316,318,1
9. 실업계고등학교(사립)=316,318,2
10. 전문대학=318,320,1
11. 대학(교)=318,320,2
12. 대학원=320,322,1
13. 기타학교=320,322,2
14. 적령아동취학=322,324,1
15. 사설학원=322,324,2
16. 공공도서관=324,326,1
17. 박물관=324,326,2
18. 문화재=326,328,2
19. 예술단=328,330,1
20. 문화공간=329,331,1
21. 체육시설=330,332,2
22. 청소년수련시설=332,334,1
23. 언론매체=332,334,2
24. 출판사 및 인쇄소 등록=334,336,1
25. 출판ㆍ인쇄 및 기록매체업 현황=334,336,2
XV. 재정=336,338,1
1. 국세징수=336,338,1
2. 지방세징수=336,338,3
3. 예산결산 총괄=338,340,2
4. 일반회계 세입예산 개요=340,342,1
4-1. 일반회계 세입결산=340,342,2
5. 일반회계 세출예산 개요=342,344,1
5-1. 일반회계 세출결산=342,344,2
6. 특별회계 예산결산=344,346,1
7. 교육비 특별회계 세입결산=345,347,1
8. 교육비 특별회계 세출결산=345,347,1
9. 시 공유재산=346,348,2
XVI. 공공행정 및 사법=348,350,1
1. 공무원 총괄=348,350,2
2. 시본청 공무원=350,352,2
3. 의회 및 사업소, 구청 공무원=352,354,2
4. 읍면동 공무원=354,356,2
5. 소방 공무원=356,358,1
6. 퇴직사유별 공무원=356,358,2
7. 공무원훈련자=358,360,2
8. 관내 관공서 및 주요기관=360,362,4
9. 민원서류처리=364,366,1
1O. 여권발급=364,366,2
11. 범죄발생 및 검거=366,368,1
12. 연령별피의자=366,368,2
13. 학력별피의자=368,370,1
14. 소년범죄=368,370,2
15. 외국인 범죄=370,372,1
16. 화재발생=370,372,2
17. 원인별 화재발생=372,374,1
18. 장소별 화재발생=372,374,1
19. 산불발생현황=372,374,2
20. 소방장비=374,376,2
21. 소방구급 및 구조활동=376,378,2
22. 소방대상물 현황=378,380,1
23. 위험물 제조소 설치현황=378,380,2
24. 재난사고 발생 및 피해현황=380,382,2
25. 자동차단속 및 처리=382,384,2
26. 교통사고발생(자동차)=384,386,1
27. 운전면허 소지자=384,386,2
28. 운전면허 시험실시=386,388,3
XVII. 전국통계=389,391,2
1. 남.북한 주요경제지표=391,393,1
2. 전국 행정구역 총괄=392,394,2
3. 인구추이=394,396,2
4. 연령별(5세 계급) 인구=396,398,2
5. 주요 경제지표=398,400,8
6. 경제활동인구=406,408,3
7. 산업별 취업자=409,411,1
8. 직업별 취업자=410,412,2
9. 시.도별 산업생산ㆍ출하ㆍ재고지수=412,414,2
10. 전도시 근로자가구의 가구당 월평균 가계수지=414,416,6
11. 전도시 전가구의 가구당 월평균 가계지출=420,422,6
12. 생산자 물가지수=426,428,6
13. 전도시 소비자물가지수=432,434,6
14. 통합 재정수지=438,440,4
15. 국내총생산에 대한 지출=442,444,2
16. 경제활동별 국내총생산 및 국민총소득=444,446,2
17. 지역 총생산=446,448,2
18. 수출입 총괄=448,450,2
19. 주요국별 수출=450,452,3
20. 주요국별 수입=453,455,3
21. 자동차 등록=456,458,3
XVIII. 국제통계=459,461,2
1. 인구=461,463,2
2. 조출생률 및 조사망률=463,465,1
3. 실업률=464,466,1
4. 국민총소득(경상가격)=465,467,1
5. 국내 총생산=466,468,2
6. 생산자 물가지수=468,470,1
7. 소비자 물가지수=469,471,1
8. 통화량=470,472,2
9. 무역=472,474,2
10. 경제성장률(국내총생산)=474,476,1
11. 1인당 국민총소득(경상가격)=475,477,1
12. 수출입 단가지수=476,478,1
13. 국제수지(경상수지)=477,479,2
XIX. 부록=479,481,2
1. 역대 시장ㆍ군수=481,483,2
2. 경상북도의회 의원 명단(포항지역)=483,485,1
3. 포항시의회 의원명단=483,485,3
4. 포항시의회 기구표=486,488,1
5. 2002년도 시의회 회기별 안건처리 현황=486,488,1
6. 지정문화재=487,489,2
7. 주요통계지표=489,491,1
8. 곡류총량 중량환산표=490,492,1
9. 도량형환산표=491,493,2
10. 포항시행정전화번호표=493,495,6
[화보]=499,501,9
판권지=508,510,1
영문목차
[title page etc]=0,1,6
The Charter of Pohang citizens=5,7,1
Song of Pohang Citizens=6,8,3
[STATISTICS IN CHARTS]=9,11,16
EXPLANATORY NOTES=25,27,2
[Contents]=27,29,1
[LIST OF TABLES]=28,30,11
I. HISTORY=39,41,1
1. History=39,41,6
2. Regional Characteristics=45,47,1
II. LAMD & CLIMATE=46,48,1
1. Location=46,48,1
2. Area and Number of Administrative Units=47,49,1
3. Area of Land Category=48,50,4
4. Weather Days=52,54,1
5. Summary of Meteorological Data=52,54,2
6. Preciptation=54,56,1
7. Coastline and Island=54,56,1
III. POPULATION=55,57,1
1. Trend of Population=55,57,1
2. Household & Population by EupㆍMyeon and Dong(Resident Registration)=56,58,2
3. Household & Population by Ri=58,60,12
4. Population by Five-Year Age Groups and Gender=70,72,4
5. Population by Married Status=74,76,2
6. Population Vital Statistics=76,78,1
7. Interal Migration=76,78,2
8. Registered foreigners by Major Nationality=78,80,2
IV. LABOR=80,82,1
1. Labor Unions=80,82,2
2. Labor Unions by Industrial Federation=82,84,2
3. The status of Labor Disputes Occurrence=84,86,1
4. The Status of Vocational Training=85,87,1
V. SUMMARY TABLE OF ESTABLISHMENTS=86,88,1
1. Summary of Establishments by Industry=86,88,1
2. Number of Establishments and Workers by Workforce Size=86,88,2
3. Number of Establishments and Workers by Industry=88,90,2
VI. Agriculture, Forestry and Fishing=90,92,1
1. Farm Households and Population=90,92,1
2. Area of Cultivated Land=90,92,1
3. Status of Cultivated Land Arrangements=90,92,1
4. Land Designated for Agricultural Promotion=91,93,1
5. Improving Association of Farmland=92,94,1
6. Status of Rice Paddy Irrigation & Land Cultivation=92,94,1
7. Status of Irrigation Facilities & Tide Embankments=92,94,2
8. Production of Food Grain(Polished)=94,96,1
8-1. Rice=94,96,1
8-2. Wheat and Barley=94,96,2
8-3. Miscellaneous Grains=96,98,1
8-4. Beans=96,98,1
8-5. Potatoes=96,98,2
9. Production of Vegetables=98,100,4
10. Production of Oil Seeds & Special Crops=102,104,1
11. Production of Medical Purposes Crops=102,104,2
12. Size of Mulberry Fields & Production of Cocoons=104,106,1
13. Production of Fruit=104,106,1
14. Status of Cultured Area by Paddy a Kind=104,106,2
15. Government-Purchased Rich by Grains & Kind=106,108,2
16. Government-Purchased Barley by Grains=108,110,2
17. Warehouse for Government Grains=110,112,2
18. Processing Plants of Government Grains=112,114,1
19. Status of Rice Processed Centers=112,114,2
20. National Agricultural Cooperative Federation=114,116,2
21. Agricultural Instruments & Machinery Holding=116,118,2
22. Status of Water Pump and Agricultural Facilities=118,120,2
23. Supply of Chemical Fertilizers=120,122,2
24. Number of Livestock, Poultry Feeders=122,124,2
25. Infectious Livestock Disease by Case=124,126,2
26. Livestock Vaccinated Against Infetious Disease=126,128,2
27. Distribution of Veterinans=128,130,1
28. Inspection of Slaughted Livestock=128,130,1
29. Production of Assorted Feed=128,130,2
30. Number Licensed Livestock Products premised by Business Type=130,132,2
31. Area of Forest Land by Ownership=132,134,1
32. Area of Forest Land by Forest Type=132,134,2
33. Growing Stock by Forest Type=134,136,1
34. Production of Forest Products=134,136,2
35. Hunting=136,138,1
36. Issue of Hunting License=136,138,1
37. Forest Erosion Control Works=136,138,2
38. Reforestation by Project=138,140,2
39. Forest Damage=140,142,2
40. Permits for Forest Conversion=142,144,1
41. Forest Designated for Protection=142,144,1
42. Status of Quarrying=142,144,2
43. Fishery Households and Population=144,146,1
44. Fishing Port=144,146,1
45. Fishing Vessel Ownership=144,146,2
46. Fish Catches of Fishery Products=146,148,1
47. Producyion of Processed Fishery Commodities=146,148,2
48. Consignment Sale of Fishery Products=148,150,2
49. Fishery Cooperative Federation=150,152,2
VII. Mining and Manufacturing=152,154,1
1. Mining and Manufacturing=152,154,1
2. Mining and Manufacturing by Size of Establishments=152,154,2
3. No. of Establishments and Works by Division of Industry=154,156,2
4. Number of Mines by Kind=156,158,1
5. Mineral Production=156,158,1
6. Industrial and Agricultural Complex=156,158,2
7. Demand and Supply of Coals for Residential and Commercial Uses=158,160,2
8. Production of Coals=160,162,1
9. Consumption of Petroleum=160,162,1
VIII. Electricity & Gas & Waterworks=161,163,1
1. Electricity Generation=161,163,1
2. Electric Power Consumption by Use=162,164,2
3. Electric Power Consumption by Division of Industry=164,166,2
4. Supply of Gas=166,168,2
5. Public Water Services=168,170,2
6. Public Water Pipe=170,172,2
7. Consumption of Water supplied=172,174,2
8. Charges for Water Consumption=174,176,2
9. Sewerage=176,178,2
10. Charges for Use of Sewage Facilities=178,180,2
IX. Marketing, Financial Institution, Insurance and Other Service=180,182,1
1. Distribution of Market=180,182,2
2. Financial Institutions=182,184,2
3. Deposit Loan and Bill of Financial Institution=184,186,2
4. Community Credit Cooperatives=186,188,1
5. Trading Volume of Agricultural & Marine Products by Wholesale Market=186,188,1
6. Exports and Imports by Customs Clearance=187,189,1
6-1. Exports=188,190,2
6-2. Imports=190,192,2
7. Exports and Imports by Agriculture and forestry of Marine Products=192,194,2
X. Dwelling & Construction=194,196,1
1. Type of Housing Units=194,196,1
2. Housing Type of Occupancy=194,196,1
3. Permits for Building Construction=194,196,2
4. Construction of Apartment=196,198,2
5. Land by Purpose=198,200,2
6. Land Transactions by Use and Purpose=200,202,2
7. Urban Planning=202,204,2
8. Park=204,206,1
9. Legal River=204,206,2
10. Use of River Sites=206,208,2
11. Roads=208,210,1
12. Road Facilities=208,210,2
13. Bridges=210,212,2
14. Construction Machinery and Equipments=212,214,1
15. Damages from Storms & Floods=212,214,2
XI. TrafficㆍTourism and Information Communication=214,216,1
1. Registered Motor Vehicles=214,216,2
1-1. Registered Motor Vehicles(Monthly, Vehicles)=216,218,2
2. Transportation of Commercial Motor Vehicle by Type of Business=218,220,2
3. Parking Place=220,222,1
4. Transportation by Railroad=220,222,2
5. Transportation by Aviation=222,224,1
6. Transportation by Passenger Vessels=223,225,1
7. Freight by Shipping=224,226,1
7-1. Freight by Shipping=224,226,2
7-2. Freight by Shipping=226,228,2
8. Registration of Tourist Service Establishments=228,230,2
9. Number of Tourists and Tourism Receipts=230,232,1
10. Postal Service Facilities=230,232,2
11. Handing of Postal Matters=232,234,1
12. Receipts from Postal Charges=232,234,2
13. Handing of Domestic Telegrams=234,236,1
14. Telephone Use=234,236,1
15. Telephone Facilities and Subscribers=234,236,2
16. Administrative Communication Facilities=236,238,2
16-1. Administrative Communication Facilities=238,240,2
XII. Health and Social Security=240,242,1
1. Medical Institutions=240,242,2
2. Number of Personnels Employed in Medical Institutions=242,244,2
3. Number of Staff in Health Centers=244,246,1
4. Number of Staffs in Health Sub Center and Primary Health care Centers=244,246,2
5. Home Visiting Health Service=246,248,1
6. Health Education=246,248,1
7. Regulated for Illegal Medical Dealer(Medical ractitioners etc.)=246,248,2
7-1. Regulated for Illegal Medical Dealer(Medical Facilities)=248,250,2
8. Number of Manufactures and Stores of Pharmaceutical Goods etc.=250,252,2
9. Vaccinations against Major Communicable Disease=252,254,1
10. Cases & Death of Communicable Disease=252,254,4
11. Registered Leprosy Patient at Health Centers=256,258,1
12. Registered TㆍB Patients at Health Centers=256,258,2
13. Achievement of Family Planning Activities=258,260,1
14. Maternal and Child Health Activities=258,260,2
15. Number of Licensed Food Premises by Business Type=260,262,2
16. Number of Licensed Sanitary by Business Type=262,264,2
17. The Nation Health Insurance Association & Beneficiary=264,266,1
18. Achievement of Diagnosis to Indermnify The Nation Health Insurance=264,266,2
19. National Pension Insurance=266,268,1
20. Veterans Relief Eligible of State Meritoriousness=266,268,2
21. Employment Veterans Relief Eligible=268,270,1
22. Enrollment of School Age Bereaved Children=268,270,2
23. Achievement of Occupation Pull out Blood=270,272,2
24. Recipients of National Basic Livelihood Security=272,274,2
25. Social Welfare Institutions and Inmates=274,276,2
26. Hall for the Aged Man=276,278,1
27. Welfare Institution for the Aged=277,279,1
28. Women Welfare Institutions=278,280,2
29. Counseled Activities for Women=280,282,1
30. Households Headed by Child=281,283,1
31. Day Care Centers for Children=282,284,1
32. Child Welfare Institution=282,284,2
33. Registered Disabled Persons=284,286,2
34. Welfare for the Disabled=286,288,1
35. Facilities for Homeless People Clien=286,288,2
36. Cemetery and Charnel House=288,290,2
XIII. Environment=290,292,1
1. Environmental Pollutant Emitting Facilities=290,292,2
2. Inspection and Administative Measures Environment Pollution Emitting Facilities=292,294,2
3. Waste Collection and Disponal=294,296,4
4. General Scrappy Landfill=298,300,2
5. Excretion Collection and Disposal=300,302,6
6. Sewage Disposal Plant and Operation=306,308,2
XIV. Education and Culture=308,310,1
1. Summary of Schools=308,310,2
2. Kindergartens=310,312,1
3. Elementary Schools=310,312,2
4. Middle Schools(National and Public)=312,314,1
5. Middle Schools(Private)=312,314,2
6. General High Schools(National and Public)=314,316,1
7. General High Schools(Private)=314,316,2
8. Vocational High Schools(National and Public)=316,318,1
9. Vocational High Schools(Private)=316,318,2
10. Junior Colleges=318,320,1
11. Colleges and Universities=318,320,2
12. Graduate Schools=320,322,1
13. Other Schools=320,322,2
14. Attendance Schools Age=322,324,1
15. Private Institute=322,324,2
16. Public Library=324,326,1
17. Museum=324,326,2
18. Cultural Property=326,328,2
19. Art Performing Organizations=328,330,1
20. Cultural Center=329,331,1
21. Public Sports Facilities=330,332,2
22. Youth Facilities=332,334,1
23. Mass Media=332,334,2
24. Registered Publishing and Printing Office=334,336,1
25. Publishing, Printing and Reproduction Recorded media Companies=334,336,2
XV. Public Finance=336,338,1
1. Collection National Taxes=336,338,1
2. Collection of Local Taxes=336,338,3
3. Summary of Budget and Setting=338,340,2
4. Budget Revenues of General Accounts=340,342,1
4-1. Settled Reveus of General Accounts=340,342,2
5. Budget Expenditure of General Accounts=342,344,1
5-1. Settled Expenditure of General Accounts=342,344,2
6. Settled Budget of Special Accounts=344,346,1
7. Settled Revenues of Special Accounts for Education=345,347,1
8. Settled Expenditure of Special Accounts for Education=345,347,1
9. Public Properties Commonly Owned by Si=346,348,2
XVI. Public Administration & Justice=348,350,1
1. Summary of Government Employees=348,350,2
2. Government Employees in Provincial Office=350,352,2
3. Government Employees Provimcial of Council and Affiliabed Agencies or Gu-Office=352,354,2
4. Government Employees of Eup, Myeon & Dong=354,356,2
5. Government Employees of Fire-fighting=356,358,1
6. Government Employees by Cause of Retirement=356,358,2
7. Government Employees Training by Cause=358,360,2
8. Number of Government & Public Office and Major Agencies=360,362,4
9. Handling of Civil Request Documents=364,366,1
1O. Passport Issue=364,366,2
11. Criminal Offense Occurred and Arrest=366,368,1
12. Suspected by Aged Group=366,368,2
13. Suspected by Education Background=368,370,1
14. Juvenile Delinquency=368,370,2
15. Criminal offenses by Foreigners=370,372,1
16. Fire Incidents=370,372,2
17. Fire Incidents by Causes=372,374,1
18. Fire Incidents by Place=372,374,1
19. Status of Forest Fire Incidences=372,374,2
20. Fire-fighting Equipment=374,376,2
21. First-aid and Rescue Activities of Fire Department=376,378,2
22. Facilities Subject to fire-fighting Regulation=378,380,1
23. Manufactory, Stores and Agencies of Dangerous Objects=378,380,2
24. Calamities and Damage=380,382,2
25. Traffic Regulation & Punishment of Violations=382,384,2
26. Traffic Accidents(Vehicle)=384,386,1
27. Number of Driver's License Holders=384,386,2
28. Drivers Test for Driver's License=386,388,3
XVII. NATIONAL STATISTICS=389,391,2
1. Major Economic Indications of ROK & DPRK=391,393,1
2. Summary of Administration Units=392,394,2
3. Population Trend=394,396,2
4. Population by 5-Year Age Group=396,398,2
5. Major Economis Indicators=398,400,8
6. Economically Active Population=406,408,3
7. Employed Persons by Industry=409,411,1
8. Employed Persons by Occupation=410,412,2
9. Indexes of Industrial Production, Shipment and Inventory by Province=412,414,2
10. Monthly Income and Expenditure per Household for Salary and Wage Earner's Household in All Cities=414,416,6
11. Monthly Expenditures per Household for All Households in All Cities=420,422,6
12. Producer Price Indexes=426,428,6
13. All Cities Consumer Price Indexes=432,434,6
14. Consolidated Central Government Statistics=438,440,4
15.Expenditure on Gross Domestic Product=442,444,2
16. Gross Domestic Product by Kind of Economic Activity and Gross National Income=444,446,2
17. Gross Regional Domestic Product=446,448,2
18. Summary of Exports and Imports=448,450,2
19. Exports by Principal Country=450,452,3
20. Imports by Principal Country=453,455,3
21. Number of Registered Motor Vehicles=456,458,3
XVIII. INTERNATIONAL STATISTICS=459,461,2
1. Population=461,463,2
2. Crude Live-Birth and Crude Death Rates=463,465,1
3. Unemployment Rate=464,466,1
4. Gross National Income (Current Prices)=465,467,1
5. Gross Domestic Production=466,468,2
6. Product Price Indexes=468,470,1
7. Consumer Price Indexes=469,471,1
8. Money Supply=470,472,2
9. External Trade=472,474,2
10. Economic Growth Rate (GDP)=474,476,1
11. Per Capita GNI (Current Prices)=475,477,1
12. Export and Import Unit Value Indexes=476,478,1
13. Balance of Payments (Current Account)=477,479,2
XIX. APPENDIX=479,481,2
1. Successive Major=481,483,2
2. Members of Province Parliament (City Election)=483,485,1
3. Members of City Council=483,485,3
4. Organization Table of City Council=486,488,1
5. 2002 Handling of Bills=486,488,1
6. Designated Cultural Assets=487,489,2
7. Major Indicators of Statistics=489,491,1
8. Grains Conversion Table=490,492,1
9. Conversion Table of Measurement=491,493,2
10. Administrative Phone Book of City=493,495,15
copyright=508,510,1
통계도표=9,11,1
1. 포항시민의 생활=10,12,1
2. 토지=11,13,1
3. 기후=12,14,1
4. 인구현황=13,15,1
5. 공무원 현황=14,16,1
6. 예산현황=15,17,1
7. 일반회계 결산액=16,18,1
8. 연도별 예산현황=17,19,1
9. 2002학년도 학생수=18,20,1
10. 급수현황=19,21,1
11. 전화가입 상황=20,22,1
12. 화재발생건수=21,23,1
13. 범죄발생 및 교통사고 현황=22,24,1
14. 자동차분포 현황=23,25,1
jpg
포항시의 상징=2,4,1
2. 토지=11,13,1
4. 인구현황=13,15,1
5. 공무원 현황=14,16,1
6. 예산현황=15,17,1
7. 일반회계 결산액=16,18,1
8. 연도별 예산현황=17,19,1
10. 급수현황=19,21,1
11. 전화가입 상황=20,22,1
12. 화재발생건수=21,23,1
13. 범죄발생 및 교통사고 현황=22,24,1
14. 자동차분포 현황=23,25,1
| 등록번호 | 청구기호 | 권별정보 | 자료실 | 이용여부 |
|---|---|---|---|---|
| 0000955451 | R 315.199 ㅍ372ㅍ | 2002 | 서울관 서고(열람신청 후 1층 대출대) | 이용가능 |
*표시는 필수 입력사항입니다.
| 전화번호 |
|---|
| 기사명 | 저자명 | 페이지 | 원문 | 기사목차 |
|---|
| 번호 | 발행일자 | 권호명 | 제본정보 | 자료실 | 원문 | 신청 페이지 |
|---|
도서위치안내: / 서가번호:

우편복사 목록담기를 완료하였습니다.
*표시는 필수 입력사항입니다.
저장 되었습니다.
