
 대표어

권호기사보기
| 기사명 | 저자명 | 페이지 | 원문 | 기사목차 |
|---|
결과 내 검색
동의어 포함
목차
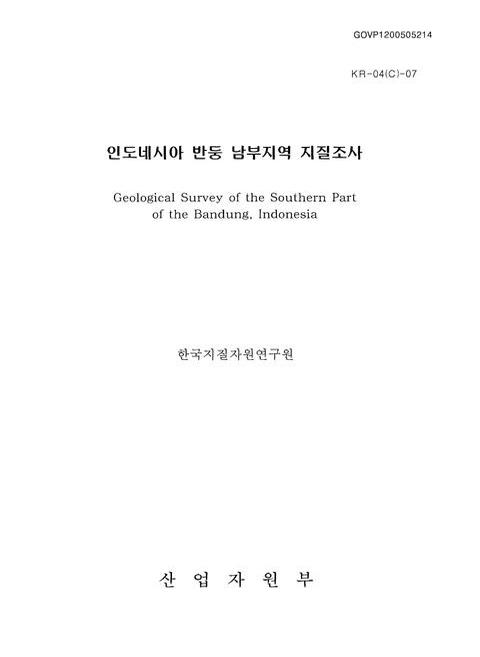
표제지=0,1,1
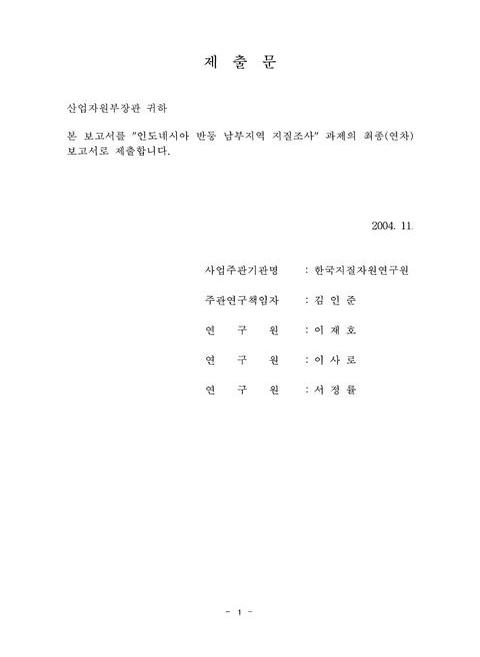
제출문=1,2,2
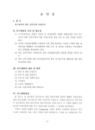
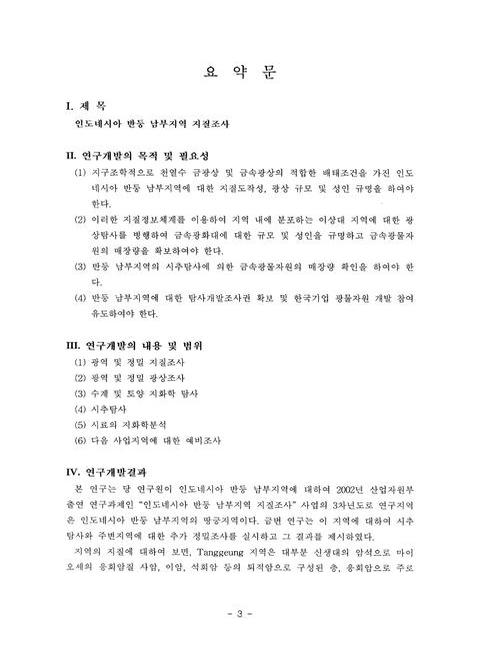
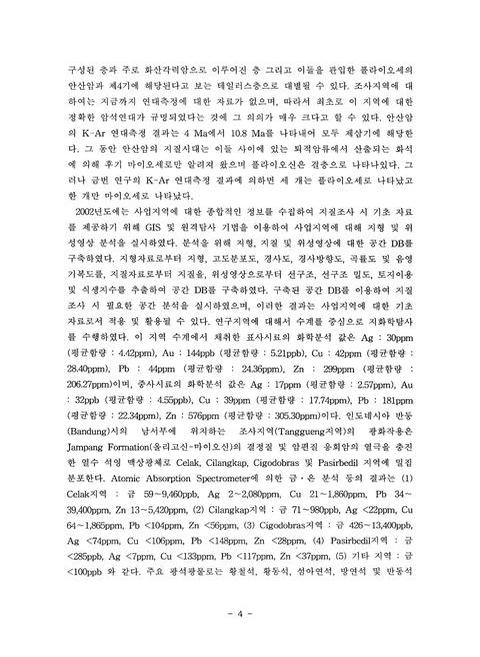
요약문=3,4,6
SUMMARY=9,10,6
CONTENTS=15,16,2
목차=17,18,1
List of Tables=18,19,4
List of Figures=22,23,7
제1장 서론=29,30,1
제1절 연구개발의 목적=29,30,1
제2절 연구개발의 범위=29,30,2
제2장 국내외 기술개발 현황=31,32,1
제3장 연구개발수행 내용 및 결과=32,33,1
제1절 서언=32,33,2
제2절 인도네시아 일반=33,34,5
제3절 지형 및 위성영상 분석=37,38,16
제4절 지질=53,54,33
제5절 응용 지질=85,86,22
제6절 수계지화학탐사=106,107,30
제7절 토양지화학탐사=136,137,14
제8절 광상=150,151,25
제9절 트렌치탐사=175,176,18
제10절 시추탐사=192,193,2
제11절 결론=193,194,5
제4장 연구개발목표 달성도 및 대외기여도=198,199,2
제5장 연구개발결과의 활용계획=200,201,1
제6장 참고문헌=201,202,5
영문목차
[title page etc.]=0,1,15
CONTENTS=15,16,14
Chapter 1. Introduction=29,30,1
Section 1 Objective and significance of the research=29,30,1
Section 2 Scope of the research=29,30,2
Chapter 2. Status of the research trend related to this study=31,32,1
Chapter 3. Result=32,33,1
Section 1 Introduction=32,33,2
Section 2 General Indonesia=33,34,5
Sectioa 3 Terrain and satellite image analyses=37,38,16
Section 4 Geology=53,54,33
Section 5 Applied geology=85,86,22
Section 6 Drainage geochemistry=106,107,30
Sectlon 7 Soil geochemstry=136,137,14
Section 8 Ore deposits=150,151,25
Section 9 Trench exploration=175,176,18
Section 10 Drilling exploration=192,193,2
Section 11 Conclusions=193,194,5
Chapter 4. Achievement of the goal and contribution to related research fields=198,199,2
Chapter 5. Utilization plane for the obtained results=200,201,1
Chapter 6. Refercences=201,202,5
Fig. 1-1. The location map of study area on southern part of the Bandung, Indonesia.=33,34,1
Fig. 3-1. Topography map.=43,44,1
Fig. 3-2. DEM map.=44,45,1
Fig. 3-3. Hillshade map.=45,46,1
Fig. 3-4. Slope map.=46,47,1
Fig. 3-5. Aspect map.=47,48,1
Fig. 3-6. Curvature map.=48,49,1
Fig. 3-7. Landsat TM satellite image band.=49,50,1
Fig. 3-8. Landsat TM Satellite image and lineament distribution.=50,51,1
Fig. 3-9. Lineament density distribution map.=51,52,1
Fig. 3-10. Rose diagram for lineament.=51,52,1
Fig. 3-11. Vegetation distribution map.=52,53,1
Fig. 4-1. Selected elements and boundaries of geologic terrains, mostly pre-Neogene of the Indonesian region (after Hamilton (1979)).=53,54,1
Fig. 4-2. Geological map of the project areaon southern part of the Bandung, Indonesia=57,58,1
그림 4-3. 사암층 내 분포하는 암상.=59,60,1
그림 4-4. No.66 지점에서 관찰되는 노출이 매우 양호한 사암층의 수직적인 주상도=61,62,1
그림 4-5. 사암층에 대한 현미경 관찰사진.=62,63,1
그림 4-6. 응회암층 내에 분포하는 여러 암상.=64,65,1
그림 4-7. No.15 지점에 위치한 래필리 응회암의 채석현장에서 측정된 절리의 분포그림.=65,66,1
그림 4-8. 응회암층에 대한 현미경 관찰사진.=67,68,1
그림 4-9. 화산각력암층과 안산암의 야외 분포사진.=68,69,1
그림 4-10. 화산각력암층과 안산암의 현미경사진.=69,70,1
그림 4-11. 조사지역내에서 골재이용 현황.=72,73,1
그림 4-12. 사암을 골재로 사용하기 위해 채석하는 산림골재 현장과 하천에서 골재를 채취하는 하천골재 채취현장.=73,74,1
그림 4-13. IUGS classification(LeBas et al., 1986) of intermediate volcanic rocks from the Tanggeung area, Indonesia.=78,79,1
Fig. 4-14. Silica versus total alkalies and silica versus FeO/(FeO+MgO) diagram for the andesites from the Tanggeung area, Indonesia.=79,80,1
Fig. 4-l5. Harker diagram of major elements of andesitic rocks in the Tanggeung area, Indonesia.=81,82,1
Fig. 4-16. Harker diagram of trace elements of andesitic rocks in the Tanggeung area, Indonesia.=82,83,1
Fig. 4-17. Chondrite-normalized rare earth element patterens for andesites in the Tanggeung area, Indonesia.=83,84,1
Fig. 5-1. Landslide occurrence locations with Landset TM satellite image in survey area on southern part of the Bandung, Indonesia.=86,87,1
Fig. 5-2. Field survey photos about landslide occurrence in survey area on southern part of the Bandung, Indonesia.=87,88,1
Fig. 5-3. Digital elevation map in domain A.=90,91,1
Fig. 5-4. Digital elevation map in domain B.=90,91,1
Fig. 5-5. 3D hillshade model in domain A.=91,92,1
Fig. 5-6. 3D hillshade model in domain B.=91,92,1
Fig. 5-7. Slope map in domain A.=93,94,1
Fig. 5-8. Slope map in domain B.=93,94,1
Fig. 5-9. Aspect map in domatn A.=95,96,1
Fig. 5-10. Aspect map in Domain B.=95,96,1
Fig. 5-11. Curvature map in domain A.=98,99,1
Fig. 5-12. Curvature map in domain B.=98,99,1
Fig. 5-13. Drain map in domain A.=100,101,1
Fig. 5-14. Drain map in domain B.=100,101,1
Fig. 5-15. Geology map in domain A.=102,103,1
Fig. 5-16. Geology map in domain B.=102,103,1
Fig. 5-17. NDVI map in domain A.=105,106,1
Fig. 5-18. NDVI map in domain B.=105,106,1
Fig. 6-1. Sampling sites of stream sediments from study area on southern part of the Bandung, Indonesia.=107,108,1
Fig. 6-2. Silver distribution map of fine sands from study area on southern part of the Bandung, Indonesia.=111,112,1
Fig. 6-3. Silver distribution map of heavy sands from study area on southern part of the Bandung, Indonesia.=111,112,1
Fig. 6-4. Gold distribution map of fine sands from study area southern part of the Bandung, Indonesia.=112,113,1
Fig. 6-5. Gold distribution map of heavy sands from study area southern part of the Bandung, Indonesia.=113,114,1
Fig. 6-6. Copper distribution map of fine sands from study area southern part of the Bandung, Indonesia.=115,116,1
Fig. 6-7. Copper distribution map of heavy sands from study area southern part of the Bandung, Indonesia.=115,116,1
Fig. 6-8. Lead distribution map of fine sands from study area on southern part of the Bandung, Indonesia.=117,118,1
Fig. 6-9. Lead distribution map of heavy sands from study area on southern part of the Bandung, Indonesia.=117,118,1
Fig. 6-10. Zinc distribution map of fine sands from study area on southern part of the Bandung, Indonesia.=119,120,1
Fig 6-11. Zinc distribution map of heavy sands from study area on southern part of the Bandung, Indonesia.=119,120,1
Fig. 6-12. Factor 1 distribution map of fine sands from study area on southern part of the Bandung, Indonesia.=130,131,1
Fig. 6-13. Factor 2 distribution map of fine sands from study area on southern part of the Bandung, Indonesia.=131,132,1
Fig. 6-14. Factor 3 distribution map of fine sands from study area on southern part of the Bandung, Indonesia.=131,132,1
Fig. 6-15. Factor 1 distribution map of heavy sands from study area on southern part of the Bandung, Indonesia.=132,133,1
Fig. 6-16. Factor 2 distribution map of heavy sands from study area on southern part of the Bandung, Indonesia.=133,134,1
Fig. 6-17. Anomalies of fine sands from study area on southern part of the Bandung, Indonesia.=135,136,1
Fig. 7-1. Sampling sites of soil samples from Mt. Subang area on southern part of Bandung, Indonesia.=136,137,1
Fig. 7-2. Detailed geological map of the Mt. Subang area on southern part of the Bandung, Indonesia.=137,138,1
Fig. 7-3. Silver distribution map of soil samples from the Mt. Subang area on Southern part of the Bandung, Indonesia.=139,140,1
Fig. 7-4. Gold distribution map of soil samples from the Mt. Subang area on Southern part of the Bandung, Indonesia.=140,141,1
Fig. 7-5. Copper distribution map of soil samples from the Mt. Subang area on Southern part of the Bandung, Indonesia.=142,143,1
Fig. 7-6. Lead distribution map of soil samples from the Mt. Subang area on Southern part of the Bandung, Indonesia.=143,144,1
Fig. 7-7. Zinc distribution map of soil samples from the Mt. Subang area on Southern part of the Bandung, Indonesia.=144,145,1
Fig. 7-8. Factor 1 distribution map of soil samples from the Mt. Subang area on Southern part of the Bandung, Indonesia.=147,148,1
Fig. 7-9. Factor 2 distribution map of soil samples from the Mt. Subang area on Southern part of the Bandung, Indonesia.=147,148,1
Fig. 7-10. Factor 3 distribution map of soil samples from the Mt. Subang area on Southern part of the Bandung, Indonesia.=148,149,1
Fig. 7-11. Anomalies of soils from study area on southern part of the Bandung, Indonesia.=149,150,1
Fig. 8-l. Metallic mineral deposits hosted by felslc-intermediate intrusive rocks, Indonesia.=151,152,1
Fig. 8-2. Metallic mineral deposits hosted by ultramafic rocks, Indonesia (after Sunarya and Bache (1987)).=152,153,1
Fig. 8-3. Metallic mineral deposits hosted by volcanic rocks, Indonesia (after Sunarya and Bache (1987)).=153,154,1
Fig. 8-4. Metallic mineral deposits hosted by sedimentary rocks, Indonesia (after Sunarya and Bache (1987)).=153,154,1
Fig. 8-5. Geological and sample locality map of the survey area on southern part of the Bandung, Indonesia.=159,160,1
Fig. 8-6. Generalized paragenetic sequence of vein minerals in quartz veins from the study area on southern part of the Bandung, Indonesia.=166,167,1
Fig. 8-7. Photomicrographs of ore minerals showing the paragenetic sequence.=167,168,1
Fig. 8-8. Photomicrographs showing mineralogical and fluid Inclusion textures in quartz.=168,169,1
Fig. 8-9. Histogram of homogenization temperatures of fluid inclusions in quartz from the study area on southem part of the Bandung, Indonesia.=169,170,1
Fig. 8-10. Homogenization temperature versus salinity of fluid inclusions in quartz from the study area on southern part of the Bandung, Indonesia.=170,171,1
Fig. 9-1. Map of the Mt. Subang area showing the geology, vein location and distribution of alteration zoning.=176,177,1
Fig. 9-2. The detailed location map of survey area (Celak and Cilangkap) on Southern part of the Bandung, Indonesia.=177,178,1
Fig. 9-3. Distribution map of quartz vein from the Celak area on southern part of the Bandung, Indonesia.=180,181,1
Fig. 9-4. Distribution map of trench from the Celak area on southern part of the Bandung, Indonesia.=181,182,1
Fig. 9-5. Distribution map of quartz vein and trench location from the Mt. Cilankap area on southern part of the Bandung, Indonesia.=182,183,1
Fig. 9-6. Trench location map (① In Fig. 5-5) of the Mt. Cilangkap area on Southern part of the Bandung, Indonesia.=183,184,1
Fig. 9-7. Trench distribution map of (A) from the Mt. Cilangkap area on southern part of the Bandung, Indonesia.=184,185,1
Fig. 9-8. Trench distribution map of (B) from the Mt. Cilangkap area on southern part of the Bandung, Indonesia.=185,186,1
Fig. 9-9. Trench distribution map of (C) and quartz vein (D) from the Mt. Cilangkap area on southern part of the Bandung, Indonesia.=186,187,1
Fig. 9-10. Photomicrographs showing outcrop of altered rocks and quartz vein from the top of Mt. Cilangkap on southern part of the Bandung, Indonesia.=187,188,1
Fig. 9-11. The promising area from study area on southern part of the Bandung, Indonesia.=191,192,1
Fig. 10-1. Map of the quartz vein showing the position of completed and planed diamond drill holes in the Mt. Cilangkap area, Indonesia.=192,193,1
jpg
Fig. 3-1. Topography map.=43,44,1
Fig. 3-2. DEM map.=44,45,1
Fig. 3-4. Slope map.=46,47,1
Fig. 3-5. Aspect map.=47,48,1
Fig. 3-6. Curvature map.=48,49,1
Fig. 3-7. Landsat TM satellite image.=49,50,1
Fig. 3-8. Landsat TM Satellite image and lineament distribution.=50,51,1
Fig. 3-9. Lineament density distribution map.=51,52,1
Fig. 3-11. Vegetation distribution map.=52,53,1
Fig. 4-2. Geological map of the project areaon southern part of the Bandung, Indonesia.=57,58,1
그림 4-3. 사암층 내 분포하는 암상.=59,60,1
그림 4-5. 사암층에 대한 현미경 관찰사진.=62,63,1
그림 4-6. 응회암층 내에 분포하는 여러 암상.=64,65,1
그림 4-8. 응회암층에 대한 현미경 관찰사진.=67,68,1
그림 4-9. 화산각력암층과 안산암의 야외 분포사진.=68,69,1
그림 4-10. 화산각력암층과 안산암의 현미경사진.=69,70,1
그림 4-11. 조사지역내에서 골재이용 현황.=72,73,1
그림 4-12. 사암을 골재로 사용하기 위해 채석하는 산림골재 현장과 하천에서 골재를 채취하는 하천골재 채취현장.=73,74,1
Fig 5-1. Landslide occurrence locations with Landset TM satellite image in survey area on southern part of the Bandung, Indonesia=86,87,1
Fig 5-2. Field survey photos about landslide occurrence in survey area on southern part of the Bandung, Indonesia=87,88,1
Fig 5-3. Digital elevation map in domain A=90,91,1
Fig 5-7. Slope map in domain A=93,94,1
Fig 5-9. Aspect map in domain A=95,96,1
Fig 5-11. Curvature map in domain A=98,99,1
Fig 5-13. Drain map in domain A=100,101,1
Fig 5-15. Geology map in domain A=102,103,1
Fig 5-17. NDVI map in domain A=105,106,1
Fig 6-1. Sampling sites of stream sediments from study area on southern part of the Bandung, Indonesia=107,108,1
Fig 6-17. Anomalies of fine sands from study area on southern part of the Bandung, Indonesia=135,136,1
Fig 7-2. Detailed geological map of the Mt. Subang area on southern part of the Bandung, Indonesia=137,138,1
Fig 7-3. Silver distribution map of soil samples from the Mt. Subang area on Southern part of the Bandung, Indonesia=139,140,1
Fig 7-4. Gold distribution map of soil samples from the Mt. Subang area on southern part of the Bandung, Indonesia=140,141,1
Fig 7-5. Copper distribution map of soil samples from the Mt. Subang area on southern part of the Bandung, Indonesia=142,143,1
Fig 7-6. Lead distribution map of soil samples from the Mt. Subang area on southern part of the Bandung, Indonesia=143,144,1
Fig 7-7. Zinc distribution map of soil samples from the Mt. Subang area on southern part of the Bandung, Indonesia=144,145,1
Fig 7-8. Factor 1 distribution map of soil samples from the Mt. Subang area on southern part of the Bandung, Indonesia=147,148,1
Fig 7-10. Factor 3 distribution map of soil samples from the Mt. Subang area on southern part of the Bandung, Indonesia=148,149,1
Fig 7-11. Anomalies of soils from study area on southern part of the Bandung, Indonesia=149,150,1
Fig 8-5. Geological and sample locality map of the survey area on southern part of the Bandung, Indonesia=159,160,1
Fig 8-7. Photomicrographs of ore minerals showing the paragenetic sequence. (A) Disseminated euhedral pyrite(PY) in matrix of quartz. (B) Sphalerite(SP) exsolved with chalcopyrite(CP) is intergrown with Pyrite. (C) Early Pyrite grains replaced and cemented by chalcopyrite, and supergene covellite(CV). (D) Chalcopyrite coexisting with bornite(BN) and galena(GN). (E) Chalcopyrite is intergrown with galena. Bar scale equals 0.1mm=167,168,1
Fig 8-8. Photomicrographs showing mineralogical and fluid Inclusion textures in quartz. (A) Colloform texture quartz showing growth zone defined dark band. (B) Euhedral quartz crystal showing growth zone defined dark band. (C) Comb texture quartz with primary fluid inclusions. (D) Enlargement of portion of (B) showing variable liquid to vapor rations. Bar scale equals 0.1mm=168,169,1
Fig 9-2. The detailed location map of survey area (Celak and Cilangkap) on southern part of the Bandung, Indonesia=177,178,1
Fig 9-3. Distribution map of quartz vein from the Celak area on southern part of the Bandung, Indonesia=180,181,1
Fig 9-4. Distribution map of trench from the Celak area on southern part of the Bandung, Indonesia=181,182,1
Fig 9-5. Distribution map of quartz vein and trench location from the Mt. Cilankap area on southern part of the Bandung, Indonesia=182,183,1
Fig 9-6. Trench location map (① of Fig. 5-5) of the Mt. Cilangkap area on southern part of the Bandung, Indonesia=183,184,1
Fig 9-7. Trench distribution map of (A) from the Mt. Cilangkap area on southern part of the Bandung, Indonesia=184,185,1
Fig 9-8. Trench distribution map of (B) from the Mt. Cilangkap area on southern part of the Bandung, Indonesia=185,186,1
Fig 9-9. Trench distribution map of (C) and quartz vein (D) from the Mt. Cilangkap area on southern part of the Bandung, Indonesia=186,187,1
Fig 9-10. Photomicrographs showing outcrop of altered rocks and quartz vein from the top of Mt. Cilangkap on southern part of the Bandung, Indonesia=187,188,1
Fig 9-11. The promising area from study area on southern part of the Bandung, Indonesia=191,192,1
Fig 10-1. Map of the quartz vein showing the position of completed and planed diamond drill holes in the Mt. Cilangkap area, Indonesia=192,193,1
*표시는 필수 입력사항입니다.
| 전화번호 |
|---|
| 기사명 | 저자명 | 페이지 | 원문 | 기사목차 |
|---|
| 번호 | 발행일자 | 권호명 | 제본정보 | 자료실 | 원문 | 신청 페이지 |
|---|
도서위치안내: / 서가번호:

우편복사 목록담기를 완료하였습니다.
*표시는 필수 입력사항입니다.
저장 되었습니다.
