
 대표어
대표어
권호기사보기
| 기사명 | 저자명 | 페이지 | 원문 | 기사목차 |
|---|
결과 내 검색
동의어 포함
목차
표제지=0,1,1
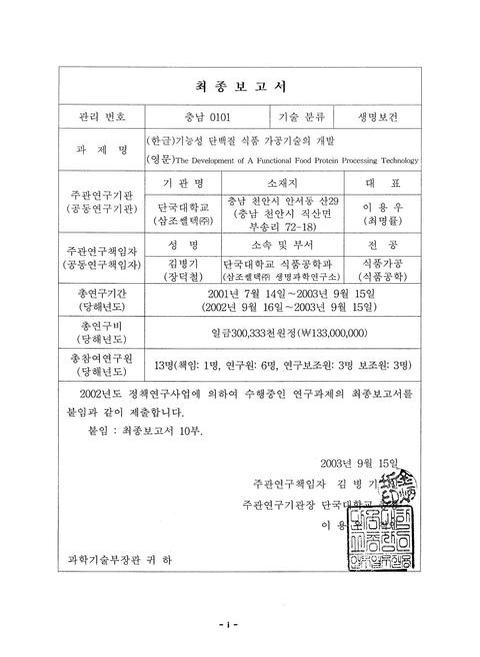
최종보고서/김병기=i,2,2
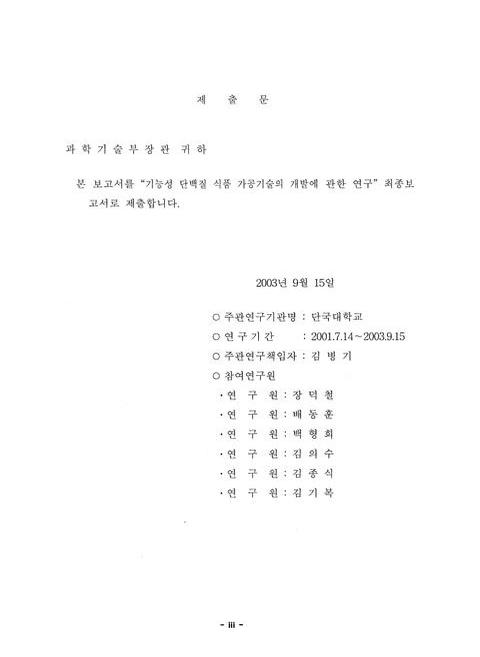
제출문=iii,4,1
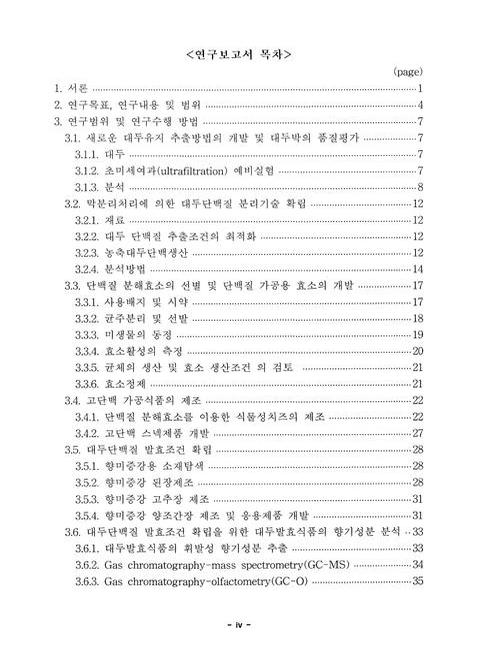
연구보고서 목차=iv,5,3
표 목차=vii,8,3
그림목차=x,11,5
요약문=xv,16,9
SUMMARY=xxiv,25,8
1. 서론=1,33,3
2. 연구목표, 연구내용 및 범위=4,36,3
3. 연구범위 및 연구수행 방법=7,39,1
3.1. 새로운 대두유지 추출방법의 개발 및 대두박의 품질평가=7,39,1
3.1.1. 대두=7,39,1
3.1.2. 초미세여과(ultrafiltration) 예비실험=7,39,2
3.1.3. 분석=8,40,4
3.2. 막분리처리에 의한 대두단백질 분리기술 확립=12,44,1
3.2.1. 재료=12,44,1
3.2.2. 대두 단백질 추출조건의 최적화=12,44,1
3.2.3. 농축대두단백 생산=12,44,3
3.2.4. 분석방법=14,46,4
3.3. 단백질 분해효소의 선별 및 단백질 가공용 효소의 개발=17,49,1
3.3.1. 사용배지 및 시약=17,49,2
3.3.2. 균주분리 및 선발=18,50,2
3.3.3. 미생물의 동정=19,51,2
3.3.4. 효소활성의 측정=20,52,2
3.3.5. 균체의 생산 및 효소 생산조건의 검토=21,53,1
3.3.6. 효소정제=21,53,2
3.4. 고단백 가공식품의 제조=22,54,1
3.4.1. 단백질 분해효소를 이용한 식물성치즈의 제조=22,54,6
3.4.2. 고단백 스넥제품 개발=27,59,1
3.5. 대두단백질 발효조건 확립=28,60,1
3.5.1. 향미증강용 소재탐색=28,60,1
3.5.2. 향미증강 된장제조=28,60,3
3.5.3. 향미증강 고추장 제조=31,63,1
3.5.4. 향미증강 양조간장 제조 및 응용제품 개발=31,63,3
3.6. 대두단백질 발효조건 확립을 위한 대두발효식품의 향기성분 분석=33,65,1
3.6.1. 대두발효식품의 휘발성 향기성분 추출=33,65,2
3.6.2. Gas chromatography-mass spectrometry(GC-MS)=34,66,2
3.6.3. Gas chromatography-olfactometry(GC-O)=35,67,1
3.6.4. Aroma Extraction Dilution Analysis(AEDA)=35,67,1
3.6.5. 향기성분의 동정=35,67,2
3.7. 향미증강 양조간장의 향기성분 분석=36,68,1
3.7.1. 재료=36,68,1
3.7.2. 용매추출법(direct solvent extraction)=36,68,1
3.7.3. Gas chromatography-mass spectrometry-olfactometry=37,69,1
3.7.4. 휘발성 향기성분의 동정=37,69,1
3.7.5. Model solution의 solid phase microextraction(SPME)=37,69,2
3.7.6. 향미증강 양조간장의 SPME-GC-O=38,70,4
4. 연구수행 내용 및 결과=42,74,1
4.1. 새로운 대두성분 추출방법의 개발 및 대두박의 품질 평가=42,74,1
4.1.1. 추출공정 디자인 및 최적화=42,74,1
4.1.2. 원료 및 제품분석=42,74,2
4.1.3. AEP 추출성분의 분리=43,75,3
4.2. 막분리기술에 의한 대두단백질 분리기술 확립=46,78,1
4.2.1. 농축대두단백의 일반성분=46,78,3
4.2.2. 단백질추출조건의 최적화=49,81,3
4.2.3. 농축대두단백 생산=52,84,2
4.2.4. 농축대두단백의 기능성(functional properties)=53,85,8
4.2.5. 농축대두단백의 이화학적 특성=60,92,13
4.3. 단백질 분해효소의 선별 및 단백질가공용 효소의 개발=73,105,1
4.3.1. Bacillus sp. 218이 생산하는 내열성 단백질분해효소=73,105,13
4.3.2. Bacillus sp. JE 375가 생산하는 단백질분해효소=85,117,39
4.3.3. Bacillus sp. DK1122가 생산하는 호알카리성 단백질 분해효소=123,155,8
4.3.4. 결론=130,162,6
4.4. 고단백 가공식품의 제조=136,168,1
4.4.1. 단백질분해효소를 이용한 식물성치즈의 개발=136,168,6
4.4.2. 고단백 스넥제품 개발=141,173,16
4.5. 대두단백질 발효조건 확립=157,189,1
4.5.1. 항미향상 소재탐색=157,189,1
4.5.2. 향미증강 된장제조=157,189,16
4.5.3. 향미증강 소스베이스용 간장개발=172,204,4
4.5.4. 연구성과=175,207,8
4.6. 대두단백질 발효조건 확립을 위한 대두발효식품 향기성분분석=183,215,1
4.6.1. 간장=183,215,2
4.6.2. 고추장=184,216,14
4.6.3. 된장=197,229,2
4.6.4. 청국장=198,230,2
4.6.5. 향미증강 양조간장 향기성분 분석=199,231,12
참고문헌=211,243,11
Figure 1. Flow diagram showing extraction processing of soybean to produce soy protein concentrate by ultrafiltration membrane treatment=9,41,1
Figure 2. System schematic for the membrane concentration of soy proteins=10,42,1
Figure 3. Flow diagram showing extraction processing of soybean to produce soy protein concentrate by acid precipitation procedures=11,43,1
Figure 4. A flow diagram showing extraction processing of soybean to produce protein isolate and oil using ultrafiltration membranes=39,71,1
Figure 5. Extractable soybean solids at various particle sizes and solid-to-water ratios at pH 7=47,79,1
Figure 6. Nitrogen solubilities of protein samples obtained by membrane filtration at pH 7.0 and acid precipitation procedures=50,82,1
Figure 7. Heat coagulation properties of protein samples obtained by membrane filtration at pH 7.0 and acid precipitation procedures=51,83,1
Figure 8. Emulsion capacities of protein samples obtained by membrane filtration at pH 7.0 and acid precipitation procedures=55,87,1
Figure 9. Emulsion stabilities of protein samples obtained at pH 7.0 by membrane filtration and acid precipitation procedures=56,88,1
Figure 10. Foaming capacities of protein samples obtained by membrane filtration at pH 7.0 and acid precipitation procedures=58,90,1
Figure 11. Foaming stabilities of protein samples obtained by membrane filtration at pH 7.0 and acid precipitation procedures=59,91,1
Figure 12. Sodium Dodecyl Sulfate polyacrylamide gel electrophoretic patterns of protein samples=62,94,1
Figure 13. Formation of digestion clear zone in the LB media containing 2% casein powder=67,99,1
Figure 14. Scanning electron micrograph of the strain DF 218=68,100,1
Figure 15.165 rDNA sequence of strain DF 218(1,602bases)=71,103,1
Figure 16. Dendrogram of the Bacillus sp. DF 218 through 165 rDNA gene sertuence aomology=72,104,1
Figure 17. Effect of culture temp on the growth of Bacillus sp. DF 218=74,106,1
Figure 18. Effect of culture time on the growth and protease production from Bacillus sp. DF 218=75,107,1
Figure 19. Effect of initial pH of medium on the growth and production of the protease from Bacillus sp. DF 218=76,108,1
Figure 20. DEAE-sepharose column chromatogram of protease from Bacillus sp. DF 218=77,109,1
Figure 21. SDS-PAGE of the protease from Bacillus sp. DF 218=78,110,1
Figure 22. Effect of initial pH on the protease production from Bacillus SP. Df 218=82,114,1
Figure 23. Effect of temp on the protease production from Bacillus sp. DF 218=83,115,1
Figure 24. Scanning electron micrograph of the strain JE 375=84,116,1
Figure 25. Formation of digestion clear zone on the LB media containing 2% skim milk=86,118,1
Figure 26. Whole cell fatty acid composition of strain JE 375 by gas chromatography=89,121,1
Figure 27. 165 rDNA sequence of strain JE 375(1,846 base)=90,122,1
Figure 28. Dendrogram of the Bacillus sp. JE 375 through 16S rDNA gene sequence homology=91,123,1
Figure 29. Comparison of 16S rDNA sequence among strain JE 375. B. caldoxylolyticus and B. thermoglucosidasius=92,124,1
Figure 30. Effect of culture temp on the growth and enzyme production of Bacillus sp. JE 375=96,128,1
Figure 31. Effect of culture time on the growth and enzyme production of doenjang sp.JE 375=97,129,1
Figure 32. Effect of initial pH of medium on the growth and enzyme production of Bacillus sp. JE 375=98,130,1
Figure 33. The growth and enzyme production of Bacillus sp. JE 375 depending on carbon sources(%)=99,131,1
Figure 34. The growth and enzyme production from nitrogen sources(1%. w/v) by Bacillus sp. JE 375=100,132,1
Figure 35. Profiles of cell growth, pH, protein concentration and production of the enzyme of Bacillus sp. JE 375=102,134,1
Figure 35. Chromatogram of the protease on DSAE-sepharose column=104,136,1
Figure 37. SDS-PAGE of protease from Bacillus sp. JE 375=105,137,1
Figure 38. Effect of initial pH on the enzyme production from Bacillus sp. JE 375=112,144,1
Figure 39. Effect of temperatue on the enzyme production from Bacillus sp. JE 375=113,145,1
Figure 40. Effect of inorganic salts on the enzyme production from Bacillus sp. JE 375=114,146,1
Figure 41. Effect of concentration of Cac12 on the enzyme activity of Bacillus sp. JE 375=115,147,1
Figure 42. Effect of amino acid modifying reagents and detergents on enzyme activity from Bacillus sp. JE 375=117,149,1
Figure 43. Effect of concentration of cystein and iodoacetamide on the enzyme activity from Bacillus sp. JE 375=118,150,1
Figure 44. pH stability for enzyme activity from fociffur sp. JE 375=120,152,1
Figure 45. Dendrogram of the Bacillus sp. Dkl122 through 165 rBNA gene sequence homology=122,154,1
Figure 46. Effect of culture temp on the growth and enzyme activity of Bacillus sp. DK1122=124,156,1
Figure 47. Effect of culture pH of medium on the growth and enzyme activity of Bacillus sp. BK1122=125,157,1
Figure 48. Effect of culture NaCl cone.(C) on the growth and enzyme activity of Bacillus sp. DK1122=126,158,1
Figure 49. Chromatogram of Iytic enzyme from DK1122 on CM-agarose column=127,159,1
Figure 50. SDS-PAGE of Iytic enzyme from DK1122=128,160,1
Figure 51. Changes in bulk density of wheat-snack products as affected by the added tuna meat=143,175,1
Figure 52. Changes in brittleness of wheat-snack products as affected by the added tuna meat=144,176,1
Figure 53. Changes in hardness of wheat-snack products as affected by the added tuna meat=145,177,1
Figure 54. Changes in Hunter colorimetric "L" values of wheat-snack products as affected by the added tuna meat=147,179,1
Figure 55. Changes in Hunter colorimetric "a" values of wheat-snack products as affected by the added tuna meat=148,180,1
Figure 56. Changes in Hunter colorimetric "b" values of wheat-snack products as affected by the added tuna meat=149,181,1
Figure 57. Slectron micrographs of extruded wheat-snack products with(upper) and without(lower) added tuna meat=150,182,1
Figure 58. Total ion chromatogram of volatile flavor compounds isolated from soy sauce=176,208,1
Figure 59. Flavor dilution chromatogram of soy sauce extracted by vacuum SDE=179,211,1
Figure 60. Total ion chromatogram of volatile flavor compounds of kochujang=180,212,1
Figure 61. Total ion chromatogram of volatile flavor compounds of deonjang=187,219,1
Figure 62. Total ion chromatogram of volatile flavor compounds of chungkookjang=190,222,1
Figure 63. Comparison of peak area ratio of 2-ethyl-4-hydroxy-5-methyl-3(2H)-furanone(HEMF) from flavor-enhanced soy sauces=196,228,1
Figure 64. GC response for each standard with different concentration (ppm) by PDMS fiber=203,235,1
Figure 65. Flavor dilution chromatogram of volatiles isolated from commercial soy sauce by SPME-GC-O=204,236,1
Figure 66. Flavor dilution chromatogram of volatiles isolated from cinnamon flavor-enriched soy sauce by SPME-GC-O=205,237,1
Figure 67. Flavor dilution chromatogram of volatiles isolated from rosemary flavor-enriched soy sauce by SPME-GC-O=206,238,1
Figure 68. Flavor dilution chromatogram of volatiles isolated from thyme flavor-enriched soy sauce by SPME-GC-O=207,239,1
Figure 69. Flavor dilution chromatogram of volatiles isolated from clove flavor-enriched soy sauce by SPME-GC-O=208,240,1
*표시는 필수 입력사항입니다.
| 전화번호 |
|---|
| 기사명 | 저자명 | 페이지 | 원문 | 기사목차 |
|---|
| 번호 | 발행일자 | 권호명 | 제본정보 | 자료실 | 원문 | 신청 페이지 |
|---|
도서위치안내: / 서가번호:

우편복사 목록담기를 완료하였습니다.
*표시는 필수 입력사항입니다.
저장 되었습니다.
