
 대표어
권호기사보기
| 기사명 | 저자명 | 페이지 | 원문 | 기사목차 |
|---|
결과 내 검색
동의어 포함
목차
표제지=0,1,1
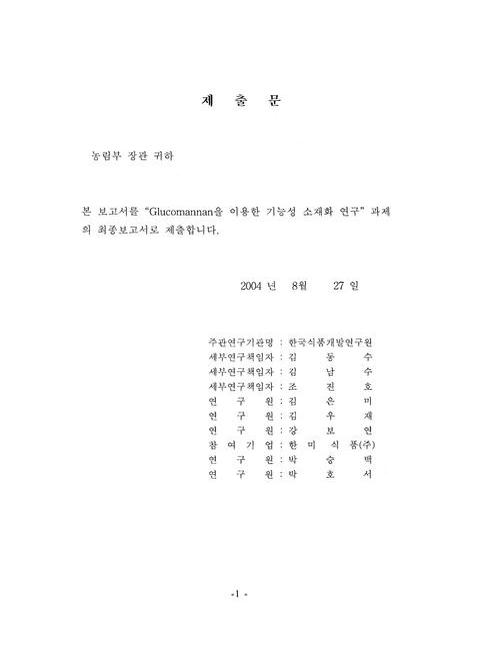
제출문=1,2,2
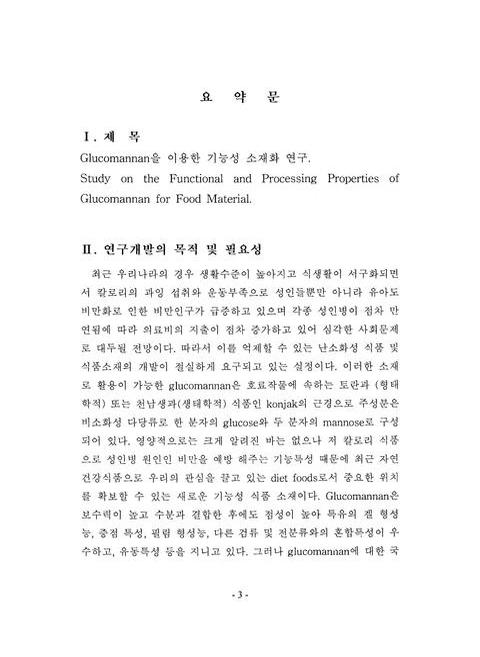
요약문=3,4,6
SUMMARY=9,10,6
CONTENTS=15,16,2
목차=17,18,2
List of figures=19,20,2
List of tables=21,22,2
제1장. 연구개발과제의 개요=23,24,1
제1절. 서론=23,24,3
제2장. 국내외 기술개발 현황=26,27,4
제3장. 연구개발 수행내용=30,31,1
제1절 연구개발 수행내용=30,31,1
1. Glucomannan 물성 특성 및 개선 시험=30,31,1
2. 어묵 가공시험 및 제품특성 조사=30,31,1
가. 어묵 가공시험=30,31,2
나. 어묵의 조직학적 특성=32,33,1
다. Scanning Electron Microsope(SEM) 촬영=32,33,1
3. 조미가공제품 개발시험=32,33,2
4. 음료제품 개발 시험=33,34,2
5. Glucomannan의 성분 및 기능성 분석=34,35,1
가. Glucomannan의 가수분해=34,35,1
나. Angiotensin- I 전환효소의 저해활성=35,36,1
다. 항산화 활성=35,36,1
라. 항혈액 응고(Activated partial thromboplastin time:APTT)=35,36,2
마. 암세포 증식 억제 효과(MTT-assay)=36,37,1
바. Bile acid 결합력 측정(Camire, 1993)=37,38,2
6. Glucomannan 제품의 저장성=39,40,2
제2절. 연구결과=41,42,1
1. Glucomannan의 물성 특성조사=41,42,15
2. 어묵 가공시험 및 조직 특성 조사=56,57,12
3. 조미가공제품 개발시험=68,69,12
4. Glucomannan을 이용한 음료 제품=80,81,7
5. Glucomannan의 기능성=87,88,1
가. Glucomannan의 분자량별 분획=87,88,2
나. Glucomannan 분자량별 획분의 기능성=89,90,1
1) Glucomannan 분해물의 분자량별 기능 활성=89,90,7
2) Glucomannan의 bile acid 결합능=95,96,7
6. 개발 제품의 위생적 안전성=102,103,1
가. 어묵 제품=102,103,7
나. 조미 건조제품=109,110,6
다. 음료제품의 품질특성 및 제품 안전성=115,116,5
7. Glucomannan 제품의 공정 확립 및 경제성 분석=120,121,10
제4장. 요약=130,131,5
제5장 참고문헌=135,136,47
영문목차
[title page etc.]=0,1,9
SUMMARY=9,10,6
CONTENTS=15,16,8
I. Introduction=23,24,3
II. Review on the current status=26,27,4
III. Research and result=30,31,1
Section 1. Contents of research=30,31,1
1. Reological properties and development of Glucomannan=30,31,1
2. Processing and characteristic of fishmeat Paste product=30,31,1
1) Processing of fishmeat paste product=30,31,2
2) Organic characteristic of fishmeat paste product=32,33,1
3) Scanning Electron Microsope(SEM)=32,33,1
3. Development of dried product=32,33,2
4. Development of beverage product=33,34,2
5. Functionality and component of glucomannan=34,35,1
1) Hydrolysis of Glucomannan=34,35,1
2) Angiotensin- I inhibitory activity=35,36,1
3) Antioxidant effect=35,36,1
4) APTT test=35,36,2
5) MTT-assay=36,37,1
6) Bile acid boinding capacity=37,38,2
6. Preservation of glucomannan product=39,40,2
Section 2. Result=41,42,1
1. Reological characteristic of glucomannan=41,42,15
2. Processing and organization of fishmeat paste Product=56,57,12
3. Development of dried product=68,69,12
4 Development of beverage Product=80,81,7
5. Functional of glucomannan=87,88,1
1) Separated Fraction of glucomannan=87,88,2
2) Functional of glucomannan=89,90,1
① functional of separated fraction=89,90,7
② Bile acid boinding capacity=95,96,7
6. Investigation sanitation safety of roduct=102,103,1
1) Preservation of fishmeat paste=102,103,7
2) Preservation of dried product=109,110,6
3) Preservation of beverage Product=115,116,5
7. Analysis of economical efficiency=120,121,10
IV. Result and discussion=130,131,5
V. Reference=135,136,47
Fig. 1. Processing procedure of fishmeat paste product=31,32,1
Fig. 2. Standard curve for derermination of bile acids contents=38,39,1
Fig. 3. Shear stress vs. shear rate plot of glucomannan=42,43,1
Fig. 4. Shear stress vs. shear rate plot of Konjac=42,43,1
Fig. 5. Shear stress vs. shear rate plot of glucomannan soln(0.6%)=44,45,1
Fig. 6. Shear stress vs. shear rate plot of konjac soln(0.6%)=44,45,1
Fig. 7. Shear stress vs. shear rate plot of glucomannan soln(0.6%)=46,47,1
Fig. 8. Shear stress vs. shear rate plot of konojac soln(0.6%)=46,47,1
Fig. 9. Shear stress vs. shear rate plot of glucomannan soln(0.6%) during 5℃=47,48,1
Fig. 10. Shear stress vs. shear rate of glucomannan soln(0.6%) different(diferent) with pH after storage (24hr) at -20℃.=50,51,1
Fig. 11. Shear stress vs. shear rate of konjac soln(0.6%) different(diferent) with pH after storage (24hr) at -20℃.=51,52,1
Fig. 12. Shear stress vs. shear rate of glucomannan soln(0.1%) by autoclaving.=52,53,1
Fig. 13. Shear stress vs. shear rate plot of Konjac solution by autoclaving.=53,54,1
Fig. 14-1. Changes in texture characteristics of fishmeat paste mixed with glucomannan and konjac, amount of water.=59,60,1
Fig. 14-2. Changes in texture characteristics of fishmeat paste mixed with glucomannan and konjac, amount of water.=60,61,1
Fig. 15. Comparision of fish meat pastes as affected by the amounts of water and glucomannan added=62,63,1
Fig. 16. Scanning eletron micrograph of product A(magnification, 500×=64,65,1
Fig. 17. Scanning eletron micrograph of product B(magnification, 500×)=65,66,1
Fig. 18. Scanning eletron micrograph of product C(magnification, 500×)=66,67,1
Fig. 19. Scanning eletron micrograph of product D(magnification, 500×)=67,68,1
Fig. 20. Glucomannan을 이용한 조미 건조제품 가공 공정=68,69,1
Fig. 21. Image change of seasoning konjac different with drying conditions.(Left:70℃, 1-5hr, Right(Light):90℃,1-5hr)=77,78,1
Fig. 22-1. Picture of seasoned and dried glucomannan products.=78,79,1
Fig. 22-2. Picture of seasoned and dried glucomannan product.=79,80,1
Fig. 23. Procedure of beverage product using hydrolysated glucomannan.=81,82,1
Fig. 24. Picture of glucomannan beverage (A:Grape and B:Strawberry)=86,87,1
Fig. 25. Antioxidant effect of hydrolysated glucomannan fraction different concentration.(A:Glucomanan fraction different concentration. (A:Glucomanan fraction different concentration. (A:Glucomannan, B:Total hydrolysated, C:>100,000, D:10,000<<100,000=90,91,1
Fig. 26. Anticancer activity of hydrolysated glucomannan fraction different concentration(A:Glucomanan fraction different concentration. (A:Glucomannan, B:Total hydrolysated, C:>100,000, D:10,000<<100,000, E:3,000<<100,000, F:<3,000)=91,92,1
Fig. 27. ACE inhibitory activity of hydrolysated glucomannan fraction different concentration.(A:Glucomanan fraction different concentration. (A:Glucomannan, B:Total hydrolysated, C:>100,000, D:10,000<<100,000, E:3,000<<100,000, F:<3,000)=93,94,1
Fig. 28. APTT test of hydrolysated glucomannan fraction different concentration(A:Glucomanan fraction different concentration. (A:Glucomannan, B:Total hydrolysated, C:>100,000, D:10,000<<100,000, E:3,000<<100,000, F:<3,000)=94,95,1
Fig. 29. Cholic acid binding capacity of solution with various concentration of crude glucomannan hydrolysate(A:Glucomannan, B:Total hydrolysated;GH, C:GH>100,000, D:10,000<GH<100,000, E:3,000<GH<10,000, F:GH<3,000)=96,97,1
Fig. 30. Deoxycholic acid binding capacity of solution with various concentration of crude glucomannan hydrolysate(A:Glucomanan fraction different concentration.(A:Glucomannan, B:Total hydrolysated;GH, C:GH>100,000, D:10,000<GH<100,000, E:3,000<GH<10,000, F:GH<3,000)=97,98,1
Fig. 31. Taurocholic acid binding capacity of solution with various concentration of crude glucomannan hydrolysate(A:Glucomannan, B:Total hydrolysated;GH, C:GH>100,000, D:10,000<GH<100,000, E:3,000<GH<10,000, F:GH<3,000)=98,99,1
Fig. 32. Glycocholic acid binding capacity of solution with various concentration of crude glucomannan hydrolysate(A:Glucomannan, B:Total hydrolysated;GH, C:GH>100,000, D:10,000<GH<100,000, E:3,000<GH<10,000, F:GH<3,000)=99,100,1
Fig. 33. Change in pH of fish meat paste products mixed with glucomannan during storage periods=106,107,1
Fig. 34. Change in VBN of fish meat paste products mixed with glucomannan during storage periods=107,108,1
Fig. 35. Change in pH of dried glucomannan for storage periods.(A:Bulgogi taste, B:Chungyang pepper taste)=111,112,1
Fig. 36. Change in pH of glucomannan beverage for storage period(A:Grape, B:Strawberry)=117,118,1
Fig. 37. 어묵 제품의 제조공정=120,121,1
Fig. 38. 조미제품의 제조공정=123,124,1
Fig. 39. 음료제품의 제조공정=127,128,1
*표시는 필수 입력사항입니다.
| 전화번호 |
|---|
| 기사명 | 저자명 | 페이지 | 원문 | 기사목차 |
|---|
| 번호 | 발행일자 | 권호명 | 제본정보 | 자료실 | 원문 | 신청 페이지 |
|---|
도서위치안내: / 서가번호:

우편복사 목록담기를 완료하였습니다.
*표시는 필수 입력사항입니다.
저장 되었습니다.
