

 대표어
권호기사보기
| 기사명 | 저자명 | 페이지 | 원문 | 기사목차 |
|---|
결과 내 검색
동의어 포함
목차
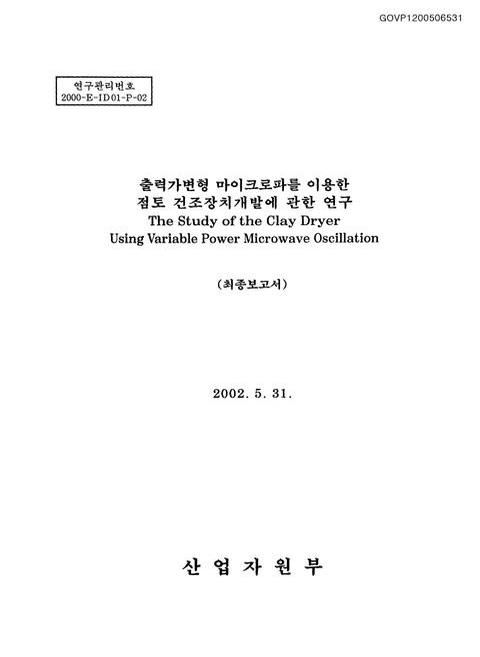
표제지=0,1,1
제출문=0,2,1
요약문=0,3,4
목차=0,7,2
Nomenclature=0,9,1
List of Tables=0,10,1
List of Figures=0,10,4
제1장 서론=1,14,1
1.1 기술의 개요 및 개발 필요성=1,14,2
1.2 기술 개발 목표=2,15,3
1.3 주요 연구 내용=4,17,1
제2장 발진장치 부품 개발=5,18,2
2.1(1.1) 5kW급 마그네트론=7,20,3
2.2 고압 변 압기=9,22,2
2.3 필라멘트 변압기=11,24,1
2.4 고압용 리액터=12,25,1
2.5 고압 정류 다이오드=13,26,1
2.6 코압 콘덴서=13,26,1
2.7 출력가변장치=14,27,1
제3장 마이크로파 건조 특성=15,28,1
3.1 유전체 가열=15,28,1
3.2 마이크로파 침투 깊이=16,29,2
3.3 열풍건조와 마이크로파에 대한 건조 특성=18,31,2
3.4 마이크로파 피건조체 가열에 대한 실험적 모델=20,33,2
3.5 마이크로파 피건조체 가열에 대한 수치해석적 모델=22,35,2
3.6 실험장치 및 방법=23,36,5
3.7 수치해석 방법=27,40,4
3.8 실험결과=31,44,12
3.9 수치해석 결과=43,56,6
3.10 실험결과 및 수치해석 결과 비교=49,62,6
3.11 마이크로파 건조 특성에 관한 실험 및 수치해석 결과 고찰=55,68,2
제4장 출력가변형 마이크로파 점토 건조장치=57,70,1
4.1 개요=57,70,1
4.2 점토 건조장치 시작품 제작 사양=58,71,2
4.3 마이크로파 운전 조건 설정을 위한 실험 분석=59,72,7
4.4 에너지변환 효율 측정 실험=65,78,2
4.5 20kW급 출력가변형 연속식 마이크로파 점토 건조 특성 분석=66,79,4
4.6 점토 건조의 생산성 극대화 방법 분석=69,82,2
4.7 에너지절감 분석=70,83,1
제5장 결론=71,84,1
*References=72,85,2
Fig. 2.1 Microwave generator.=5,18,1
Fig. 2.2 Power supply.=5,18,1
Fig. 2.3 Power control unit.=6,19,1
Fig. 3.1 Dipolar reorientation muchanism.=15,28,1
Fig. 3.2 Interaction of microwave with materials.=16,29,1
Fig. 3.3 History of moisture content.=19,32,1
Fig. 3.4 History drying rate.=19,32,1
Fig. 3.5 Schematic diagram of the drying systems.=24,37,1
Fig. 3.6 Schematic diagram of test piece installation.=24,37,1
Fig. 3.7 Numerical analysis model.=27,40,1
Fig. 3.8 Grid system.=28,41,1
Fig. 3.9 Grid points.=28,41,1
Fig. 3.10 Energy transform efficiency of eletricpower to heat energy for the MW dryer.=32,45,1
Fig. 3.11 Temperature variation of the clay specimen along the penetration depth during process when MW 100W irradiates on the top surface.=33,46,1
Fig. 3.12 Temperature variation of the clay specimen along the penetration depth during process when MW 200W irradiates on the top surface.=33,46,1
Fig. 3.13 Temperature variation of the clay specimen along the penetration depth during process when MW 300W irradiates on the top surface.=34,47,1
Fig. 3.14 Temperature variation of the clay specimen along the penetration depth during process when MW 400W irradiates on the top surface.=34,47,1
Fig. 3.15 Temperature variation of the clay specimen along the penetration depth during process when MW 500W irradiates on the top surface.=35,48,1
Fig. 3.16 Temperature variation of the clay specimen along the penetration depth during process when MW 600W irradiates on the top surface.=35,48,1
Fig. 3.17 Temperature variation of the clay specimen along with 30˚C intake air temperature during the process when MW 400W irradiates on all the surfaces.=36,49,1
Fig. 3.18 Temperature variation of the clay specimen along with 80˚C intake air temperature during the process when MW 400W irradiates on all the surfaces.=37,50,1
Fig. 3.19 Temperature variation of the clay specimen along with 130˚C intake air temperature during the process when MW 400W irradiates on all the surfaces.=37,50,1
Fig. 3.20 Variation of moisture contents and evaporation rate.=39,52,1
Fig. 3.21 History of each different encrgy rate.=39,52,1
Fig. 3.22 Temperature distribution in test clay during convective drying process when 130˚C air flows on the top surface.=41,54,1
Fig. 3.23 Variation of moisture content and evaporation rate for the convective drying.=42,55,1
Fig. 3.24 History of each different energy rate.=42,55,1
Fig. 3.25 Temperature variation of the clay specimen along the penetration depth during process when MW 200W irradiates on the top surface.=44,57,1
Fig. 3.26 Temperature variation of the clay specimen along the penetration depth during process when MW 300W irradiates on the top surface.=44,57,1
Fig. 3.27 Temperature variation of the clay specimen along the penetration depth during process when MW 400W irradiates on the top surface.=45,58,1
Fig. 3.28 Temperature variation of the clay specimen along the penetration depth during process when MW 500W irradiates on the top surface.=45,58,1
Fig. 3.29 Temperature variation of the clay specimen along the penetration depth during process when MW 600W irradiates on the top surface.=46,59,1
Fig. 3.30 Temperature variation of the clay specimen along the penetration depth during process when MW 200W irradiates on the top surface.=46,59,1
Fig. 3.31 Temperature variation of the clay specimen along the penetration depth during process when MW 300W irradiates on the top surface.=47,60,1
Fig. 3.32 Moisture variation of the clay specimen along the penetration depth during process when MW 400W irradiates on the top surface.=47,60,1
Fig. 3.33 Moisture variation of the clay specimen along the penetration depth during process when MW 500W irradiates on the top surface.=48,61,1
Fig. 3.34 Moisture variation of the clay specimen along the penetration depth during process when MW 600W irradiates on the top surface.=48,61,1
Fig. 3.35 Comparison with numerical and experimental results of temperature variation of the clay specimen along the penetration depth during the MW drying process when MW 200W irradiates on the top surface.=50,63,1
Fig. 3.36 Comparison with numerical and experimental results of temperature variation of the clay specimen along the penetration depth during the MW drying process when MW 300W irradiates on the top surface.=50,63,1
Fig. 3.37 Comparison with numerical and experimental results of temperature variation of the clay specimen along the penetration depth during the MW drying process when MW 400W irradiates on the top surface.=51,64,1
Fig. 3.38 Comparison with numerical and experimental results of temperature variation of the clay specimen along the penetration depth during the MW drying process when MW 500W irradiates on the top surface.=51,64,1
Fig. 3.39 Comparison with numerical and experimental results of temperature variation of the clay specimen along the penetration depth during the MW drying process when MW 600W irradiates on the top surface.=52,65,1
Fig. 3.40 Comparison with numerical and experimental results of temperature variation of the clay specimen along the penetration depth during the MW drying process when MW 200W irradiates on the top surface.=52,65,1
Fig. 3.41 Comparison with numerical and experimental results of temperature variation of the clay specimen along the penetration depth during the MW drying process when MW 300W irradiates on the top surface.=53,66,1
Fig. 3.42 Comparison with numerical and experimental results of temperature variation of the clay specimen along the penetration depth during the MW drying process when MW 400W irradiates on the top surface.=53,66,1
Fig. 3.43 Comparison with numerical and experimental results of temperature variation of the clay specimen along the penetration depth during the MW drying process when MW 500W irradiates on the top surface.=54,67,1
Fig. 3.44 Comparison with numerical and experimental results of temperature variation of the clay specimen along the penetration depth during the MW drying process when MW 200W irradiates on the top surface.=54,67,1
Fig. 4.1 Trial continuum microwave drying system.=58,71,1
Fig. 4.2 Schematic diagram of trlal continuum nucrowave drying system.=59,72,1
Fig. 4.3 Miniature microwave drying system.=59,72,1
Fig. 4.4 Comparison with MW 200W and MW 200W(+Hot 130˚C) experimental results of variation of moisture content.=62,75,1
Fig. 4.5 Comparison with MW 200W and MW 200W(+Hot 130˚C) experimental results of variation of temperature.=62,75,1
Fig. 4.6 Comparison with MW 700W and MW 700W(+Hot 130˚C) experimental results of variation of moisture content.=63,76,1
Fig. 4.7 Comparison with MW 700W and MW 700W(+Hot 130˚C) experimental results of variation of temperature.=63,76,1
Fig. 4.8 Moislure content variation of test clay during convective drying process when 130˚C air flows on all the surface.=64,77,1
Fig. 4.9 Temperature variation of test clay during convective drying process when 130˚C air flows on all the surface.=64,77,1
Fig. 4.10 Schematic diagram of moisture content variation of test clay during the continuum MW drying process.=67,80,1
Fig. 4.11 Moisture content variation of test clay during tile continuum MW drying process.=68,81,1
Fig. 4.12 Test pieces after drying when continuum MW drying system.=69,82,1
*표시는 필수 입력사항입니다.
| 전화번호 |
|---|
| 기사명 | 저자명 | 페이지 | 원문 | 기사목차 |
|---|
| 번호 | 발행일자 | 권호명 | 제본정보 | 자료실 | 원문 | 신청 페이지 |
|---|
도서위치안내: / 서가번호:

우편복사 목록담기를 완료하였습니다.
*표시는 필수 입력사항입니다.
저장 되었습니다.
