
 대표어
대표어


권호기사보기
| 기사명 | 저자명 | 페이지 | 원문 | 기사목차 |
|---|
결과 내 검색
동의어 포함
목차
표제지=0,1,1
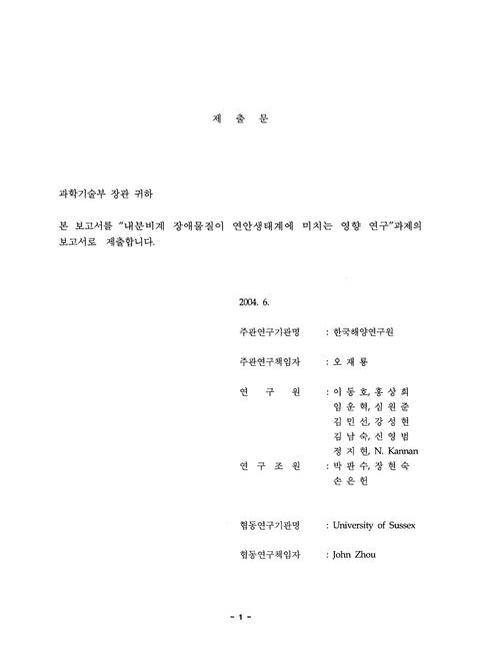
제출문=1,2,2
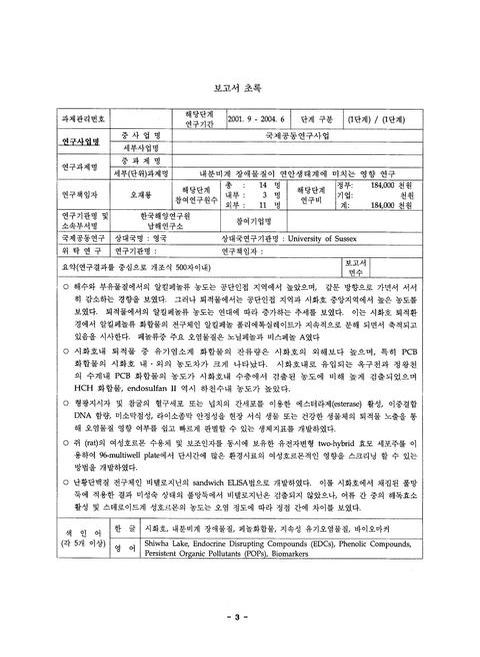
보고서 초록=3,4,2
요약문=5,6,10
Summary(영문요약문)=15,16,8
목차=23,24,2
그림 목차=25,26,4
표 목차=29,30,2
제1장 연구개발과제의 개요=31,32,1
1. 연구개발의 필요성=31,32,1
가. 연구개발의 목적=31,32,1
나. 연구개발의 필요성=31,32,3
다. 연구개발의 범위=33,34,2
제2장 국내외 기술개발 현황=35,36,1
1. 국내외 기술개발 현황=35,36,2
2. 선진국의 연구 사례=36,37,2
3. 국내의 경우=37,38,1
4. 조사연구개발사례에 대한 평가=37,38,2
제3장 연구개발수행 내용 및 결과=39,40,1
제1절 연구개요=39,40,4
제2절 시료채취=43,44,1
1. 시료채취 정점=43,44,1
2. 해수 및 하천수=43,44,2
3. 퇴적물 및 주상시료=44,45,1
4. 바이오마커 개발 및 현장 모니터링=44,45,5
제3절 분석방법=49,50,1
1. 페놀류 화합물=49,50,1
가. 표준물질 및 재료=49,50,1
나. 기기분석=49,50,1
다. 시료 전처리=49,50,7
2. 프탈산 에스텔류(Phthalate esters)의 분석방법=56,57,1
가. 분석 준비=56,57,2
나. 표층수=57,58,1
다. 퇴적물=57,58,1
라. 기기분석=57,58,4
3. 유기염소계 화합물(PCBs,유기염소계 농약) 및 다환방향족 탄화수소 (PAHs)의 분석방법=61,62,1
가. 퇴적물 및 생물=61,62,1
나. 해수 및 하천수=62,63,6
4. 바이오마커 개발 및 현장적용=68,69,1
가. 세포독성=68,69,4
나. 유전자면형 세포주를 이용한 여성호르몬영향 검정(Yeast Estrogenicity Screening Assaay)=71,72,2
다. 비텔로지닌(vitellogenine)과 성스테로이드 호르몬=72,73,5
제4절 EDC 운명 및 거동 연구=77,78,1
1. 페놀류 화합물=77,78,2
가. 시화호 및 주변 환경에서의 페놀류 화합물의 일반적인 분포=78,79,21
나. 연대별,계절별 및 시간별 변화에 대한 연구=98,99,5
다. 매질에 따른 페놀류 오염물질의 조성변화 및 상관관계에 관한 연구=102,103,3
라. 페놀류 오염물질의 오염원 규명에 관한 연구=104,105,2
마. 노닐페놀 축적과 분해에 관한 연구=105,106,18
2. 프탈산 프탈레이트류 화합물=123,124,1
가. 시화호 주변 하천에서의 프탈레이트류 오염=123,124,8
나. 시화호에서의 프탈레이트 오염=131,132,6
다. 시화호에서의 프탈레이트 오염물질의 거동 연구=137,138,3
3. 유기염소계 화합물(유기염소계 농약 및 PCBs)=140,141,1
가. 호 내ㆍ외의 표층퇴적물=140,141,5
나. 해수 및 하천수=145,146,2
다. 어류=147,148,3
4. 다환방향족 탄화수소 (PAHs)=150,151,1
가. 시화호 및 주변하천 퇴적물=150,151,4
나. 시화호 및 부근해역내 어류에 축적된 PAHs=154,155,4
제5절 바이오마커 개발 및 현장모니터링=158,159,1
1. 현장서식 참굴의 건강성 평가=158,159,2
2. 퇴적물 추출액의 세포독성=160,161,4
3. 퇴적물 및 물 추출액의 여성호르몬적인 영향=163,164,4
4. 어류에 미치는 영향=166,167,1
가. 비텔로지닌 검색법 개발=166,167,2
나. 어류에 대한 영향=167,168,4
다. 성 steroid hormone농도의 변화=170,171,3
라. 풀망둑의 비텔로지닌 변동과 비텔로지닌 mRNA 발현 양상 [내용누락;p173~174]=172,173,3
제4장. 목표달성도 및 관련분야에의 기여도[내용누락;p177~178]=175,176,4
제5장. 연구개발결과의 활용계획[내용누락;p181~182]=179,180,4
제6장. 참고문헌=183,184,6
Fig. 3-2-1. Surface water and sediment sampling sites in Aug. and Oct. 2001 and in Jun. and Oct. 2002=45,46,1
Fig. 3-2-2. Surface water and sediment sampling sites in Dec. 2001 and in Feb. 2002=46,47,1
Fig. 3-2-3. Surface water and sediment sampling site in 2003-2004=46,47,1
Fig. 3-2-4. Sampling stations of oysters (Crassostrea gigas) for field biomarker monitoring SJ: Seonje Is.,TD;Tando,SH;Shihwa,ND: Namdong Industrial Complex=47,48,1
Fig. 3-2-5. Sampling station of Acanthogobius hasta in Shihwa Lake=48,49,1
Fig. 3-3-1. Schematic diagram of analytical processes for simultaneous determination of phenolic compounds from water and sediment by GC/MSD=54,55,1
Fig. 3-3-2. Schematic diagram of silylation and cleanup kit=55,56,1
Fig. 3-3-3. Schematic diagram of analytical procedure for phthalate and adipate esters=58,59,1
Fig. 3-3-4. Analysis procedures of organochlorine compounds and PAHs=63,64,1
Fig. 3-4-1,Concentration of phenolic analytes in surface water from the Lake Shihwa (2001)=94,95,1
Fig. 3-4-2. Concentration of phenolic analytes In surface water from the Lake Shihwa (2002)=94,95,1
Fig. 3-4-3. Concentration (ng/L) of phenolic analytes in surface suspended particle from the Lake Shihwa (2002)=96,97,1
Fig. 3-4-4. Concentration (ng/g dry) of phenolic analytes in surface sediment from the Lake Shihwa (2001 and 2002)=96,97,1
Fig. 3-4-5. Comparison of annual variation of nonylphenol in surface seawater from Shihwa Lake=109,110,1
Fig. 3-4-6. Comparison of annual variation of nonylphenol in surface sediment from Shihwa Lake=109,110,1
Fig. 3-4-7. Comparison of seasonal variation of nonylphenol in surface seawater from Shihwa Lake=110,111,1
Fig. 3-4-8. Comparison of seasonal variation of nonylphenol in suspended particle from Shihwa Lake=110,111,1
Fig. 3-4-9. Comparison of seasonal variation of nonylphenol In surface sediment from Shihwa Lake=111,112,1
Fig. 3-4-10. Real time monitoring on phenolic compounds from surface seawater at station 4 In Jul. 2003=111,112,1
Fig. 3-4-11. Composition of phenolic compounds in lake and creek=112,113,1
Fig. 3-4-12. Composition of phenolic compounds in water,suspended particle and sediment in Shihwa Lake=112,113,1
Fig. 3-4-13. Correlation of nonylphenol concentration (ng/L) between water and suspended particle in the Shihwa Lake=113,114,1
Fig. 3-4-14. Correlation of nonylphenol concentration between water (ng/L) and sediment (ng/g dry) in the Shihwa Lake=113,114,1
Fig. 3-4-15. Correlation of nonylphenol concentration between suspended particle (ng/L) and sediment (ng/g dry) in the Shihwa Lake=114,115,1
Fig. 3-4-16. Comparison of nonylphenol concentration in water samples between estuary and creek (Jul. 2002),"St" indicate location in Lake and "c" indicate location in creek=115,116,1
Fig. 3-4-17. Comparison of nonylphenol concentration in water samples between estuary and creek (Oct. 2002). "St" indicate location in Lake and "c" indicate location in creek=116,117,1
Fig. 3-4-18. Correlation between nonylphenol concentration and water quality parameters in the Shihwa Lake (Feb. 2003)=117,118,1
Fig. 3-4-19. Correlation between nonylphenol concentration and water quality parameters in the Shihwa Lake (May 2003)=118,119,1
Fig. 3-4-20. Correlation between nonylphenol concentration and water quality parameters in the Shihwa Lake (Jul. 2003)=119,120,1
Fig. 3-4-21. Histories of nonylphenol in core sediment. A represent site 5 and B represent site 13 (2001)=120,121,1
Fig. 3-4-22. Degradation of phenolic compounds in water matrix under anaerobic and room temperature conditions (2003)=121,122,1
Fig. 3-4-23. Variation of ratios with degradation of phenolic compounds in water matrix under anaerobic and room temperature conditions (2003)=122,123,1
Fig. 3-4-24. Ratios of phenolic compounds in seawater from Shihwa Lake (2003)=122,123,1
Fig. 3-4-25. Concentration profiles of total phthalic esters in surface creek water (Dec. 2001 and Feb. 2002)=130,131,1
Fig. 3-4-26. Concentration profiles of total phthalic esters in surface lake water (Dec. 2001 and Feb. 2002)=136,137,1
Fig. 3-4-27. Composition profile of phthalic esters in lake and creek=138,139,1
Fig. 3-4-28. Correlation between concentration of phthalic ester (DEHP) and content of total phosphate in the Shihwa Lake sediment (Oct. 2002)=138,139,1
Fig. 3-4-29. Correlation between concentration of phthalic ester (DEHP) and nonylphenol (NP) in the Shihwa Lake sediment (Oct. 2002)=139,140,1
Fig. 3-4-30. Distribution of ∑PCB and ∑DDT in surface sediments=142,143,1
Fig. 3-4-31. Distribution of ∑HCH and ∑CHL in surface sediments=142,143,1
Fig. 3-4-32. Average concentrations of organochlorine compounds in sediment from nine bays of Korea=143,144,1
Fig. 3-4-33. Distribution of ∑PCB in surface sediments from outside of Shihwa Lake=144,145,1
Fig. 3-4-34. Comparison of concentrations of major organochlrines in surface sediments from inside and outside of Shihwa Lake=144,145,1
Fig. 3-4-35. Distribution of ∑PCB in waters from inner part of lake and nearby creeks=146,147,1
Fig. 3-4-36. Distribution of organochlorine pesticides in waters from inner part of lake and nearby creeks=146,147,1
Fig. 3-4-37. Composition profiles of PAHs in surface sediments from Lake Siwha Vicinity of Siwha and Banwol Industrial Complex (1) and central part and vicinity of water-gate (2). MW128: naphthalene;alkyl N: sum of C1 napththalene,2,6 dimethylnaphthalen=152,153,1
Fig. 3-4-38. Composition profiles of PAHs in surface sediments from nearby creeks. Mw128: naphthalene;alkyl N: sum of C1 napththalene,2,6 dimethylnaphthalene,1,3,5 trimethylnaphthalene;152+154+166: sum of biphenyl,acenaphthene,fluorene;178: sum o=153,154,1
Fig. 3-4-39. Correlation between total PHMs concentration and lipid contents in tissue and liver of fish samples=157,158,1
Fig. 3-5-1. Cytotoxicity (esterase activity,double strand DNA content,Iysosomal activity and microviscosity) of hemolymph and digestive gland of Pacific oysters ( Crassostrea gigas) collected near Shihwa Lake in June 2002=159,160,1
Fig. 3-5-2. Cell viability of olive flounder hepatocytes exposed to sediment extracts for 24 h. Creek sediments: 1-R7,2-R6,3-R5,4-R4,5-R3,6-R2,7-R1=160,161,1
Fig. 3-5-3. Ethoxyresorufin-O-deethylase (EROD) activity of olive flounder hepatocytes exposed to sediment extracts for 3 h. Creek sediments: 1-R7,2-R6,3-R5,4-R4,5-R3,6-R2,7-R1=161,162,1
Fig. 3-5-4. Esterase activity of olive flounder hepatocytes exposed to sediment extracts for 24 h. Creek sediments: 1-R7,2-R6,3-R5,4-R4,5-R3,6-R2,7-R1=162,163,1
Fig. 3-5-5. Esterase activity of olive flounder hepatocytes exposed to sediment extracts in serial dilution for 24 h. Creek sediments: 1-R7,2-R6,3-R5,4-R4,5-R3,6-R2,7-R1=162,163,1
Fig. 3-5-6. Double strand DNA contents of olive flounder hepatocytes exposed to sediment extracts for 24 h. Creek sediments: 1-R7,2-R6,3-R5,4-R4,5-R3,6-R2,7-R1=163,164,1
Fig. 3-5-7. Two-hybrid yeast estrogenicity screening assay for the Shihwa Lake and creek sediment extracts=164,165,1
Fig. 3-5-8. Relative estrogenicity induced by Shihwa Lake and creek sediment extracts to 17β-estradiol (E₂) maximum induction=165,166,1
Fig. 3-5-9. Relationship between EC50 values of estrogenicity and concentrations of phenolic compounds (sum of nonylphenol,octylphenol and biphenol-A) in Shihwa Lake and creek sediments=166,167,1
Fig. 3-5-10. Changes in hepatic Cytochrome P450 concentration of Acanthogobius hasta in Shihwa lake=168,169,1
Fig. 3-5-11. Changes in hepatic EROD activity of Acanthogobius hasta in Shihwa lake. Asterisk indicates the significant difference from the lstage=168,169,1
Fig. 3-5-12. Changes In hepatic PROD activity of Acanthogobius hasta in Shihwa lake. Asterisk indicates the significant difference from the lstage=169,170,1
Fig. 3-5-13. Changes in hepatic NADPH cytochrome b5 reductase activity of Acanthogobius hasta in Shihwa lake. Asterisk indicates the significant difference from the 1 stage=169,170,1
Fig. 3-5-14. Changes in hepatic NADH cytochrome b5 reductase activity of Acanthogobius hasta in Shihwa lake. Asterisk indicates the significant difference from the 1 stage=170,171,1
Fig. 3-5-15. Plasma testosterone concentration in Acanthogobius hasta in Shihwa lake=171,172,1
Fig. 3-5-16. Plasma estadiol-17β concentration in Acanthogobius=171,172,1
Fig. 3-5-17. VTG mRNA expression in Acanthogobius hasta in Shihwa lake. A: VTG mRNA;B: β-actin=172,173,1
*표시는 필수 입력사항입니다.
| 전화번호 |
|---|
| 기사명 | 저자명 | 페이지 | 원문 | 기사목차 |
|---|
| 번호 | 발행일자 | 권호명 | 제본정보 | 자료실 | 원문 | 신청 페이지 |
|---|
도서위치안내: / 서가번호:

우편복사 목록담기를 완료하였습니다.
*표시는 필수 입력사항입니다.
저장 되었습니다.
