
권호기사보기
| 기사명 | 저자명 | 페이지 | 원문 | 기사목차 |
|---|
| 대표형(전거형, Authority) | 생물정보 | 이형(異形, Variant) | 소속 | 직위 | 직업 | 활동분야 | 주기 | 서지 | |
|---|---|---|---|---|---|---|---|---|---|
| 연구/단체명을 입력해주세요. | |||||||||
|
|
|
|
|
|
* 주제를 선택하시면 검색 상세로 이동합니다.
목차
표제지=0,1,1
제출문=i,2,1
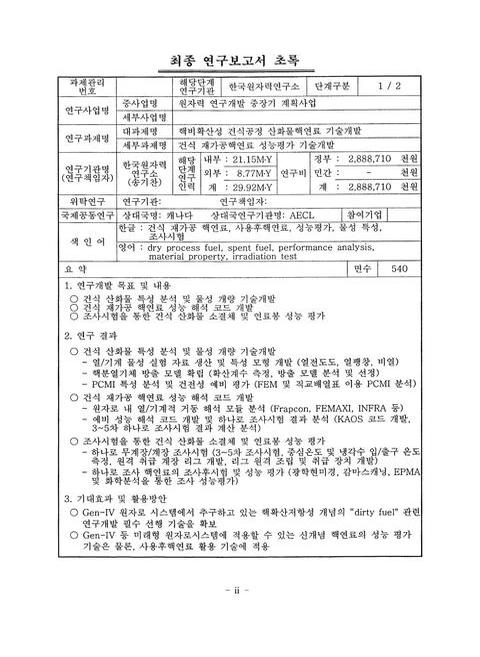
최종 연구보고서 초록/송기찬=ii,3,1
요약문=iii,4,4
Summary(영문요약문)=vii,8,4
CONTENTS=xi,12,3
목차=xiv,15,2
TABLES=xvi,17,5
FIGURES=xxi,22,22
제1장. 연구개발 과제의 개요=1,44,1
제1절. 연구개발의 목적=1,44,2
제2절. 연구개발의 필요성=3,46,2
제3절. 연구개발의 범위=5,48,4
제2장. 국내ㆍ외 기술개발 현황=9,52,1
제1절. 국내 기술개발 현황=9,52,1
1. 핵연료 물성 특성 분석 기술=9,52,5
2. 핵연료 성능 평가 코드 개발=14,57,2
3. 핵연료 조사시험 기술=15,58,3
4. 핵연료 조사후시험 기술=17,60,2
제2절. 국외 기술개발 현황=19,62,1
1. 핵연료 물성 특성 분석 기술=19,62,8
2. 핵연료 성능 평가 코드 개발=26,69,6
3. 핵연료 조사시험 기술=31,74,10
4. 핵연료 조사후시험 기술=40,83,10
제3절. 국내ㆍ외 기술 수준 비교=50,93,3
제3장. 연구개발 수행 내용 및 결과=53,96,1
제1절. 건식 산화물 물성 특성 분석=53,96,1
1. 물성 측정용 표준 시료 제조 공정 확립=53,96,38
2. 열 물성 특성 실험 자료 생산 및 특성 모형 개발=91,134,38
3. 기계 물성 특성 실험 자료 생산 및 특성 모형 개발=129,172,19
4. 핵분열기체 방출 특성 분석=147,190,4
5. 건식재가공핵연료의 소결체-피복관 상호작용 해석=151,194,14
제2절. 건식 재가공핵연료 성능 해석 코드 개발=165,208,1
1. 열/기계 성능 해석 모듈 분석=165,208,48
2. 화학적 거동 모델 분석=212,255,6
3. 건식 재가공 성능평가 코드 개발 및 평가=218,261,40
4. 건식 재가공 핵연료 성능 검증 DB 설계=258,301,8
5. 핵연료 설계변수의 최적화 방법론 개발=265,308,31
제3절. 조사시험을 통한 건식 산화물 소결체 및 연료봉 성능평가=296,339,1
1. 하나로 이용한 조사시험 및 성능평가=296,339,119
2. 조사후시험 및 성능 평가=415,458,60
3. 한-카 공동 NRU 조사시험 및 성능 평가=475,518,4
제4장. 연구개발 목표 달성도 및 관련 분야에의 기여도=479,522,1
제1절. 연구개발 목표 달성도=479,522,5
제2절. 관련 분야에의 기여도=484,527,1
제5장. 연구개발 결과의 활용 계획=485,528,2
제6장. 연구개발 과정에서 수집한 해외 과학기술 정보=487,530,11
영문목차
[title page etc.]=0,1,11
CONTENTS=xi,12,32
Ch. 1 Project Generals=1,44,1
Sec. 1 Purpose of the Project=1,44,2
Sec. 2 Necessity of the Project=3,46,2
Sec. 3 R&D Scope of the Project=5,48,4
Ch. 2 State of the Art of Related Technology=9,52,1
Sec. 1 State of the Art in Kirea=9,52,1
1. Analysis of material puoperties of nuclear fuel=9,52,5
2. Nuclear fuel performance evaluation code=14,57,2
3. Irradiation test technology of nuclear fuel=15,58,3
4. Post irradiation examination technology of nuclear fuel=17,60,2
Sec. 2 State of the Art in Foreign Countries=19,62,1
1. Analysis of material properties of nuclear fuel=19,62,8
2. Nuclear fuel performance evaluation code=26,69,6
3. Irradiation test technology of nuclear fuel=31,74,11
4. PIE technology of nuclear fuel=41,84,9
Sec. 3 Comparison of R&D status between Korea and Foreign Countries=50,93,3
Ch. 3 R&D Results Achievements=53,96,1
Sec. 1 analysis of material properties of dry process fuel=53,96,1
1. Establishment of fabrication process of standard reference material=53,96,38
2. Experiment of thermal properties and development of characteristics models=91,134,38
3. Experiment of mechanical properties and development of characteristics models=129,172,19
4. Analysis on fission gas release characteristics=147,190,4
5. Estimation of pellet-cladding interaction=151,194,14
Sec. 2 Code Development of Dry Process fuel Performance Analysis=165,208,1
1. Analysis on modules for estimating thermal/mechanical behavior=165,208,48
2. Analysis on chemical behavior models=212,255,6
3. Development and verification of fuel performance analysis code=218,261,40
4. Design of database system for fuel performance verification=258,301,8
5. Development of optimization methodology of fuel design parameters=265,308,31
Sec. 3 Performance Evaluation of Dry Process Pellet and Element by Irradiation Test=296,339,1
1. Irradiation tests at HANARO and in-reactor behavior analysis=296,339,119
2. Post irradiation examination and performance analysis=415,458,60
3. NRU irradiation test and performance analysis in cooperation between KAERI and AECL=475,518,4
Ch. 4 Achievements of the Project and Contributions to Related R&D Areas=479,522,1
Sec. 1 Achievements of the Project=479,522,5
Sec. 2 Contributions to Related R&D Areas=484,527,1
Ch. 5 Implementation Plan of R&D Results=485,528,2
Ch. 6 Overseas Information on Related Science and Technology=487,530,11
Fig. 2.1.1 Post-irradiation annealing equipment for measuring the diffusion coefficient of fission gas=23,66,1
Fig. 3.1.1 Flow chart for the fabrication of UO₂+SS sintered pellets=55,98,1
Fig. 3.1.2 Flowability of UO₂ powder trated by dynamic milling=58,101,1
Fig. 3.1.3 Green density of UO₂ powder treated by dynamic milling=59,102,1
Fig. 3.1.4 Sintered density of UO₂ powder treated by dynamic milling=59,102,1
Fig. 3.1.5 Microstructure of the natural UO₂ and treated UO₂by D.M for 4hrs=60,103,1
Fig. 3.1.6 Flowability of UO₂ powder treated by turbular milling=62,105,1
Fig. 3.1.7 Green density of UO₂ powder treated by turbular milling=63,106,1
Fig. 3.1.8 Sintered density of UO₂ powder treated by turbular milling=63,106,1
Fig. 3.1.9 Flowability of UO₂and UO₂+SS1 powder with new dynamic milling time=66,109,1
Fig. 3.1.10 Green density of UO₂and UO₂+SS1 powder with new dynamic milling time=66,109,1
Fig. 3.1.11 Sintered density of UO₂and UO₂+SS1 powder with new dynamic milling time=67,110,1
Fig. 3.1.12 SEM morphology of natural UO₂and UO₂+SS1 powder with new dynamic milling time (x5000)=67,110,1
Fig. 3.1.13 Microstructures of natural UO₂and UO₂+SS1 sintered pellets with new dynamic milling time=68,111,1
Fig. 3.1.14 Flowability of natural UO₂and UO₂+SS1 powder with new dynamic milling time=71,114,1
Fig. 3.1.15 Green density of natural UO₂and UO₂+SS1 powder with dynamic milling time=72,115,1
Fig. 3.1.16 Sintered density of Natural UO₂ and UO₂+SS1 powder with dynamic milling time=72,115,1
Fig. 3.1.17 Microstructure of UO₂and UO₂+SS1 powder with dynamic milling time=73,116,1
Fig. 3.1.18 Flowability of UO₂and UO₂+SS powder due to turbular milling time=75,118,1
Fig. 3.1.19 Green density of UO₂and UO₂+SS powder with turbular milling time=76,119,1
Fig. 3.1.20 Sintered density of UO₂and UO₂+SS powder with turbular milling time=76,119,1
Fig. 3.1.21 Microstructure of UO₂and UO₂+SS1 sintered pellets with turbular milling time=77,120,1
Fig. 3.1.22 Flowability of UO₂and UO₂+SS (SS1,SS2,SS4) powder with dynamic milling time=80,123,1
Fig. 3.1.23 Green density of UO₂and UO₂+SS (SS1,SS2,SS4) powder with dynamic milling time=80,123,1
Fig. 3.1.24 Sintered density of UO₂and UO₂+SS (SS1,SS2,SS4) powder with dynamic milling time=81,124,1
Fig. 3.1.25 Microstructure of UO₂and UO₂+SS1,SS2,SS4 sintered pellets=82,125,1
Fig. 3.1.26 Flowability of UO₂and UO₂+SS powder due to milling time and method=85,128,1
Fig. 3.1.27 Green density of UO₂and UO₂+SS powder due to milling time and method=85,128,1
Fig. 3.1.28 Sintered density of UO₂and UO₂+SS powder due to milling time and method=86,129,1
Fig. 3.1.29 Micro structure of sintered pellets UO₂+SS due to milling time and method=87,130,1
Fig. 3.1.30 Green density of UO₂and UO₂+SS powder due to milling time and compacting pressure=89,132,1
Fig. 3.1.31 Sintered density of UO₂and UO₂+SS powder due to milling time and compacting pressure=89,132,1
Fig. 3.1.32 Micro structure of sintered pellets of natural UO₂due to compacting pressure=90,133,1
Fig. 3.1.33 High temperature enthalpy of UO₂as a function of temperature=93,136,1
Fig. 3.1.34 High temperature hear capacity of UO₂as a function of temperature=93,136,1
Fig. 3.1.35 Components contribution to the enthalpy of UO₂as a function of temperature=94,137,1
Fig. 3.1.36 Potential energy versus inter-atomic distance=104,147,1
Fig. 3.1.37 Lattice parameters of UO₂and simulated fuels as a function of temperature=112,155,1
Fig. 3.1.38 Linear thermal expansion of UO₂and simulated fuels with temperature variation=114,157,1
Fig. 3.1.39 Linear thermal expansion coefficient of UO₂and simulated fuels with temperature variation=115,158,1
Fig. 3.1.40 Density variation of UO₂and simulated fuels with temperature variation=116,159,1
Fig. 3.1.41 Thermal expansion of simulated fuels and UO₂measured by dilatometer=117,160,1
Fig. 3.1.42 Thermal expansion of simulated fuel=117,160,1
Fig. 3.1.43 Density variation of simulated fuel with solid solution (6at%)=119,162,1
Fig. 3.1.44 Thermal conductivity of dry process fuels=127,170,1
Fig. 3.1.45 Equipment of resonant ultrasound spectroscopy(RUS)=130,173,1
Fig. 3.1.46 Young's modulus for stoichimetric UO₂fuel at several temperature and faactions of theoretical density=135,178,1
Fig. 3.1.47 Young's modulus data and least-squates linear fit for stoichimetric UO₂fuel at room temperature and several different densities=136,179,1
Fig. 3.1.48 Young's modulus of UO₂and simulated dry process fuel with porosity=137,180,1
Fig. 3.1.49 The amount of fission product in (a) simulated spent fuel and (b) theoretical density of simulated spent fuel=138,181,1
Fig. 3.1.50 Scanning electron micrographs of simulated dry process fuel after sintering=140,183,1
Fig. 3.1.51 High temperature microhardness tester (Nikon QM-2)=141,184,1
Fig. 3.1.52 Indentation microstructure of dry process fuel after high temperature hardness test=143,186,1
Fig. 3.1.53 Variation of vickers hardness of UO₂and dry process fuel with temperature=144,187,1
Fig. 3.1.54 Microstructural comparison between (a) UO₂and (b) dry process fuel after high temperature indentation test=144,187,1
Fig. 3.1.55 Fracture toughness measurement from indentation crack length method=146,189,1
Fig. 3.1.56 Sample microstructure of indentation crack after a hardness test=146,189,1
Fig. 3.1.57 Fracture toughness of UO₂and dry process fuel measured from indentation crack length method=147,190,1
Fig. 3.1.58 Post-irradiation annealing test equipment=148,191,1
Fig. 3.1.59 Quartz tube sealing of irradiation sample gor diffusion coefficient measurement=149,192,1
Fig. 3.1.60 Zircaloy sealing and aluminum irradiation can of irradiation Sample for diffusion coefficient measurement=149,192,1
Fig. 3.1.61 Effective diffusivity comparison between UO₂ and dry process fuel=150,193,1
Fig. 3.1.62 Temperature distribution of UO₂ at 45kW/m=153,196,1
Fig. 3.1.63 Temperature distribution of dry process fuel at 45kW/m=154,197,1
Fig. 3.1.64 Centerline temperature change of UO₂at power transient=155,198,1
Fig. 3.1.65 Surface temperature change of UO₂ at power transient=155,198,1
Fig. 3.1.66 Stress analysis of dry process fuel by linear analysis method=156,199,1
Fig. 3.1.67 Stress analysis of dry process fuel by nonlinear analysis method=156,199,1
Fig. 3.1.68 The effect of the performance variables on (a) the centerline temperature,(b) plastic strain of the sheath and (c) fission gas release of the DUPIC fuel with burnup at a linear heat rate of 40 kW/m=158,201,1
Fig. 3.1.69. Statistical variation of the (a) interfacial pressure between pellet and cladding,(b) ridge height at the pellet end,(c) hoop strain at pellet end,(d) internal gas pressure,and (e) central temperature of the DUPIC fuel with the levels in=160,203,1
Fig. 3.1.70 Comparison of (a) central temperature,(b) internal pressure,and (c) plastic strain of cladding between a rod with small initial gap and high pellet density and the other one with large initial gap and low pellet density=164,207,1
Fig. 3.1.71 Comparison of safety margin ration of a rod with large initial gap,large grain and low pellet density and the other one with small initial gap,small grain and high pellet density=164,207,1
Fig. 3.2.1 Basic flowchart of FRAPCON-3=166,209,1
Fig. 3.2.2 Subroutines of FRAPCON-3=167,210,1
Fig. 3.2.3 Average linear power=175,218,1
Fig. 3.2.4 Radial temperature distribution=175,218,1
Fig. 3.2.5 Fuel centerline temperature=176,219,1
Fig. 3.2.6 Clad hoop stress=176,219,1
Fig. 3.2.7 Clad creep strain=177,220,1
Fig. 3.2.8 Gap conductance=177,220,1
Fig. 3.2.9 Gap pressure=178,221,1
Fig. 3.2.10 Fission gas release=178,221,1
Fig. 3.2.11 Code structure of FEMAXI-V=182,225,1
Fig. 3.2.12 Power history of the 4th(이미지참조) dry process fuel irradiation in HANARO=188,231,1
Fig. 3.2.13 Comparison of pellet temperature profiles of FEMAXI-IV and FEMAXI-V with burnup=188,231,1
Fig. 3.2.14 Temperature profile of pellet by FEMAXI-IV=189,232,1
Fig. 3.2.15 Temperature profile of pellet by FEMAXI-V=189,232,1
Fig. 3.2.16 Comparison of pellet densification of FEMAXI-IV and FEMAXI-V with burnup=190,233,1
Fig. 3.2.17 Comparison of pellet swelling of FEMAXI-IV and FEMAXI-V with burnup=190,233,1
Fig. 3.2.18 Comparison of pellet radial displacement by FEMAXI-IV and FEMAXI-V with burnup=191,234,1
Fig. 3.2.19 Comparison of radial gap size by FEMAXI-IV and FEMAXI-V with burnup=191,234,1
Fig. 3.2.20 Comparison of pellet axial displacement (center) by FEMAXI-IV and FEMAXI-V with burnup=192,235,1
Fig. 3.2.21 Comparison of pellet axial displacement (surface) by FEMAXI-IV and FEMAXI-V with burnup=192,235,1
Fig. 3.2.22 Comparison of pellet radial displacement by FEMAXI-IV and FEMAXI-V with burnup=193,236,1
Fig. 3.2.23 Comparison of diametral maximum ridge height by FEMAXI-IV and FEMAXI-V with burnup=193,236,1
Fig. 3.2.24 Comparison of fission gas releases by FEMAXI-IV and FEMAXI-V with burnup=194,237,1
Fig. 3.2.25 Comparison of internal gas pressure by FEMAXI-IV and FEMAXI-V with burnup=194,237,1
Fig. 3.2.26 Comparison of pellet circumferential stress by FEMAXI-IV and FEMAXI-V with burnup=195,238,1
Fig. 3.2.27 Comparison of pellet axial stress by FEMAXI-IV and FEMAXI-V with burnup=195,238,1
Fig. 3.2.28 Comparison of pellet radial stress by FEMAXI-IV and FEMAXI-V with burnup=196,239,1
Fig. 3.2.29 Comparison of pellet equivalent stress by FEMAXI-IV and FEMAXI-V with burnup=196,239,1
Fig. 3.2.30 Comparison of clad circumferential stress by FEMAXI-IV and FEMAXI-V with burnup=197,240,1
Fig. 3.2.31 Comparison of clad axial stress by FEMAXI-IV and FEMAXI-V with burnup=197,240,1
Fig. 3.2.32 Comparison of clad radial stress by FEMAXI-IV and FEMAXI-V with burnup=198,241,1
Fig. 3.2.33 Comparison of clad equivalent stress by FEMAXI-IV and FEMAXI-V with burnup=198,241,1
Fig. 3.2.34 Flowchart of FRAPCON-3=200,243,1
Fig. 3.2.35 Flowchart of fEMAXI-V=201,244,1
Fig. 3.2.36 Flowchart of ELESTRES=202,245,1
Fig. 3.2.37 Flowchart of LIFE-I=203,246,1
Fig. 3.2.38 Flowchart of the fuel and cladding temperature calculation=204,247,1
Fig. 3.2.39 Centerline temperatures according to linear power increases for each thermal model under PWR condition=221,264,1
Fig. 3.2.40 Temperature distributions according to linear power increases for each thermal model under PWR condition=222,265,1
Fig. 3.2.41 Cladding-to-pellet gap clearances according to linear power increases for each thermal models under PWR condition=223,266,1
Fig. 3.2.42 Gap conductances according to linear power increases for each thermal model under PWR condition=224,267,1
Fig. 3.2.43 Fission gas releases according to linear power increases for each thermal model under PWR condition=226,269,1
Fig. 3.2.44 Centerline Temperatures according to linear power increases for each thermal model under HANARO condition=227,270,1
Fig. 3.2.45 Temperature distributions according to linear power increases for each thermal model under HANARO condition=228,271,1
Fig. 3.2.46 Cladding-to-pellet gap clearances according to linear power increases for each thermal models under HANARO condition=228,271,1
Fig. 3.2.47 Gap conductances according to linear power increases for each thermal model under HANARO condition=230,273,1
Fig. 3.2.48 Fission gas releases according to linear power increases for each thermal model under PWR condition=230,273,1
Fig. 3.2.49 Pellet center temperature for various cases=235,278,1
Fig. 3.2.50 Gap size for various cases=235,278,1
Fig. 3.2.51 Axial strain for various cases=237,280,1
Fig. 3.2.52 Fuel outer diameter for various cases=237,280,1
Fig. 3.2.53 Gap conductance for various cases=238,281,1
Fig. 3.2.54 Rod internal pressure for various cases=238,281,1
Fig. 3.2.55 Cladding inner surface temperature for various cases=239,282,1
Fig. 3.2.56 Fission gas release for various cases=239,282,1
Fig. 3.2.57 Linear power density for 3rd(이미지참조) and 4th(이미지참조) HANARO irradiation test for dry process fuel rod=241,284,1
Fig. 3.2.58 Fuel centerline temperature for various cases=243,286,1
Fig. 3.2.59 Fission gas release for various cases=244,287,1
Fig. 3.2.60 Total displacement of fuel for dry process fuel=244,287,1
Fig. 3.2.61 Power history of the 2nd(이미지참조) irradiation test at HANARO=248,291,1
Fig. 3.2.62 Centerline temperature profile of the 2nd(이미지참조) irradiation test=249,292,1
Fig. 3.2.63 Gap conductance variation of the 2nd(이미지참조) irradiation test=249,292,1
Fig. 3.2.64 Power history of the 3rd(이미지참조) irradiation test=250,293,1
Fig. 3.2.65 Centerline temperature profile of the 3rd(이미지참조) irradiation test=250,293,1
Fig. 3.2.66 Gap conductance variation of the 3rd(이미지참조) irradiation test=251,294,1
Fig. 3.2.67 Power history of the 4th(이미지참조) irradiation test at HANARO=251,294,1
Fig. 3.2.68 Centerline tempterature progile of the sth(이미지참조) irradiation test=252,295,1
Fig. 3.2.69 Gap conductance variation of the 4th(이미지참조) irradiation test=252,295,1
Fig. 3.2.70 Power history of the 5th(이미지참조) irradiation test at HANARO=253,296,1
Fig. 3.2.71 Centerline temperature profile of the 5th(이미지참조) irradiation test=254,297,1
Fig. 3.2.72 Gap conductance variation of the 5th(이미지참조) irradiation test=254,297,1
Fig. 3.2.73 Measured and calculated data of centerline temperature considering the uncertainty of the code system=256,299,1
Fig. 3.2.74 Measured and calculated data of centerline temperature after burnup calibration=257,300,1
Fig. 3.2.75 Nuclear fuel performance evaluation system=259,302,1
Fig. 3.2.76 Nuclear fuel performance database homepage=263,306,1
Fig. 3.2.77 Database structure=263,306,1
Fig. 3.2.78 Thermal conductivity for dry process fuel and UO₂fuel=266,309,1
Fig. 3.2.79 Thermal expansion for dry process fuel and UO₂fuel=267,310,1
Fig. 3.2.80 Linear power envelop of CANDU 6 reactor for simulation=268,311,1
Fig. 3.2.81 Distribution of fuel center temperature as a function of density=273,316,1
Fig. 3.2.82 Distribution of internal gas pressure as a function of density=274,317,1
Fig. 3.2.83 Distribution of plastic strain as a function of density=274,317,1
Fig. 3.2.84 Distribution of internal fission gas pressure as a function of grain size=275,318,1
Fig. 3.2.85 Sensitivity of fuel centerline temperature for fuel density=284,327,1
Fig. 3.2.86 Sensitivity of strain for fuel density=284,327,1
Fig. 3.2.87 Sensitivity of internal pressure for fuel density=285,328,1
Fig. 3.2.88 Sensitivity of fuel centerline temperature for cladding inner diameter=285,328,1
Fig. 3.2.89 Sensitivity of strain for cladding inner diameter=286,329,1
Fig. 3.2.90 Sensitivity of internal pressure for cladding inner diameter=286,329,1
Fig. 3.2.91 Sensitivity of fuel centerline temperature for pellet outer diameter=287,330,1
Fig. 3.2.92 Sensitivity of strain for pellet outer diameter=287,330,1
Fig. 3.2.93 Sensitivity of internal pressure for pellet outer diameter=288,331,1
Fig. 3.2.94 Sensitivity of internal pressure for plenum length=288,331,1
Fig. 3.2.95 Sensitivity of strain for plenum length=289,332,1
Fig. 3.2.96 Optimization method for fuel design parameter for random sampling=290,333,1
Fig. 3.2.97 Objective functions by random sampling for UO₂fuel rod=291,334,1
Fig. 3.2.98 Objective functions by random sampling for dry process fuel rod=292,335,1
Fig. 3.2.99 Random sampling and Latin-hypercube sampling=294,337,1
Fig. 3.2,100 Objective functions for various simulations by Latin-hypercube sampling for dry process fuel rod=294,337,1
Fig. 3.3.1 Fuel position and burnup of irradiation core in which dry process fuel is loaded (%U-235)=309,352,1
Fig. 3.3.2 Fuel temperature in RIA calculated by FEMAXI-IV=315,358,1
Fig. 3.3.3 Fuel temperature and MDNBR in RIA calculated by MARS=316,359,1
Fig. 3.3.4 Result of locked rotor accldent calculated by FEMAXI-IV=317,360,1
Fig. 3.3.5 Result of locked rotor accident calculated by MARS=318,361,1
Fig. 3.3.6 Work scopes and schedule for the 4th(이미지참조) irradiation test in HANARO=323,366,1
Fig. 3.3.7 The main drawing of 4th(이미지참조) irradiation rig=330,373,1
Fig. 3.3.8 The cross section drawin of 4th (이미지참조) irradiation rig=330,373,1
Fig. 3.3.9 Mini-element Specification=332,375,1
Fig. 3.3.10 Before the welding of minl-element=332,375,1
Fig. 3.3.11 After the welding of mini-element=333,376,1
Fig. 3.3.12 Marking of element assembly=334,377,1
Fig. 3.3.13 Before the assembly of element assembly=334,377,1
Fig. 3.3.14 After the assembly of element assembly=334,377,1
Fig. 3.3.15 Mini-element spec of 4th(이미지참조) irradiation test=335,378,1
Fig. 3.3.16 The assembly of irradiation test rig=336,379,1
Fig. 3.3.17 The complete assembly of irradiation test rig=336,379,1
Fig. 3.3.18 The HANARO loading of irradiation test rig=338,381,1
Fig. 3.3.19 RIA accident analysis using FEMAXI-IV=344,387,1
Fig. 3.3.20 Locked rotor accident analysis using FEMAXI-IV=345,388,1
Fig. 3.3.21 Work scopes and schedule for the 5th(이미지참조) irradiation test in HANARO=350,393,1
Fig. 3.3.22 Drawing of instrumented rig (cross section view)=355,398,1
Fig. 3.3.23 Parts of instrumented rig for the 5th(이미지참조) irradiation test=356,399,1
Fig. 3.3.24 Assembled instrumented rig for the 5th(이미지참조) irradiation test=357,400,1
Fig. 3.3.25 Remote drilling machine for drilling the center hole in a dry process pellet=359,402,1
Fig. 3.3.26 Drilling test using Al₂O₃=361,404,1
Fig. 3.3.27 Remote drilling of dry process pellet in hot cell=361,404,1
Fig. 3.3.28 Damaged pellet when drilling=362,405,1
Fig. 3.3.29 Sound pellet after drilling=362,405,1
Fig. 3.3.30 The drawing of instrumented mini-element=363,406,1
Fig. 3.3.31 (a) RT inspection of welding part (b) Cross section of Tantalum +Zircaloy welding (200x)=363,406,1
Fig. 3.3.32 Mini-element design of the 5th(이미지참조) irradiation test=366,409,1
Fig. 3.3.33 (a) Assembling of mini-element assembly in a hot cell (b) assembly=367,410,1
Fig. 3.3.34 instrumented irradiation test rig after assembling in a hot cell=369,412,1
Fig. 3.3.35 Data acquisition system of instrumented rig=370,413,1
Fig. 3.3.36 Drawing and design specification of guide tube=371,414,1
Fig. 3.3.37 Location of irradiation holes of HANARO=374,417,1
Fig. 3.3.38 Core arrangement and burnup at initial stage of 26-2 cycle (%U-235)=381,424,1
Fig. 3.3.39 Configuration of experimental holes in HANARO=384,427,1
Fig. 3.3.40 Irradiation test rig configurations=386,429,1
Fig. 3.3.41 Configuration of grapple head of irradiation test rigs=387,430,1
Fig. 3.3.42 Cross-sectional view at entrance region of grapple head=388,431,1
Fig. 3.3.43 Cross-sectional view of grid configuration=389,432,1
Fig. 3.3.44 Grid configuration of 1/6 symmetry section=390,433,1
Fig. 3.3.45 Pressure contour of 1/6 symmetry section=392,435,1
Fig. 3.3.46 Velocity contour of 1/6 symmetry section=394,437,1
Fig. 3.3.47 Fuel element linear power and coolant velocity according to transient time during reactivity insertion accident=397,440,1
Fig. 3.3.48 Fuel center and cladding outer surface temperature during reactivity insertion accident=397,440,1
Fig. 3.3.49 Fuel element linear power and coolant velocity according to transient time during locked motor accident=398,441,1
Fig. 3.3.50 Fuel center and cladding outer surface temperature during locked motor accident=399,442,1
Fig. 3.3.51 On-line measurement data of centerline temperature by DAS=404,447,1
Fig. 3.3.52 On-line measurement data of inlet/outlet temperature of coolant=405,448,1
Fig. 3.3.53 On-line measurement data of thermal neutron flux by SPND=406,449,1
Fig. 3.3.54 Profile of centerline temperature acquired during the 5th(이미지참조) irradiation est=407,450,1
Fig. 3.3.55 Centerline temperature vs. linear heat rate of rod 1=408,451,1
Fig. 3.3.56 Centerline temperature vs. linear heat rate of rod 2=408,451,1
Fig. 3.3.57 Estimation of fission gas release by Vitanza model=409,452,1
Fig. 3.3.58 Schematics of rig impeller=411,454,1
Fig. 3.3.59 Experimental system for function test of impeller=411,454,1
Fig. 3.3.60 Conceptual design of new guide tube for instrumented irradiation test at HANARO=413,456,1
Fig. 3.3.61 The remote connector for gulde tube=414,457,1
Fig. 3.3.62 Old design fOr sealing the swage lock and T/C=414,457,1
Fig. 3.3.63 New design for sealing the swage lock and T/C=414,457,1
Fig. 3.3.64 Concentration profile of precipitates of irradiated dry process fuel discharged from 2nd(이미지참조) irradiation test=421,464,1
Fig. 3.3.65 EPMA line scanning of irradiated UO₂fuel discharged from the 2nd(이미지참조) test=422,465,1
Fig. 3.3.66 EPMA line scanning of irradiated dry process fuel discharged from the 2nd test=422,465,1
Fig. 3.3.67 Precipitate close to central void (3.5㎛) (2nd(이미지참조) test)=424,467,1
Fig. 3.3.68 Precipitate at columnar grain boundary (2㎛) (2nd(이미지참조) test)=424,467,1
Fig. 3.3.69 Precipitate at large equiaxed grain boundary (1㎛) (2nd(이미지참조) test)=425,468,1
Fig. 3.3.70 Precipitate at the surface of fuel (0.5㎛) (2nd(이미지참조) test)=425,468,1
Fig. 3.3.71 Concentrtion profile of precipitates according to the position of fuel (D42:ppt. on columnar grain,D32:on large equiaxed grain,D22:equiaxed grain,Dll2:ppt. on surface of the fuel)=425,468,1
Fig. 3.3.72 Concentration profile of Mo along the radius of fuel=426,469,1
Fig. 3.3.73 Sectional view of irradiated dry process fuel (2nd(이미지참조) test)=429,472,1
Fig. 3.3.74 Overview Of microstructure of irradiated fuel (2nd(이미지참조) test)=429,472,1
Fig. 3.3.75 Estimated centerline temperature profile of dry process fuel during the 2ne(이미지참조),3rd(이미지참조) and 4th(이미지참조) irradiation tests=430,473,1
Fig. 3.3.76 Estimated grain size at the center region of dry process fuel=430,473,1
Fig. 3.3.77 Microstructure of polished surface of dry process fuel near the central void (2nd(이미지참조) test)=431,474,1
Fig. 3.3.78 Microstructure of fractured surface of dry process fuel near the central void (2nd(이미지참조) test)=431,474,1
Fig. 3.3.79 Location identification map of metallograph images=431,474,1
Fig. 3.3.80 Metallograph image of dry process fuel at DP-4OOX-O (2nd(이미지참조) test)=432,475,1
Fig. 3.3.81 Metallograph image of dry process fuel at DP-4OOX-1 (2nd(이미지참조) test)=432,475,1
Fig. 3.3.82 Metallograph image of dry process fuel at DP-4OOX-2 (2nd(이미지참조) test)=432,475,1
Fig. 3.3.83 Metallograph image of dry process fuel at DP-4OOX-3 (2nd(이미지참조) test)=432,475,1
Fig. 3.3.84 Metallograph image of dry process fuel at DP-4OOX-4 (2nd(이미지참조) test)=432,475,1
Fig. 3.3.85 Metallograph image of dry process fuel at DP-4OOX-5 (2nd(이미지참조) test)=432,475,1
Fig. 3.3.86 Metallograph image of dry process fuel at DP-4OOX-6 (2nd(이미지참조) test)=433,476,1
Fig. 3.3.87/Fig. 3.3.870 Metallograph image of dry process fuel at DP-4OOX-7 (2nd(이미지참조) test)=433,476,1
Fig. 3.3.88 Metallograph image of dry process fuel at DP-4OOX-8 (2nd(이미지참조) test)=433,476,1
Fig. 3.3.89 Metallograph image of dry process fuel at DP-4OOX-9 (2nd(이미지참조) test)=433,476,1
Fig. 3.3.90 Location identification map of SEM images=433,476,1
Fig. 3.3.91 SEM image of dry process fuel at 6-2 (2nd(이미지참조) test)=434,477,1
Fig. 3.3.92 SEM image of dry process fuel at 6-2 (2nd(이미지참조) test)=434,477,1
Fig. 3.3.93 SEM image of dry process fuel at 6-3 (2nd(이미지참조) test)=434,477,1
Fig. 3.3.94 SEM image of dry process fuel at 6-4 (2nd(이미지참조) test)=434,477,1
Fig. 3.3.95 SEM image of dry process fuel at 6-4 (2nd(이미지참조) test)=434,477,1
Fig. 3.3.96 SEM image of dry process fuel at 6-5 (2nd(이미지참조) test)=434,477,1
Fig. 3.3.97 SEM image of dry process fuel at 6-5 (2nd(이미지참조) test)=435,478,1
Fig. 3.3.98 SEM image of dry process fuel at 6-6 (2nd(이미지참조) test)=435,478,1
Fig. 3.3.99 SEM image of dry process fuel at 6-7 (2nd(이미지참조) test)=435,478,1
Fig. 3.3.100 SEM image of dry process fuel at 6-7 (2nd(이미지참조) test)=435,478,1
Fig. 3.3.101 SEM image of dry process fuel at 6-8 (2nd(이미지참조) test)=435,478,1
Fig. 3.3.102 SEM image of dry process fuel at 6-9 (2nd(이미지참조) test)=435,478,1
Fig. 3.3.103 SEM image of dry process fuel at 6-9 (2nd(이미지참조) test)=436,479,1
Fig. 3.3.104 SEM image of dry process fuel at 6-10 (2nd(이미지참조) test)=436,479,1
Fig. 3.3.105 SEM image of dry process fuel at 6-11 (2nd(이미지참조) test)=436,479,1
Fig. 3.3.106 SEM image of dry process fuel at 6-12 (2nd(이미지참조) test)=436,479,1
Fig. 3.3.107 SEM image of dry process fuel at 3-13 (2nd(이미지참조) test)=436,479,1
Fig. 3.3.108 SEM image of dry process fuel at 3-13 (2nd(이미지참조) test)=436,479,1
Fig. 3.3.109 SEM image of dry process fuel at 3-14 (2nd(이미지참조) test)=437,480,1
Fig. 3.3.110 SEM image of dry process fuel at 3-14 (2nd(이미지참조) test)=437,480,1
Fig. 3.3.111 SEM image of dry process fuel at 1-16 (2nd(이미지참조) test)=437,480,1
Fig. 3.3.112 SEM image of dry process fuel at 1-17 (2nd(이미지참조) test)=437,480,1
Fig. 3.3.113 SEM image of dry process fuel at 6-18 (2nd(이미지참조) test)=437,480,1
Fig. 3.3.114 SEM image of dry process fuel at 6-18 (2nd(이미지참조) test)=437,480,1
Fig. 3.3.115 SEM image of dry process fuel at 6-19 (2nd(이미지참조) test)=438,481,1
Fig. 3.3.116 Concentration profile of fission products of the 3rd(이미지참조) irradiation pellet=440,483,1
Fig. 3.3.117 Concentration profile of fission products of the 3rd(이미지참조) irradiation pellet=440,483,1
Fig. 3.3.118 Concentration profile of fission products of the 3rd(이미지참조) irradiation pellet=441,484,1
Fig. 3.3.119 Concentration profile of fission products of the 3rd(이미지참조) irradiation pellet (4)=441,484,1
Fig. 3.3.120 Sectional view and microstructure of irradiated pellet 3rd(이미지참조)=442,485,1
Fig. 3.3.121 Microstructure in r/r0=200㎛ (D3-01)=443,486,1
Fig. 3.3.122 Microstructure in r/r0=400㎛ (D3-02)=443,486,1
Fig. 3.3.123 Microstructure in r/r0=600㎛ (D3-03)=443,486,1
Fig. 3.3.124 Microstructure in r/r0=800㎛ (D3-04)=443,486,1
Fig. 3.3.125 Microstructure in r/r0=1000㎛ (D3-05)=443,486,1
Fig. 3.3.126 Microstructure in r/r0=1200㎛ (D3-06)=443,486,1
Fig. 3.3.127 Microstructure in r/r0=1400㎛ (D3-07)=444,487,1
Fig. 3.3.128 Microstructure in r/r0=1600㎛ (D3-08)=444,487,1
Fig. 3.3.129 Microstructure in r/r0=1800㎛ (D3-09)=444,487,1
Fig. 3.3.130 Microstructure in r/r0=2000㎛ (D3-10)=444,487,1
Fig. 3.3.131 Microstructure in r/r0=2200㎛ (D3-11)=444,487,1
Fig. 3.3.132 Microstructure in r/r0=2400㎛ (D3-12)=444,487,1
Fig. 3.3.133 Microstructure in r/r0=2600㎛ (D3-13)=445,488,1
Fig. 3.3.134 Microstructure in r/r0=2800㎛ (D3-14)=445,488,1
Fig. 3.3.135 Microstructure in r/r0=3000㎛ (D3-15)=445,488,1
Fig. 3.3.136 Microstructure in r/r0=3200㎛ (D3-16)=445,488,1
Fig. 3.3.137 Microstructure in r/r0=3400㎛ (D3-17)=445,488,1
Fig. 3.3.138 Microstructure in r/r0=3600㎛ (D3-18)=445,488,1
Fig. 3.3.139 Microstructure in r/r0=3800㎛ (D3-19)=446,489,1
Fig. 3.3.140 Microstructure in r/r0=4000㎛ (D3-20)=446,489,1
Fig. 3.3.141 Microstructure in r/r0=4200㎛ (D3-21)=446,489,1
Fig. 3.3.142 Microstructure in r/r0=4400㎛ (D3-22)=446,489,1
Fig. 3.3.143 Microstructure in r/r0=4600㎛ (D3-23)=446,489,1
Fig. 3.3.144 Microstructure in r/r0=4800㎛ (D3-24)=446,489,1
Fig. 3.3.145 Microstructure in r/r0=5000㎛ (D3-25)=447,490,1
Fig. 3.3.146 Microstructure in r/r0=5000㎛ (D3-26)=447,490,1
Fig. 3.3.147 Microstructure in r/r0=5000㎛ (D3-27)=447,490,1
Fig. 3.3.148 Microstructure in r/r0=5100㎛ (D3-28)=447,490,1
Fig. 3.3.149 EPMA line scanning of fisslon products of D4-1=450,493,1
Fig. 3.3.150 EPMA line scanning of fisslon products of D4-1=450,493,1
Fig. 3.3.151 EPMA line scanning of fisslon products of D4-1=451,494,1
Fig. 3.3.152 EPMA line scanning of D4-2=451,494,1
Fig. 3.3.153 EPMA line scanning of D4-2=452,495,1
Fig. 3.3.154 Microstructure of D4-1 (3rd(이미지참조)+4th(이미지참조) irradiation)=453,496,1
Fig. 3.3.155 Microstructure at r/r0=200㎛ (D41A-02)=454,497,1
Fig. 3.3.156 Microstructure at r/r0=400㎛ (D41A-03)=454,497,1
Fig. 3.3.157 Microstructure at r/r0=600㎛ (D41A-04)=454,497,1
Fig. 3.3.158 Microstructure at r/r0=800㎛ (D41A-05)=454,497,1
Fig. 3.3.159 Microstructure at r/r0=1000㎛ (D41A-06)=454,497,1
Fig. 3.3.160 Microstructure at r/r0=1200㎛ (D41A-07)=454,497,1
Fig. 3.3.161 Microstructure at r/r0=1400㎛ (D41A-08)=455,498,1
Fig. 3.3.162 Microstructure at r/r0=1600㎛ (D41A-09)=455,498,1
Fig. 3.3.163 Microstructure at r/r0=1800㎛ (D41A-10)=455,498,1
Fig. 3.3.164 Microstructure at r/r0=2000㎛ (D41A-11)=455,498,1
Fig. 3.3.165 Microstructure at r/r0=2200㎛ (D41A-12)=455,498,1
Fig. 3.3.166 Microstructure at r/r0=2400㎛ (D41A-13)=455,498,1
Fig. 3.3.167 Microstructure at r/r0=2600㎛ (D41A-14)=456,499,1
Fig. 3.3.168 Microstructure at r/r0=2800㎛ (D41A-15)=456,499,1
Fig. 3.3.169 Microstructure at r/r0=3000㎛ (D41A-16)=456,499,1
Fig. 3.3.170 Microstructure at r/r0=3200㎛ (D41A-17)=456,499,1
Fig. 3.3.171 Microstructure at r/r0=3400㎛ (D41A-18)=456,499,1
Fig. 3.3.172 Microstructure at r/r0=3600㎛ (D41A-19)=456,499,1
Fig. 3.3.173 Microstructure at r/r0=3800㎛ (D41A-20)=457,500,1
Fig. 3.3.174 Microstructure at r/r0=4000㎛ (D41A-21)=457,500,1
Fig. 3.3.175 Microstructure at r/r0=4200㎛ (D41A-22)=457,500,1
Fig. 3.3.176 Microstructure at r/r0=4400㎛ (D41A-23)=457,500,1
Fig. 3.3.177 Microstructure at r/r0=4600㎛ (D41A-24)=457,500,1
Fig. 3.3.178 Microstructure at r/r0=4800㎛ (D41A-25)=457,500,1
Fig. 3.3.179 Microstructure at r/r0=4900㎛ (D41A-26)=458,501,1
Fig. 3.3.180 Microstructure of D4-21=458,501,1
Fig. 3.3.181 Microstructure of SIMFUEL at r/r0=0㎛=459,502,1
Fig. 3.3.182 Microstructure of SIMFUEL at r/r0=200㎛=459,502,1
Fig. 3.3.183 Microstructure of SIMFUEL at r/r0=400㎛=459,502,1
Fig. 3.3.184 Microstructure of SIMFUEL at r/r0=600㎛=459,502,1
Fig. 3.3.185 Microstructure of SIMFUEL at r/r0=800㎛=459,502,1
Fig. 3.3.186 Microstructure of SIMFUEL at r/r0=1000㎛=459,502,1
Fig. 3.3.187 Microstructure of SIMFUEL at r/r0=1200㎛=460,503,1
Fig. 3.3.188 Microstructure of SIMFUEL at r/r0=1400㎛=460,503,1
Fig. 3.3.189 Microstructure of SIMFUEL at r/r0=1600㎛=460,503,1
Fig. 3.3.190 Microstructure of SIMFUEL at r/r0=1800㎛=460,503,1
Fig. 3.3.191 Microstructure of SIMFUEL at r/r0=2000㎛=460,503,1
Fig. 3.3.192 Microstructure of SIMFUEL at r/r0=2200㎛=460,503,1
Fig. 3.3.193 Microstructure of SIMFUEL at r/r0=2400㎛=461,504,1
Fig. 3.3.194 Microstructure of SIMFUEL at r/r0=2600㎛=461,504,1
Fig. 3.3.195 Microstructure of SIMFUEL at r/r0=2800㎛=461,504,1
Fig. 3.3.196 Microstructure of SIMFUEL at r/r0=3000㎛=461,504,1
Fig. 3.3.197 Microstructure of SIMFUEL at r/r0=3200㎛=461,504,1
Fig. 3.3.198 Microstructure of SIMFUEL at r/r0=3400㎛=461,504,1
Fig. 3.3.199 Microstructure of SIMFUEL at r/r0=3600㎛=462,505,1
Fig. 3.3.200 Microstructure of SIMFUEL at r/r0=3800㎛=462,505,1
Fig. 3.3.201 Microstructure of SIMFUEL at r/r0=4000㎛=462,505,1
Fig. 3.3.202 Microstructure of SIMFUEL at r/r0=4200㎛=462,505,1
Fig. 3.3.203 Microstructure of SIMFUEL at r/r0=4400㎛=462,505,1
Fig. 3.3.204 Microstructure of SIMFUEL at r/r0=4600㎛=462,505,1
Fig. 3.3.205 Microstructure of SIMFUEL at r/r0=4800㎛=463,506,1
Fig. 3.3.206 Microstructure of SIMFUEL at r/r0=4900㎛=463,506,1
Fig. 3.3.207 Microstructure of SIMFUEL at r/r0=5000㎛=463,506,1
Fig. 3.3.208 Microstructure of dry process fuel of D5-3=467,510,1
Fig. 3.3.209 Microstructure of dry process fuel of D5-5=467,510,1
Fig. 3.3.210 Schematic detail of T/C=467,510,1
Fig. 3.3.211 Microstructure of D5I instrumented with T/C=467,510,1
Fig. 3.3.212 Themocouple installed in D5I=467,510,1
Fig. 3.3.213 Magnified view of T/C=467,510,1
Fig. 3.3.214 Insulating material of Mg between tantalum sheath and thermoelectic wire=468,511,1
Fig. 3.3.215 Insulating material of Mg between tantalum sheath and thermoelectic wire=468,511,1
Fig. 3.3.216 Microstructure of D5I,r/r0=1.0=468,511,1
Fig. 3.3.217 Microstructure of D5I,r/r0=0.95=468,511,1
Fig. 3.3.218 Microstructure of D5I,r/r0=0.9=468,511,1
Fig. 3.3.219 Microstructure of D5I,r/r0=0.85=468,511,1
Fig. 3.3.220 Microstructure of D5I,r/r0=0.80=469,512,1
Fig. 3.3.221 Microstructure of D5I,r/r0=0.75=469,512,1
Fig. 3.3.222 Microstructure of D5I,r/r0=0.70=469,512,1
Fig. 3.3.223 Microstructure of D5I,r/r0=0.65=469,512,1
Fig. 3.3.224 Microstructure of D5I,r/r0=0.60=469,512,1
Fig. 3.3.225 Microstructure of D5I,r/r0=0.55=469,512,1
Fig. 3.3.226 Microstructure of D5I,r/r0=0.52=470,513,1
Fig. 3.3.227 Microstructure of D5I,r/r0=1.0=470,513,1
Fig. 3.3.228 Microstructure of D5I,r/r0=0.9=470,513,1
Fig. 3.3.229 Microstructure of D5I,r/r0=0.8=470,513,1
Fig. 3.3.230 Microstructure of D5I,r/r0=0.7=470,513,1
Fig. 3.3.231 Microstructure of D5I,r/r0=0.6=470,513,1
Fig. 3.3.232 Microstructure of D5I,r/r0=0.55,near to the T/C=471,514,1
Fig. 3.3.233 Microstructure of D5I,r/r0=0.55,near to the T/C=471,514,1
Fig. 3.3.234 Microstructure of D5N,r/r0=1.0=471,514,1
Fig. 3.3.235 Microstructure of D5N,r/r0=0.9=471,514,1
Fig. 3.3.236 Microstructure of D5N,r/r0=0.8=471,514,1
Fig. 3.3.237 Microstructure of D5N,r/r0=0.7=471,514,1
Fig. 3.3.238 Microstructure of D5N,r/r0=0.6=472,515,1
Fig. 3.3.239 Microstructure of D5N,r/r0=0.5=472,515,1
Fig. 3.3.240 Microstructure of fractured specimen of D5N,r/r0=0.68=472,515,1
Fig. 3.3.241 Microstructure of fractured specimen of D5N,r/r0=0.68=472,515,1
Fig. 3.3.242 Microstructure of fractured specimen of D5N,r/r0=0.68=472,515,1
Fig. 3.3.243 Microstructure of fractured specimen of D5N,r/r0=0.68=472,515,1
Fig. 3.3.244 Microstructure of fractured specimen of D5N,r/r0=0.68=473,516,1
Fig. 3.3.245 Microstructure of fractured specimen of D5N,r/r0=0.68=473,516,1
Fig. 3.3.246 Microstructure of fractured specimen of D5N,r/r0=0.68=473,516,1
Fig. 3.3.247 Microstructure of fractured specimen of D5N,r/r0=0.8=473,516,1
Fig. 3.3.248 Microstructure of fractured specimen of D5N,r/r0=0.8=473,516,1
Fig. 3.3.249 Microstructure of fractured specimen of D5N,r/r0=0.8=473,516,1
Fig. 3.3.250 Microstructure of fractured specimen of D5N,r/r0=1.0=474,517,1
Fig. 3.3.251 Power history of NRU irradiation test=475,518,1
Fig. 3.3.252 Axial gamma-scanning of BB03 fuel element=476,519,1
Fig. 3.3.253 Transverse view of BB03 fuel element=476,519,1
Fig. 4.1.1 R&D strategy of Phase I=480,523,1
Fig. 4.1.2 R&D schedule and structure of Phase I=482,525,1
*표시는 필수 입력사항입니다.
| 전화번호 |
|---|
| 기사명 | 저자명 | 페이지 | 원문 | 기사목차 |
|---|
| 번호 | 발행일자 | 권호명 | 제본정보 | 자료실 | 원문 | 신청 페이지 |
|---|
도서위치안내: / 서가번호:

우편복사 목록담기를 완료하였습니다.
*표시는 필수 입력사항입니다.
저장 되었습니다.
