
 대표어
대표어
권호기사보기
| 기사명 | 저자명 | 페이지 | 원문 | 기사목차 |
|---|
결과 내 검색
동의어 포함
목차
표제지=0,1,1
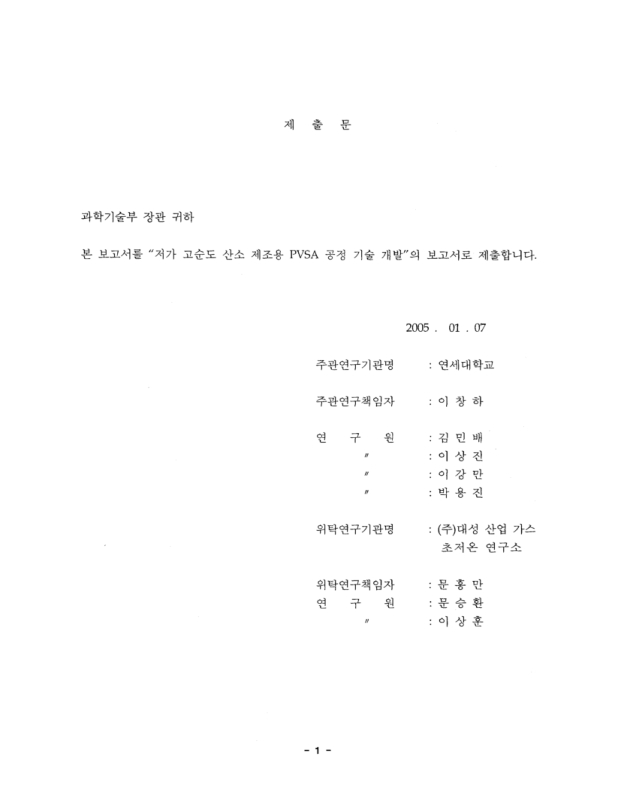
제출문=1,2,1
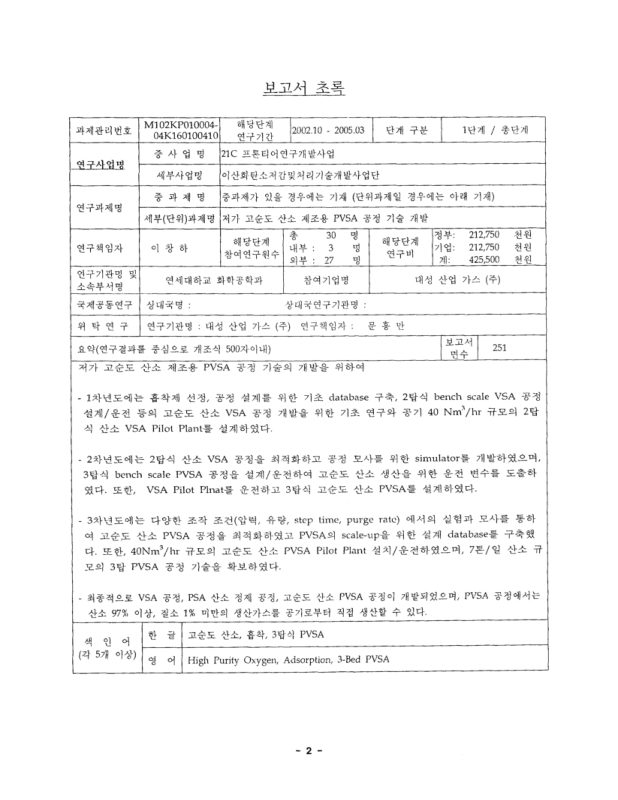
보고서 초록/이창하=2,3,1
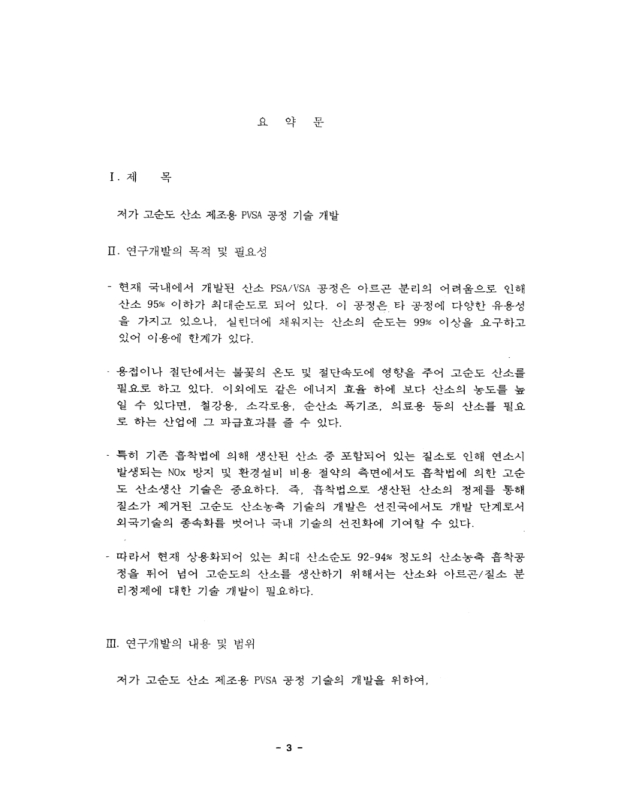
요약문=3,4,4
SUMMARY=7,8,5
CONTENTS=12,13,2
목차=14,15,2
표목차=16,17,2
그림목차=18,19,7
제1장. 연구개발의 필요성=25,26,1
1절. 기술적 측면=25,26,5
2절. 경제ㆍ산업적 측면=30,31,2
3절. 사회 문화적 측면=32,33,2
제2장. 국내외 기술개발 현황=34,35,1
1절. 국내의 기술개발 현황=34,35,2
2절. 국외의 기술개발 현황=35,36,2
제3장. 연구개발수행 내용 및 결과=37,38,2
1절. CMS에 대한 질소,산소,아르곤의 흡착 평형과 속도 현상에 대한 연구=39,40,18
2절. 제올라이트 10X에 대한 질소,산소,아르곤의 흡착 평형에 대한 연구=57,58,9
3절. PSA 공정과 VSA 공정을 위한 파괴 및 탈착 동특성 실험=66,67,24
4절. 제올라이트 10X와 13X를 이용한 공기 분리의 VSA 공정=90,91,25
5절. CMS를 이용한 산소 정제의 PSA 공정=115,116,40
6절. 공기로부터 고순도 산소를 제거하기 위한 3탑 PVSA 공정 개발=155,156,30
7절. 위탁 기관의 연구개발수행 내용 및 결과[원본불량;p.194~195]=185,186,12
제4장. 목표달성도 및 관련분야에의 기여도=197,198,1
1절. 연구개발의 목표 및 내용=197,198,1
2절. 연구평가의 착안점 및 척도=198,199,2
3절. 기여도=200,201,5
제5장. 연구개발결과의 활용게획=205,206,1
1절. 산소 PSA의 비교=205,206,5
2절. 산소 PSA 실증화 플랜트 제작=209,210,4
3절. 연구 활용 방안=212,213,3
제6장. 연구개발과정에서 수집한 해외과학기술정보=215,216,1
1절. 국내외 가스 산업 현황=215,216,2
2절. 일본 산소 PSA 시장 동향=216,217,3
3절. 그 외의 해외 기업들=218,219,3
4절. 해외 논문들=220,221,2
5절. 해외 특허들=221,222,5
제7장. 참고문헌=226,227,4
특정연구개발사업 연구결과 활용계회서=230,231,21
영문목차
[title page etc.]=0,1,12
CONTENTS=12,13,13
Chapter1. Needs of Research and Development=25,26,1
Section1. Technical Viewpoint=25,26,5
Section2. Economical and Industrial Viewpoint=30,31,2
Section3. Social and Cultural Viewpoint=32,33,2
Chapter2. Domestic and foreign R&D Status=34,35,1
SEction1. Domestic R&D Status=34,35,2
SEction2. Foreign R&D Status=35,36,2
Chapter3. Contents and Results of R&D Study=37,38,2
Section1. Adsorption Equilibrium and Kinetics of N₂,O₂,Ar on CMS=39,40,18
Section2. Adsorption Equilibrium of N₂,O₂,Ar on Zeolite 10X=57,58,9
Section3. Adsorption and Desorption Dynamics of PSA/VSA Processes=66,67,24
Section4. VSA Processes for Air Separation using Zeolite 10X and 13X=90,91,25
Section5. PSA Processes to Purity Oxygen using CMS=115,116,40
Section6. Three-bed PVSA Process for High Purity Oxygen Generation from Ambient Air=155,156,30
Section7. Results of Daesung Industrial Gas=185,186,12
Chapter4. Achievements & Contribution to Various Fields=197,198,1
Section1. Goals and Contents of R&D=197,198,1
Section2. Points and Criteria of R&D Evaluation=198,199,2
Section3. Contribution=200,201,5
Chapter5. Utilizing Plan of R&D Results=205,206,1
Section1. Comparison of Oxygen-PSAs=205,206,5
Section2. Oxygen-PSA Pilot Plant=209,210,4
Section3. Utilizing Plan=212,213,3
Chapter6. Foreign Technical Informatioms Obtained from R&D Period=215,216,1
Section1. Domestic & Foreign Gas Industry=215,216,2
Section2. Oxygen-PSA Market of Japan=216,217,3
Section3. Foreign Companies=218,219,3
Section4. Related Foreign Papers=220,221,2
Section5. Related Foreign Patents=221,222,5
Chapter7. References=226,227,25
그림1.1 유효 산소량에 따른 산소생산기의 상대적 비교=27,28,1
그림1.2 미국과 유럽의 산소 시장 비교=31,32,1
그림1.3 일본 산소 시장의 추이=31,32,1
그림1.4 Comparison between air-blown combustion and oxygen-blown combustion in glass melting=33,34,1
그림3.1 1단계와 2단계 추진 계획=38,39,1
그림3.2 실험장치 모식도=41,42,1
그림3.3 CMS에 대한 흡착 등온선의 온도 및 농도 의존서:(a)산소,(b)질소,(c)아르곤=52,53,1
그림3.4 CMS에 대한 흡착속도 실험에서 질소,산소,아르곤의 시간에 따른 로딩셀의 무차원 입력변화=53,54,1
그림3.5 303K에서 산소에 대한 흡착속도상수의 입력 의존성:(a) Darken 모델들에 의한 예측 (b) Structural 모델들에 의한 예측=54,55,1
그림3.6 303K에서 산소에 대한 흡착속도상수의 입력 의존성과 supercritical-structural 모델들에 의한 예측=55,56,1
그림3.7 세 온도 조건에서 (a)질소,(b)산소,(c)아르곤에 대한 흡착속도상수의 압력 의존성과 supercritical-structural-Langmuir 모델에 의한 예측=56,57,1
그림3.8 BDDT 분류에 따른 여섯가지의 흡착 등온 곡선=60,61,1
그림3.9 Experimental apparatus for adsorption rate and equilibrium on adsorbent=61,62,1
그림3.10 Zeolite 10X Isotherm of three gases in 293.15K=62,63,1
그림3.11 Zeolite 10X Isotherm of Ar in three Temperature=63,64,1
그림3.12 Zeolite 10X Isotherm of O₂ in three Temperature=64,65,1
그림3.13 Zeolite 10X Isotherm of N2 in three Temperature=65,66,1
그림3.14 Relation between breakthrough curve and internal profile=76,77,1
그림3.15 Schematic diagram of apparatus for breakthrough experiment=76,77,1
그림3.16 Breakthroung curves of a zeolite 10X bed under 2atm adsorption Pressure=82,83,1
그림3.17 Breakthroung curves of a zeolite 10X bed under 3.5atm adsorption Pressure=83,84,1
그림3.18 Breakthroung curves of a zeolite 10X bed under 5atm adsorption Pressure=84,85,1
그림3.19 Temperature breakthroung curves of a zeolite 10X bed under 3.5atm adsorption pressure and 4LSTP/min. floe rate=85,86,1
그림3.20 Desorption curves of a zeolite 10X bed under 2atm adsorption pressure=86,87,1
그림3.21 Desorption curves of a zeolite 10X bed under 3.5atm adsorption pressure=87,88,1
그림3.22 Desorption curves of a zeolite 10X bed under 5atm adsorption pressure=88,89,1
그림3.23 Teperature desorption curves of a zeolite 10X bed under 2atm desorption pressure and 4LSTP/min. flow rate=89,90,1
그림3.24 Schematic diagram of apparatus for a two-bed O₂ VSA process=98,99,1
그림3.25 Adsorption isotherms of O₂,N₂ and Ar on (a) zeolite 10X and (b) zeolite 13X at 293.15K=104,105,1
그림3.26 Experimental and simulated temperature curves of zeolite 10X and 13X beds at the position of (a) 10cm,(b) 50cm,and (c) 80cm from the feed end at 1.8atm and 1.3LSTP/min=105,106,1
그림3.27 Cyclic variation of experimental and simulated O₂ purity of zeolite 10X and 13X beds at 1.8atm and 1.3LSTP/min=106,107,1
그림3.28 The pressure variayion anf regression profile from ambient to vaccum pressure in the beds packed with zeolite 10X or 13X=107,108,1
그림3.29 Effect of adsorption srep time on the (a) O₂ purity and (b) O₂ recovery,and (c) pressure variation profile during vacuum step=108,109,1
그림3.30 O₂ concentration profile along the bed during AD step at various adsorption step times=109,110,1
그림3.31 Effect of pressurization step time on the (a) O₂ purity and (b)O₂ recovery and (c) pressure variation profile during vacuum step=110,111,1
그림3.32 O₂ concentration profile along the bed during PR step at various adsorption step times=111,112,1
그림3.33 Effect of pressure equalization step time on the (a) O₂ purity and (b) O₂ recovery=112,113,1
그림3.34 O₂ concentration profile along the bed during DPE and PPE steps at various adsorption step times=113,114,1
그림3.35 Effect of feed flow rate on the (a) O₂ purity and (b) O₂ recovery=114,115,1
그림3.36 Schematic diagram of apparatus for a two-bed PSA process=118,119,1
그림3.37 Oxygen concentration of (a) breakthriugh and (b) desorption curves at 335 kPa adsorption pressure,4 LSTP/min feed flow rate. and 101 kpadesorption pressure. (Feed:O2/Ar-95:5 vol.%)=130,131,1
그림3.38 Variations of O₂ concentration,flow rate,and pressure insidethe bed at blowdown step after breakthrough experiment at 355 kPa adsorption pressure and 4LSTP/min feed flow rate=131,132,1
그림3.39 Experimental and predicted temperature curves of process 111(Run 3 and model 4) at the position of (a) 10cm,(b) 50cm,and (c) 80cm from the feed end at 506.6kPa and 4 LSTP/min=132,133,1
그림3.40 Variations of flow rate at bloedown step of four different processes=133,134,1
그림3.41 Experimental and predicted cyclic performances at 506.6 kPaand 4LSTP/min:(a) process I(Run 1),(b) process II (Run 2),(c) process III (Run 3),and (d) process IV (Run 4)=134,135,1
그림3.42 Comparisons of O₂ concentration at adsorption step among four different PSA processes (Run 1 to Run 4) at 506.6 kPa and 4LSTP/min=135,136,1
그림3.43 Prediction O2concentration profiles in the gas phase at each step pf four processes (Run 1 to Run 4) at 506.6 kPa and 4 LSTP/min * (-) in velocity means the countercurrent direction of flow=136,137,1
그림3.45 Effect of nitrogencomposition in feed gas on (a) O₂ purity,and (b) O₂ recovery at 506.6 kPa and 4 LSTP/min in process I=137,138,1
그림3.44 Effect of nitrogencomposition in feed gas on (a) O₂ purity,and (b) O₂ recovery at 506.6 kPa and 4 LSTP/min in process II=138,139,1
그림3.46 Gas phase concentration and temperature profiles along the bed in process III (Run 6):(a) AD,(d) BD1,and (c) BD2 steps at the feed condition of ternary 2=139,140,1
그림3.47 Gas phase concentration and temperature profiles along the bed in process IV (Run 8):(a) AD,(d) DPE,and (c) BD steps at the feed condition of ternary 2=140,141,1
그림3.48 Effect of (a) PR and (b) AD step times on the O₂ purity and recovery at 5atm and 4LSTP/min in case of procedd III. (lower nitrogen feed)=147,148,1
그림3.49 Effect of (a) adsorption pressur and (b) feed flow rate on the O₂ purity in case of (lower nitrogen feed)=148,149,1
그림3.50 Effects of (a) AD step time and (b) feed flow rate on the O₂ purity and recovery in case of (higher nitrogen feed)=149,150,1
그림3.51 Effects of (a) AD step time,and (b) feed flow rate on the gas and adsorbed phase O₂ concentration and axial temperature along the bed at the end of AD and BD1 steps in the condition of (a) 5atm and 4LSTP/min,and (b) 5atm and 15sec AD step time.=150,151,1
그림3.52 Effects of (a) AD step time,and (b) feed flow rate on the gas and adsorbed phase 02concentration and axial temperature along the bed at the end of AD and BD1 steps in the condition of (a) 5atm and 4LSTP/min,and (b) 5atm and 15sec AD step time.=151,152,1
그림3.53 3-D plots of (a) O₂ purity and (b) O₂ recovery to the variation of AD step times and feed flow rate in case of process III.(higher nitrogen feed)=152,153,1
그림3.54 AD step time and feed flow rate to obtain 99%purity oxygen at 5atm adsorption pressure and various feed conditions.(All of the step times except ADstep were same as base condition)=153,154,1
그림3.55 Efeect of N₂ impurity in feed gas on the (a) O₂ recovery,(a)-1 maximum recovery,(b) O2 productivity,and (b)-1 maximum productivity at various AD step time and feed flow rate. (The other operating variables were fixed as those of base condition=154,155,1
그림3.56 Schematic diagram of apparatus for a three-bed PVSA process=170,171,1
그림3.57 Pressure variation profiles of (a)zeolite 10X (b) CMS beds in the cyclic of PVSA 97%O₂generation at base operating condition (Run 1)=171,172,1
그림3.58 Temperature variation curves at the position of 10 cm from the feed inlet in (a) zeolite 10X and (b) CMS bed ta base operating condition=172,173,1
그림3.59 Cyclic variation of O₂ purity and Ar/N₂ impurities produced from the BD step of CMS bed during the cyclic operation of PVSA I at base operating condition=173,174,1
그림3.60 Simulated O₂ concentration profiles in the gas phase at (a) PR,(b) AD,(c) DPE,(d) VU,(e) BF,and (f) PPE steps of zeolite 10X bed during the PVSA I operation at base operating condition (Run 1)=174,175,1
그림3.61 Simulated O₂ concentration profiles in the gas phase at (a) PR,(b) AD,(c) ID,and (d) BD steps of CMS bed during the PVSA I operation at base operating condition (Run 1)=175,176,1
그림3.62 Effects of PR anf AD times of CMS bed on (a) O₂ purity and (b) O₂ recovery at base adsorption pressure and base feed flow rate condition (Runs 1 to 3)=176,177,1
그림3.63 Axial concentration profiles along the bed in the gas phase at the end of (a) BF step of zeolite 10X bed and (b) AD step of CMS bed at base adsorption pressure and base feed flow rate condition (Runs 1 to 3)=177,178,1
그림3.64 Pressure variation profiles of (a) zeolite 10X and (b) CMS beds in the cyclic operation of PVSA process for 99% O₂ generation at base operating condition (Run 4)=178,179,1
그림3.65 Cyclic variation of O₂ purity and Ar/N2 impurities produced from BD2 step of CMS bed during the cyclic PVSA operation for 99% O₂ generation at base operating condition (Run 4)=179,180,1
그림3.66 Simulated O₂ concentration profiles in the gas phase at (a) PR,(b) AD,(c) DPE,(d) VU,(e) BF,and (f) PPE steps of zeolite 10X bed during the PVSA II operation at base operating condition (Run 4)=180,181,1
그림3.67 Simulated O₂ concentration profiles in the gas phase at (a) PR,(b) AD,(c) ID,and (d) BD steps of CMS bed during the PVSA II operation at base operating condition (Run 4)=181,182,1
그림3.68 Effects of PR anf AD times of CMS bed on (a) O₂ purity and (b) O₂ recovery at base adsorption pressure and base feed flow rate condition (Runs 4 to 6)=182,183,1
그림3.69 Axial gas phase concentration profiles along the bed at the end of (a) BFI and (b) BF2 steps of zeolite 10X bed at base adsorption pressure and base feed flow rate condition (Runs 4 to 6). *(BF2 step time was fixed to 10sec)=183,184,1
그림3.70 Axial gas phase concentration profiles along the bed at the end of (a) BDI and (b) BD2 steps of CMS bed at base adsorption pressure and base feed flow rate condition (Runs 4 to 6). *(BD1 and BD2 step time were fixed to 10sec and 30sec,respective=184,185,1
그림3.71 ASU plant(신랭법) 전경=185,186,1
그림3.72 산소 VSA 배치도=186,187,1
그림3.73 질소 PSA 모습=186,187,1
그림3.74 산소 발생기용 알루미나(左)와 ZMS(右)=187,188,1
그림3.75 고순도 산소 발생기 Flow Diagram=188,189,1
그림3.76 고순도 산소 PVSA Pilot-plant=191,192,1
그림3.77 산소 분석기(0~96%)=191,192,1
그림3.78 2탑식 산소 PVSA P&ID=192,193,1
그림3.79 자동 Data Acquisition System=192,193,1
그림3.80 Pilotplant Touch screen 화면=193,194,1
그림3.81 Pilot plant 생산 순도(Product탑의 순도)=194,195,1
그림3.82 Pilot plant 생산 순도(최고 생산순도(左)와 Product탑(右)의 순도)=195,196,1
그림3.83 93% O2를 생산할 때,저장된 data 값=195,196,1
그림3.84 Data acquisition에 저장된 data 값=196,197,1
그림3.85 3탑식 산소 발생기 Flow diagram=196,197,1
그림4.1 PSA apparatus for high purity oxygen (Sumitomo Procedd)=202,203,1
그림5.1 활용 방안 도식화=214,215,1
그림6.1 일본 시장에서 100 Nm3/h 이상 산소PSA의 출하 변화율=216,217,1
그림6.2 일본 시장에서 10 Nm3/h 이상 산소PSA의 출하 변화율=217,218,1
그림6.3 국가별,출원인별 특허 건수=220,221,1
| 등록번호 | 청구기호 | 권별정보 | 자료실 | 이용여부 |
|---|---|---|---|---|
| T000002729 | 전자형태로만 열람가능함 | 이용불가 |
*표시는 필수 입력사항입니다.
| 전화번호 |
|---|
| 기사명 | 저자명 | 페이지 | 원문 | 기사목차 |
|---|
| 번호 | 발행일자 | 권호명 | 제본정보 | 자료실 | 원문 | 신청 페이지 |
|---|
도서위치안내: / 서가번호:

우편복사 목록담기를 완료하였습니다.
*표시는 필수 입력사항입니다.
저장 되었습니다.
