
 대표어
대표어


권호기사보기
| 기사명 | 저자명 | 페이지 | 원문 | 기사목차 |
|---|
결과 내 검색
동의어 포함
목차
표제지=0,1,1
제출문=0,2,1
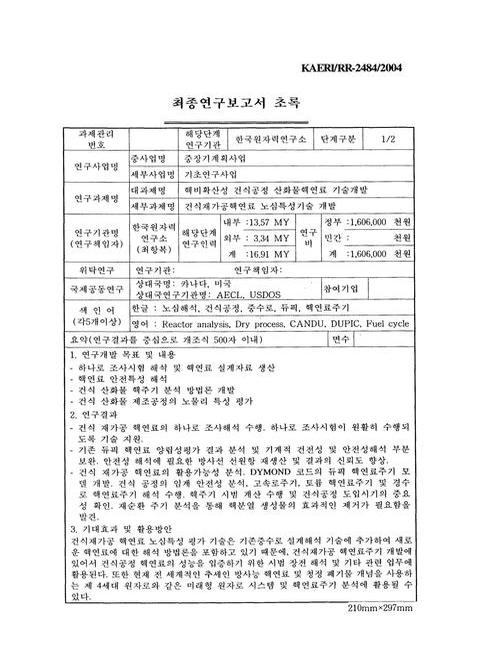
최종연구보고서 초록/최항복=0,3,1
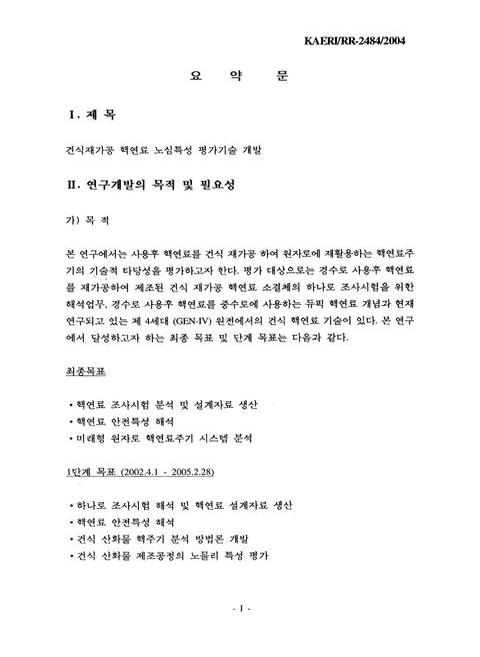
국문요약=I,4,10
영문요약=XII,14,11
CONTENTS=XXII,25,5
목차=XXVII,30,5
표목차=XXXII,35,5
그림목차=XXXVII,40,10
제1장. 서론=1,50,4
1.1 연구개발의 필요성=4,53,3
1.2 연구개발의 목적 및 범위=6,55,3
1.3 국내외 기술개발 현황=9,58,1
1.3.1 외국의 경우=10,59,2
1.3.2 국내의 경우=11,60,2
1.3.3 연구개발 사례에 대한 자체분석 및 평가결과=12,61,2
1.4 세부 기술사항의 검토분석 결과=13,62,1
1.4.1 외국의 경우=13,62,3
1.4.2 국내의 경우=15,64,2
1.5 참고문헌=17,66,6
제2장. 하나로 조사시험 해석 및 설계자료 생산=23,72,3
2.1 하나로 조사시험 해석=25,74,2
2.1.1 제 3차 하나로 조사시험=26,75,4
2.1.2 제 4차 하나로 조사시험=29,78,2
2.1.3 제 5차 조사시험 노물리 특성=31,80,3
2.1.4 제 5차 조사시험 리그 유동 특성=33,82,5
2.1.5 요약=37,86,21
2.2 핵연료 설계 해석=58,107,1
2.2.1 핵연료 설계 요건=58,107,3
2.2.2 듀픽 핵연료의 설계 특성=60,109,2
2.2.3 듀픽 핵연료 물성 모델=61,110,4
2.2.4 핵연료 관리방안에 대한 양립성=64,113,3
2.2.5 듀픽 핵연료의 기계적 성능=66,115,4
2.2.6 듀픽 핵연료 다발의 열수력 성능=69,118,33
2.3 참고문헌=102,151,5
제3장. 핵연료 안전특성 해석=107,156,3
3.1 제2정지계통 액상 독물질 주입모델 개발 및 검증해석=109,158,1
3.1.1 ALITRIG 독물질 제트 성장 모델=110,159,4
3.1.2 생성항을 이용한 모델링=113,162,1
3.1.3 액상 독물질 주입실험에 대한 검증해석=114,163,5
3.2 핵연료 온도해석 방법론 예비 분석=119,168,1
3.2.1 중성자속 감쇄 모델=119,168,1
3.2.2 열전도도 모델=120,169,10
3.3 방사선 선원항 계산=130,179,1
3.3.1 핵분열 생성물의 특성=130,179,2
3.3.2 방사선원 계산=132,181,27
3.4 사고 해석=159,208,1
3.4.1 원자로 안전성 설계 요건 검토=159,208,2
3.4.2 해석 방법 및 가정=160,209,3
3.4.3 냉각재 상실 사고 해석=162,211,3
3.4.4 핵연료 건전성 분석=165,214,20
3.5 참고문헌=185,234,2
제4장. 건식 산화물 핵주기 분석 방법론 개발=187,236,3
4.1 미래형 핵주기 기술현황 분석=189,238,2
4.1.1 비순환 주기=190,239,3
4.1.2 부분 재순환 주기=192,241,1
4.1.3 전체 재순환 주기=192,241,2
4.1.4 모든 악티나이드 재순환 주기=193,242,1
4.2 미래 핵연료 특성 분석=194,243,1
4.2.1 열중성자로 핵연료=194,243,4
4.2.2 고속로 핵연료=197,246,3
4.3 핵주기 분석 방법론 연구=200,249,1
4.3.1 DYMOND 코드 분석=200,249,3
4.3.2 제4세대 원전 계획에서의 듀픽 핵연료 주기 분석=202,251,3
4.3.3 제4세대 원전 고속로 주기 분석=204,253,23
4.4 한국 핵주기 특성 분석=227,276,1
4.4.1 DYMOND 코드 수정=227,276,3
4.4.2 비순환 주기 모형 해석=229,278,2
4.4.3 듀픽 핵연료주기 분석=230,279,1
4.4.4 금속 핵연료 소듐 고속로 주기 분석=231,280,2
4.4.5 산화물 핵연료 소듐 고속로 주기 분석=232,281,54
4.5 요약=286,335,2
4.6 참고 문헌=288,337,1
제5장. 건식 산화물 제조공정의 노물리 특성 평가=289,338,3
5.1 재순환 핵연료 제조공정 기술현황 분석=291,340,3
5.1.1 불화물 휘발공정=293,342,1
5.1.2 고온용융염 전해공정=294,343,1
5.1.3 AIROX 공정=294,343,2
5.1.4 듀픽 공정=295,344,4
5.2 건식 산화물 제조공정의 핵임계 안전성 평가=299,348,1
5.2.1 핵임계 계산 모델=299,348,2
5.2.2 듀픽 핵연료=300,349,2
5.2.3 토륨 재순환 핵연료=301,350,3
5.2.4 소듐 고속로 산화물 핵연료=303,352,23
5.3 참고문헌=326,375,3
제6장. 제4세대 원자로 노령 검토 및 활용성 평가=329,378,3
6.1 제4세대 원자로 노형 개념 및 기준 검토=331,380,1
6.1.1 기체냉각 고속로=331,380,3
6.1.2 납냉각 고속로=333,382,3
6.1.3 용융염 냉각로=335,384,2
6.1.4 소듐냉각 고속로=336,385,2
6.1.5 초임계수 냉각로=337,386,3
6.1.6 초고온 원자로=339,388,17
6.2 소듐냉각 고속로 예비 분석=356,405,1
6.2.1 소듐냉각 고속로 기술 현황=357,406,2
6.2.2 소듐냉각 고속로 기준노심=358,407,3
6.2.3 소듐냉각 고속로 평형노심=360,409,7
6.2.4 핵분열 생성물 제거에 따른 노심특성=367,416,27
6.3 납냉각 고속로 예비 분석=394,443,1
6.3.1 납냉각 고속로 기술 현황=394,443,3
6.3.2 납냉각 고속로 평형노심=396,445,5
6.3.3 핵분열 생성물 제거에 따른 노심특성=400,449,18
6.4 가스냉각 고속로 예비 분석=418,467,1
6.4.1 가스냉각 고속로 기준노심=418,467,3
6.4.2 가스냉각 고속로 재순환=420,469,3
6.4.3 핵분열 생성물 제거에 따른 노심특성=422,471,10
6.5 건식공정 핵연료 중수로 분석=432,481,1
6.5.1 신형 중수로 예비 분석=432,481,2
6.5.2 중수로 토륨 핵연료 분석 모델=433,482,5
6.5.3 토륨/우라늄 균질 핵연료 재순환 예비 분석=437,486,6
6.5.4 토륨/듀픽 비균질 핵연료 재순환 예비 분석=442,491,3
6.5.5 핵분열 생성물 제거에 따른 노심특성=444,493,48
6.6 건식공정 핵연료 경수로 분석=492,541,1
6.6.1 경수로 핵연료 모델=492,541,2
6.6.2 경수로 핵연료 기준계산=493,542,3
6.6.3 핵분열 생성물 제거에 따른 노심특성=495,544,15
6.7 요약 및 향후업무=510,559,3
6.8 참고 문헌=513,562,6
제7장. 연구개발 목표 달성도 및 향후업무=519,568,3
7.1 연구개발 목표 달성도=521,570,1
7.1.1 세부연구 목표별 주요 실적=521,570,3
7.1.2 세부연구 목표별 요약 및 의견=523,572,2
7.1.3 연구 성과물=524,573,8
7.2 향후 업무 계획=532,581,1
7.2.1 연구개발 결과 활용방안=532,581,1
7.2.2추가 연구 항목=532,581,5
영문목차
[title page etc.]=0,1,2
PREFACE=0,3,1
SUMMARY(KOREAN)=I,4,10
SUMMARY(ENGLISH)=XI,14,11
CONTENT=XXII,25,10
TABLE CONTENT=XXXII,35,5
FIGURE CONTENT=XXXVII,40,10
CHAPTER 1. INTRODUCTION=1,50,4
1.1 Purpose of Project=4,53,3
1.2 Objectives and Scope=6,55,3
1.3 Current Status of the Technology Development=9,58,1
1.3.1 Foreign technology=10,59,2
1.3.2 Domestic technology=11,60,2
1.3.3 Review of technology development cases=12,61,2
1.4 Review of the Detailed Technology Items=13,62,1
1.4.1 Foreign technology=13,62,3
1.4.2 Domestic technology=15,64,2
1.5 References=17,66,6
CHAPTER 2. ANALYSIS OF THE IRRADIATION TEST IN HANARO AND GENERATION OF FUEL DESIGN DATA=23,72,3
2.1 Analysis of the Fuel Irradiation Test in HANARO=25,74,2
2.1.1 3rd irradiation test in HANARO=26,75,4
2.1.2 4th irradiation test in HANARO=29,78,2
2.1.3 5th irradiation test reactor physics characteristics=31,80,3
2.1.4 5th irradiation test rig flow-induced characteristics=33,82,5
2.1.5 Summary=37,86,21
2.2 Fuel Design Analysis=58,107,1
2.2.1 Fuel design requirements=58,107,3
2.2.2 DUPIC fuel design characteristics=60,109,2
2.2.3 DUPIC fuel material property=61,110,4
2.2.4 Compatibility with the fuel management strategy=64,113,3
2.2.5 Mechanical performance of the DUPIC fuel=66,115,4
2.2.6 Thermal-hydraulic performance of the DUPIC fuel bundle=69,118,33
2.3 References=102,151,5
CHAPTER 3. ANALYSIS OF THE FUEL SAFETY CHARACTERISTICS=107,156,3
3.1 Validation of the Shutdown System 2 Liquid Poison Injection Model=109,158,1
3.1.1 ALITRIG liquid poison injection model=110,159,4
3.1.2 Source term model of the liquid poison injection=113,162,1
3.1.3 Validation of the liquid poison injection model=114,163,5
3.2 Fuel Temperature Calculation Model=119,168,1
3.2.1 Flux depression model=119,168,1
3.2.2 Thermal conductivity model=120,169,2
3.2.3 Fuel centerline temperature=122,171,8
3.3 Radiation Source Term Calculation=130,179,1
3.3.1 Characteristics of the fission products=130,179,2
3.3.2 Source term calculation of the DUPIC fuel core=132,181,27
3.4 Accident Analysis=159,208,1
3.4.1 Reactor safety design requirements=159,208,2
3.4.2 Analysis method and assumptions=160,209,3
3.4.3 Loss of coolant accident analysis=162,211,3
3.4.4 Fuel integrity analysis=165,214,20
3.5 References=185,234,2
CHAPTER 4. DRY OXIDE FUEL CYCLE ANALYSIS METHOD=187,236,3
4.1 Current Status of Future Nuclear Fuel Cycle Development=189,238,2
4.1.1 Once-through fuel cycle=190,239,3
4.1.2 Partial recycle=192,241,1
4.1.3 Full recycle=192,241,2
4.1.4 All actinides recycle=193,242,1
4.2 Characteristics of the Future Nuclear Fuel=194,243,1
4.2.1 Thermal reactor fuel=194,243,4
4.2.2 Fast reactor fuel=197,246,3
4.3 Fuel Cycle Analysis Method Development=200,249,1
4.3.1 DYMOND code analysis=200,249,3
4.3.2 DUPIC fuel cycle in the Generation-IV roadmap=202,251,3
4.3.3 Fast reactor fuel cycle in the Generation-IV roadmap=204,253,23
4-4 Korean Nuclear Fuel Cycle Study=227,276,1
4.4.1 DYMOND code modification=227,276,3
4.4.2 Once-through fuel cycle model analysis=229,278,2
4.4.3 DUPIC fuel cycle analysis=230,279,1
4.4.4 Metal fuel sodium-cooled fast reactor fuel cycle analysis=231,280,2
4.4.5 Oxide fuel sodium-cooled fast reactor fuel cycle analysis=232,281,54
4.5 Summary=286,335,2
4.6 References=288,337,1
CHAPTER 5. PHYSICS STUDY OF THE DRY OXIDE FUEL FABRICATION PROCESS=289,338,3
5.1 Current Status of the Recycling Fuel Fabrication Process=291,340,3
5.1.1 Fluoride voloxidation process=293,342,1
5.1.2 Pyro-electrical process=294,343,1
5.1.3 AIROX process=294,343,2
5.1.4 DUPIC process=295,344,4
5.2 Criticality Analysis of the Dry Oxide Fuel Fabrication Process=299,348,1
5.2.1 Criticality analysis model=299,348,2
5.2.2 DUPIC fuel=300,349,2
5.2.3 Thorium recycling fuel=301,350,3
5.2.4 Sodium-cooled fast reactor oxide fuel=303,352,23
5.3 References=326,375,3
CHAPTER 6. REVIEW OF THE GENERATION-IV REACTORS AND THE APPLICABILITY OF THE DRY PROCESS=329,378,3
6.1 Review of the GEN-IV Reactor Concept and Standards=331,380,1
6.1.1 Gas-cooled fast reactor=331,380,3
6.1.2 Lead-cooled fast reactor=333,382,3
6.1.3 Molten-salt reactor=335,384,2
6.1.4 Sodium-cooled fast reactor=336,385,2
6.1.5 Super critical water reactor=337,386,3
6.1.6 Very high temperature reactor=339,388,17
6.2 Review of the Sodium-Cooled Fast Reactor=356,405,1
6.2.1 Current status of the technology development=357,406,2
6.2.2 Sodium-cooled fast reactor reference core=358,407,3
6.2.3 Sodium-cooled fast reactor equilibrium core=360,409,7
6.2.4 Effect of the fission products removal on the core characteristics=367,416,27
6.3 Review of the Lead-Cooled Fast Reactor=394,443,1
6.3.1 Current status of the technology development=394,443,3
6.3.2 Lead-cooled fast reactor equilibrium core=396,445,5
6.3.3 Effect of the fission products removal on the core characteristics=400,449,18
6.4 Review of the Gas-Cooled Fast Reactor=418,467,1
6.4.1 Gas-cooled fast reactor reference core=418,467,3
6.4.2 Gas-cooled fast reactor recycling=420,469,3
6.4.3 Effect of the fission products removal on the core characteristics=422,471,10
6.5 Dry Process Fuel Heavy Water Reactor=432,481,1
6.5.1 Advanced CANDU reactor=432,481,2
6.5.2 Thorium fuel HWR analysis model=433,482,5
6.5.3 Thorium/uranium homogeneous fuel recycling analysis=437,486,6
6.5.4 Thorium/DUPIC heterogeneous fuel recycling analysis=442,491,3
6.5.5 Effect of the fission products removal on the core characteristics=444,493,48
6.6 Dry Process Fuel Pressurized Water Reactor=492,541,1
6.6.1 PWR fuel model=492,541,2
6.6.2 PWR fuel reference composition=493,542,3
6.6.3 Effect of the fission products removal on the core characteristics=495,544,15
6.7 Summary and Future Works=510,559,3
6.8 References=513,562,6
CHAPTER 7. ACHIEVEMENT OF THE RESEARCH OBJECTIVES AND FUTURE WORKS=519,568,3
7.1 Achievement of the Research Objectives=521,570,1
7.1.1 Major achievement for detailed research objectives=521,570,3
7.1.2 Summary and suggestions for detailed research objectives=523,572,2
7.1.3 Research products=524,573,8
7.2 Future Research Plan=532,581,1
7.2.1 Application of the research results=532,581,1
7.2.2 Additional research items=532,581,5
Figure 2.1-1 Fuel arrangement and burnup at the initial stage of 10-1-3 cycle (%235U(이미지참조))=49,98,1
Figure 2.1-2 Fuel arrangement and burnup at the initial stage of 26-2 cycle (%235U(이미지참조))=50,99,1
Figure 2.1-3 Irradiation test rig configurations=51,100,1
Figure 2.1-4 Grapple head configurations for the irradiation test rigs=52,101,1
Figure 2.1-5 Cross-sectional view of the grapple head at the entrance=53,102,1
Figure 2.1-6 Grid configuration of the grapple head at the entrance=54,103,1
Figure 2.1-7 Grid configuration of a 1/6 symmetric section=55,104,1
Figure 2.1-8 Pressure contour of a 1/6 symmetric section=56,105,1
Figure 2.1-9 Velocity contour of a 1/6 symmetric section=57,106,1
Figure 2.2-1 A tentative DUPIC fuel bundle model=79,128,1
Figure 2.2-2 Bundle power distribution of the DUPIC fuel core=80,129,1
Figure 2.2-3 Bundle power distribution of the natural uranium core=81,130,1
Figure 2.2-4 Element linear power ratio of the DUPIC fuel bundle=82,131,1
Figure 2.2-5 Element linear power ratio of the 37-element natural uranium fuel bundle=83,132,1
Figure 2.2-6 DUPIC fuel bundle design power envelope=84,133,1
figure 2.2-7 Natural uranium fuel bundle design power envelope=85,134,1
Figure 2.2-8 Ramped linear power of the DUPIC fuel outer element=86,135,1
Figure 2.2-9 Linear power increase of the DUPIC fuel outer element=87,136,1
Figure 2.2-10 Ramped linear power of the standard fuel outer element=88,137,1
Figure 2.2-11 Linear power increase of the standard fuel outer element=89,138,1
Figure 2.2-12 DUPIC fuel outer element power history model=90,139,1
Figure 2.2-13 DUPIC fuel centerline temperature=91,140,1
Figure 2.2-14 DUPIC fuel heat transfer coefficient=92,141,1
Figure 2.2-15 DUPIC fuel fission gas release volume=93,142,1
Figure 2.2-16 DUPIC fuel internal pressure=94,143,1
Figure 2.2-17 Comparison of DUPIC fuel internal pressure=95,144,1
Figure 2.2-18 Axial power distribution of M-4,M-8,and N-11 channel=96,145,1
Figure 2.2-19 Radial power distribution of the 37-element fuel bundle=97,146,1
Figure 2.2-20 Radial power distribution of the DUPIC fuel bundle=98,147,1
Figure 2.2-21 Comparison of the minimum critical heat flux ratio for CASE I=99,148,1
Figure 2.2-22 Comparison of the minimum critical heat flux ratio for CASE II=100,149,1
Figure 2.2-23 Comparison of the minimum critical heat flux ratio for CASE III=101,150,1
Figure 3.1-1 Schematic of the liquid poison injection system=115,164,1
Figure 3.1-2 Segment of a calandria tank for 3-D jet simulation=116,165,1
Figure 3.1-3 Concentration profile at 9th pitch of nozzle #1 (delay time:0.7578 sec)=117,166,1
Figure 3.1-4 Comparison of jet growth predictions=118,167,1
Figure 3.2-1 Radial profile of the local heat generation rate (HAMMER)=123,172,1
Figure 3.2-2 Radial profile of the local heat generation rate (HELIOS)=124,173,1
Figure 3.2-3 HEL10S geometric model for a CANDU fuel=125,174,1
Figure 3.2-4 Comparison of power depression factors for the natural uranium fuel with a diameter of 12.20 mm=126,175,1
Figure 3.2-5 Variation of the fuel conductivity for different conductivity correlations=127,176,1
Figure 3.2-6 Variation of the fuel conductivity for different fuel burnups=128,177,1
Figure 3.2-7 Comparison of the fuel centerline temperature=129,178,1
Figure 3.3-1 Comparison of thermal conductivity=138,187,1
Figure 3.3-2 Comparison of thermal expansion=139,188,1
Figure 3.3-3 Iodine inventory of natural uranium fuel for a linear power of 50 kW/m=140,189,1
Figure 3.3-4 Iodine inventory of DUPIC fuel for a linear power of 50 kW/m=141,190,1
Figure 3.3-5 Total inventory variation with fuel burnup=142,191,1
Figure 3.3-6 Total inventory variation with linear power at 6250 MWd/t=143,192,1
Figure 3.3-7 Iodine gap inventory of natural uranium fuel for a linear power of 50 kw/m=144,193,1
Figure 3.3-8 Iodine gap inventory of DUPIC fuel for a linear power of 50 kw/m=145,194,1
Figure 3.3-9 Cap inventory variation with fuel burnup=146,195,1
Figure 3.3-10 Gap inventory variation with linear power at 6250 MWd/t=147,196,1
Figure 3.3-11 Comparison of centerline temperature for a linear power of 40 kw/m=148,197,1
Figure 3.3-12 Element linear power of the natural uranium core=149,198,1
Figure 3.3-13 Element linear power of the DUPIC fuel core=150,199,1
Figure 3.3-14 Relative ring power distributions of natural uranium fuel bundle=151,200,1
Figure 3.3-15 Relative ring power distributions of DUPIC fuel bundle=152,201,1
Figure 3.3-16 Fuel element linear power distribution=153,202,1
Figure 3.3-17 Fuel element burnup distribution=154,203,1
Figure 3.3-18 Power envelope of the natural uranium fuel=155,204,1
Figure 3.3-19 Power envelope of the DUPIC fuel=156,205,1
Figure 3.3-20 Gap inventory distribution as a function of linear power=157,206,1
Figure 3.3-21 Gap inventory distribution as a function of fuel burnup=158,207,1
Figure 3.4-1 Configuration of CANDU-6 shutdown system=170,219,1
Figure 3.4-2 Comparison of channel power distribution=171,220,1
Figure 3.4-3 Comparison of channel flow distribution=172,221,1
Figure 3.4-4 Channel nodalization of the 10-channel model=173,222,1
Figure 3.4-5 Primary and secondary heat transport system nodalization=174,223,1
Figure 3.4-6 Nodalization diagram of multiple average channel for core pass=175,224,1
Figure 3.4-7 Channel coolant density (Pass 4-1 to 4-7,PSB55)=176,225,1
Figure 3.4-8 Power transient for critical channel (PSB55)=177,226,1
Figure 3.4-9 Average fuel temperature (Pass 4-1 to 4-7,PSB55)=178,227,1
Figure 3.4-10 Channel coolant density (Pass 4-1 to 4-7,RIH35)=179,228,1
Figure 3.4-11 Power transient for critical channel (RIH35)=180,229,1
Figure 3.4-12 Average fuel temperature (Pass 4-1 to 4-7,RIH35)=181,230,1
Figure 3.4-13 Channel coolant density (Pass 4-1 to 4-7,ROH100)=182,231,1
Figure 3.4-14 Power transient for critical channel (ROH 100)=183,232,1
Figure 3.4-15 Average fuel temperature (Pass 4-1 to 4-7,ROH 100)=184,233,1
Figure 4.3-1 Demand prediction model of DYMOND code=210,259,1
Figure 4.3-2 Plant construction model of the DYMOND code=211,260,1
Figure 4.3-3 Fuel requirement model of the DYMOND code=212,261,1
Figure 4.3-4 Amount of spent fuel and heavy elements (2015)=213,262,1
Figure 4.3-5 Amount of heavy elements (2015)=214,263,1
Figure 4.3-6 Amount of spent fuel and heavy elements (2020)=215,264,1
Figure 4.3-7 Amount of heavy elements (2020)=216,265,1
Figure 4.3-8 Amount of spent fuel and heavy elements (2025)=217,266,1
Figure 4.3-9 Amount of heavy elements (2025)=218,267,1
Figure 4.3-10 Amount of spent fuel and heavy elements (2030)=219,268,1
Figure 4.3-11 Amount of heavy elements (2030)=220,269,1
Figure 4.3-12 Amount of spent fuel and heavy elements (Capacity 20%)=221,270,1
Figure 4.3-13 Amount of heavy elements (Capacity 20%)=222,271,1
Figure 4.3-14 Amount of spent fuel and heavy elements (Capacity 18%)=223,272,1
Figure 4.3-15 Amount of heavy elements (Capacity 18%)=224,273,1
Figure 4.3-16 Comparison of spent fuel inventories=225,274,1
Figure 4.3-17 Comparison of heavy element inventories=226,275,1
Figure 4.4-1 Modeling of nuclear energy demand prediction=238,287,1
Figure 4.4-2 Reactor construction model including PHWR=239,288,1
Figure 4.4-3 Overall fuel cycle model=240,289,1
Figure 4.4-4 Fuel requirement model=241,290,1
Figure 4.4-5 PWR input data of the DYMOND code=242,291,1
Figure 4.4-6 PWR fuel composition data of the DYMOND code=243,292,1
Figure 4.4-7 PHWR Input data of the DYMOND code=244,293,1
Figure 4.4-8 PHWR fuel composition data of the DYMOND code=245,294,1
Figure 4.4-9 Demand power scenario (Once-through)=246,295,1
Figure 4.4-10 Electricity generation fraction of each reactor type (Once-through)=247,296,1
Figure 4.4-11 Number of operating reactors (Once-through)=248,297,1
Figure 4.4-12 Number of reactor orders (Once-through)=249,298,1
Figure 4.4-13 Spent (fuel inventory (Once-through)=250,299,1
Figure 4.4-14 Uranium inventory (Once-through)=251,300,1
Figure 4.4-15 Plutonium and minor actinide inventory (Once-through)=252,301,1
Figure 4.4-16 Fission products inventory (Once-through)=253,302,1
Figure 4.4-17 DUPIC reactor input data of the DYMOND code=254,303,1
Figure 4.4-18 DUPIC fuel composition data of the DYMOND code=255,304,1
Figure 4.4-19 Electricity generation fraction of each reactor type (DUPIC Cycle)=256,305,1
Figure 4.4-20 Number of operating reactors (DUPIC Cycle)=257,306,1
Figure 4.4-21 Comparison of spent fuel Inventory (DUPIC Cycle)=258,307,1
Figure 4.4-22 Comparison of uranium inventory (DUPIC Cycle)=259,308,1
Figure 4.4-23 Comparison of plutonium inventory (DUPIC Cycle)=260,309,1
Figure 4.4-24 Comparison of minor actinide inventory (DUPIC Cycle)=261,310,1
Figure 4.4-25 Comparison of fission products inventory (DUPIC Cycle)=262,311,1
Figure 4.4-26 KALIMER-150 break-even core layout=263,312,1
Figure 4.4-27 KALIMER-600 break-even core layout=264,313,1
Figure 4.4-28 KALIMER-150 fuel composition data of the DYMOND code=265,314,1
Figure 4.4-29 KALIMER-600 fuel composition data of the DYMOND code=266,315,1
Figure 4,4-30 Electricity generation fraction of each reactor type (KALIMER Cycle)=267,316,1
Figure 4.4-31 Number of operating reactors (KALIMER-150)=268,317,1
Figure 4.4-32 Number of operating reactors (KALIMER-600)=269,318,1
Figure 4.4-33 Comparison of total spent fuel accumulation=270,319,1
Figure 4,4-34 Comparison of uranium accumulation=271,320,1
Figure 4.4-35 Comparison of plutonium accumulation=272,321,1
Figure 4.4-36 Comparison of minor actinides accumulation=273,322,1
Figure 4.4-37 Comparison of fission products accumulation=274,323,1
Figure 4.4-38 Hybrid BN-600 break-even core layout=275,324,1
Figure 4.4-39 Modified BN-600 break-even core layout=276,325,1
Figure 4.4-40 Hybrid BN-600 fuel composition data of the DYMOND code=277,326,1
Figure 4.4-41 Modified BN-600 fuel composition data of the DYMOND code=278,327,1
Figure 4.4-42 Electricity generation fraction of each reactor type (SFR cycle)=279,328,1
Figure 4.4-43 Number of operating reactors (SFR cycle)=280,329,1
Figure 4.4-44 Comparison of total spent fuel accumulation=281,330,1
Figure 4.4-45 Comparison of uranium accumulation=282,331,1
Figure 4.4-46 Comparison of plutonium accumulation=283,332,1
Figure 4.4-47 Comparison of minor actinides accumulation=284,333,1
Figure 4.4-48 Comparison of fission products accumulation=285,334,1
Figure 5.1-1 Schematic flow-sheet of IFR pyre-process=297,346,1
Figure 5.1-2 Comparison of AIROX and DUPIC process=298,347,1
Figure 5.2-1 Infinite multiplication factors against the PWR spent fuel powder concentration=309,358,1
Figure 5.2-2 Effective multiplication factor against the PWR spent fuel powder mass=310,359,1
Figure 5.2-3 Effective multiplication factor against the number of PWR spent fuel rods (Rectangular lattice)=311,360,1
Figure 5.2-4 Effective multiplication factor against the number of PWR spent fuel rods (Hexagonal lattice)=312,361,1
Figure 5.2-5 Infinite multiplication factor against the ThO₂/UO₂ fuel powder concentration=313,362,1
Figure 5.2-6 Effective multiplication factor against the ThO₂/UO₂fuel powder mass=314,363,1
Figure 5.2-7 Effective multiplication factor against the number of ThO₂/UO₂ fuel bundles (Single layer)=315,364,1
Figure 5.2-8 Effective multiplication factor against the number of ThO₂/UO₂ fuel bundles (Rectangular array in double layers)=316,365,1
Figure 5.2-9 Effective multiplication factor against the number of ThO₂/UO₂ fuel bundles (Hexagonal array in dovble layers)=317,366,1
Figure 5.2-10 Critical mass of the dry TRU powder against the powder density=318,367,1
Figure 5.2-11 Critical mass of the flooded TRU powder against the weight fraction=319,368,1
Figure 5.2-12 Critical mass of the dry SFR spent fuel powder against the density=320,369,1
Figure 5.2-13 Critical mass of the flooded SFR spent fuel powder against the weight fraction=321,370,1
Figure 5.2-14 Infinite multiplication factor of the SFR spent fuel rod against the P/D ratio (Flooded hexagonal lattice)=322,371,1
Figure 5.2-15 Hexagonal prism layout=323,372,1
Figure 5.2-16 Infinite multiplication factor of the SFR spent fuel rod against the P/D ratio (Flooded rectangular lattice)=324,373,1
Figure 5.2-17 Hexahedra prism layout=325,374,1
Figure 6.1-1 Configuration of a GFR core=350,399,1
Figure 6.1-2 Configuration of an LFR core (SVBR-75/100)=351,400,1
Figure 6,1-3 Configuration of an MSR system=352,401,1
Figure 6.1-4 Configuration of a SFR core (KALIMER)=353,402,1
Figure 6.1-5 Configuration of a SCWR system (SCLWR-H)=354,403,1
Figure 6.1-6 Configuration of a VHTR system (GT-MHR)=355,404,1
Figure 6.2-1 Radial configuration of BN-600 hybrid core (CASE I)=385,434,1
Figure 6.2-2 Radial configuration of BN-600 modified core (CASE II)=386,435,1
Figure 6.2-3 SFR physics calculation flow=387,436,1
Figure 6.2-4 Breeding ratio against the fuel volume fraction=388,437,1
Figure 6.2-5 Burnup reactivity swing against the fuel volume fraction=389,438,1
Figure 6.2-6 Amount of surplus TRU material against the removal rate of fission products (CASE I,Fuel volume fraction:49%)=390,439,1
Figure 6.2-7 Amount of surplus TRU material against the removal rate of fission products (CASE I,Fuel volume fraction:51%)=391,440,1
Figure 6.2-8 Amount of surplus TRU material against the removal rate of fission products (CASE II,Fuel volume fraction:51%)=392,441,1
Figure 6.2-9 Amount of surplus TRU material against the removal rate of fission products (CASE II,Fuel volume fraction:53%)=393,442,1
Figure 6.3-1 Breeding ratio against the fuel volume fraction=412,461,1
Figure 6.3-2 Burnup reactivity swing against the fuel volume fraction=413,462,1
Figure 6.3-3 Amount of surplus TRU material against the removal rate of fission products (CASE I,Fuel volume fraction:45%)=414,463,1
Figure 6.3-4 Amount of surplus TRU material against the removal rate of fission products (CASE I,Fuel volume fraction:47%)=415,464,1
figure 6.3-5 Amount of surplus TRU material against the removal rate of fission products (CASE II,Fuel volume fraction:47%)=416,465,1
Figure 6.3-6 Amount of surplus TRU material against the removal rate of fission products (CASE II,Fuel volume fraction:49%)=417,466,1
Figure 6.4-1 Reactivity change of the reference GFR=429,478,1
Figure 6.4-2 Material flow of the reference GFR=430,479,1
Figure 6.4-3 Effect of process parameters on the GFR core reactivity=431,480,1
Figure 6.5-1 Comparison of CANDU reactor size=473,522,1
Figure 6.5-2 Comparison of CANDU-6 and ACR fuel lattices=474,523,1
Figure 6.5-3 Infinite multiplication factors of ACR lattices=475,524,1
Figure 6.5-4 Void reactivity change of ACR lattices=476,525,1
Figure 6.5-5 Coolant temperature coeffcients of ACR lattices=477,526,1
Figure 6.5-6 Fuel temperature coefficients of ACR lattices=478,527,1
Figure 6.5-7 Moderator temperature coefficients of ACR lattices=479,528,1
Figure 6.5-8 Absorption cross sections of 232Th(이미지참조) and 238U(이미지참조)=480,529,1
figure 6.5-9 Infinite multiplication factors of recycled ThO₂-UO₂ fuel=481,530,1
Figure 6.5-10 Fuel temperature coefficient variation=482,531,1
Figure 6.5-11 Coolant temperature coefficient variation=483,532,1
Figure 6.5-12 Moderator temperature coefficient variation=484,533,1
Figure 6.5-13 Coolant void reactivity variation=485,534,1
Figure 6.5-14 Fissile contents of recycled ThO₂-UO₂ fuel=486,535,1
Figure 6.5-15 Sensitivity of discharge burnup to initial uranium content=487,536,1
Figure 6.5-16 233Pa(이미지참조) and plutonium mass of ThO₂-9%UO₂ fuel=488,537,1
Figure 6.5-17 Infinite multiplication factors of various initial uranium loadings (0% removal rates of rare earths)=489,538,1
Figure 6.5-18 Infinite multiplication factors of various initial uranium loadings (30% removal rates of rare earths)=490,539,1
Figure 6.5-19 Infinite multiplication factors for various removal rates of rare earths (0% initial uranium loadings)=491,540,1
Figure 6.6-1 Physics calculation path of the AIROX fuel=498,547,1
Figure 6.6-2 Configuration of a 16×16 CE fuel assembly=499,548,1
Figure 6.6-3 Comparison of the infinite multiplication factor=500,549,1
Figure 6.6-4 Comparison of the fissile plutonium content=501,550,1
Figure 6.6-5 Comparison of the thermal flux=502,551,1
Figure 6.6-6 Comparison of the moderator temperature coefficient=503,552,1
Figure 6.6-7 Comparison of the Doppler coefficient=504,553,1
Figure 6.6-8 Comparison of the boron worth=505,554,1
Figure 6.6-9 Comparison of the infinite multiplication factor for different rare earth removal rates=506,555,1
Figure 6.6-10 Comparison of the moderator temperature coefficient for different rare earth removal rates=507,556,1
Figure 6.6-11 Comparison of the Doppler coefficient for different rare earth removal rates=508,557,1
Figure 6.6-12 Comparison of the boron worth for different rare earth removal rates=509,558,1
*표시는 필수 입력사항입니다.
| 전화번호 |
|---|
| 기사명 | 저자명 | 페이지 | 원문 | 기사목차 |
|---|
| 번호 | 발행일자 | 권호명 | 제본정보 | 자료실 | 원문 | 신청 페이지 |
|---|
도서위치안내: / 서가번호:

우편복사 목록담기를 완료하였습니다.
*표시는 필수 입력사항입니다.
저장 되었습니다.
