
 대표어
대표어
권호기사보기
| 기사명 | 저자명 | 페이지 | 원문 | 기사목차 |
|---|
결과 내 검색
동의어 포함
목차
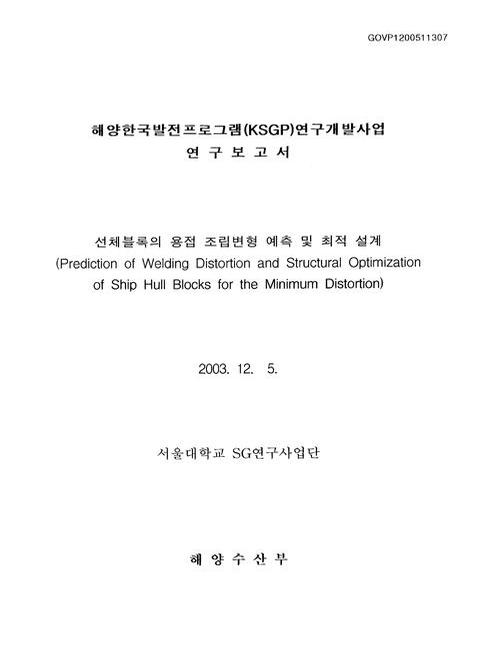
표제지=0,1,1
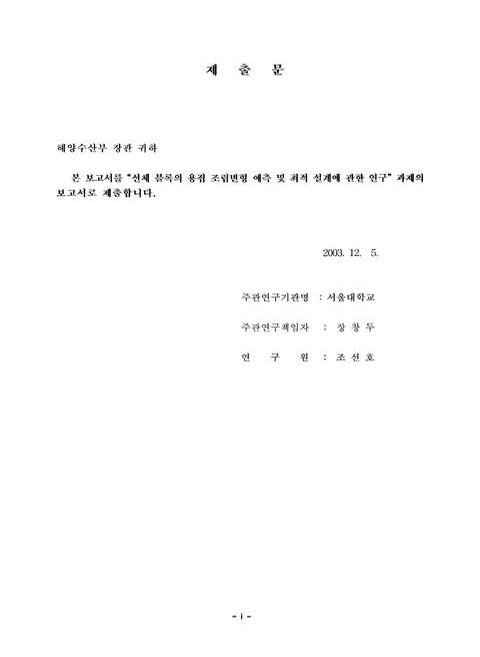
제출문=i,2,1
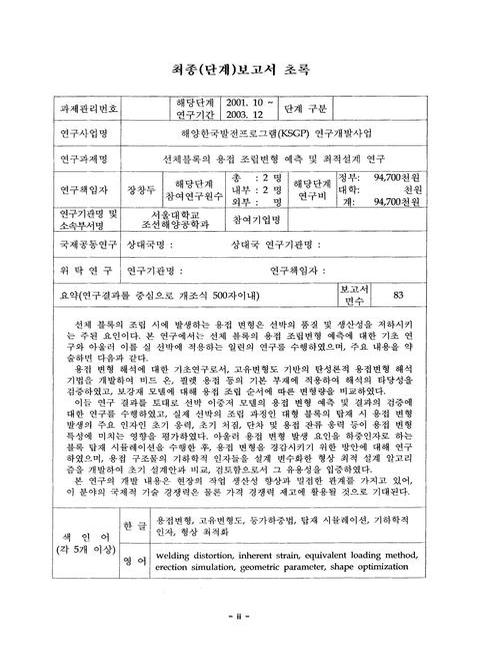
최종(단계)보고서 초록/장창두=ii,3,1
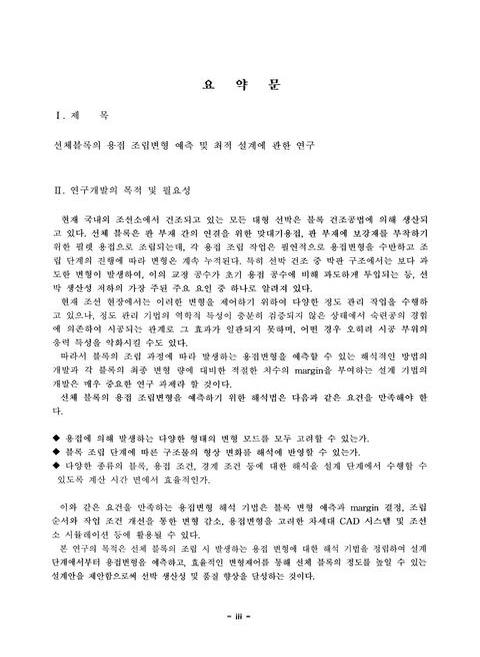
요약문=iii,4,3
SUMMARY=vi,7,3
CONTENTS=ix,10,2
목차=xi,12,2
표목차=xiii,14,1
그림목차=xiv,15,3
제1장 연구개발과제의 개요=1,18,1
제1절 연구의 배경 및 필요성=1,18,2
제2절 연구 목적=3,20,1
제3절 연구 내용 및 범위=3,20,1
1. 선체 블록의 용접변형 해석 기법의 개발=3,20,2
2. 선체 블록 탑재시의 변형 해석 기법 개발=4,21,2
3. 변형 최소화를 위한 최적 설계 방법론 개발=5,22,2
제2장 국내외 연구개발 현황=7,24,1
제1절 용접변형 해석 방법론=7,24,3
제2절 고유변형도 계산 방법론=9,26,2
제3절 선체 블록의 변형 해석 및 정도관리=10,27,1
제3장 연구개발수행 내용 및 결과=11,28,1
제1절 선체 블록의 용접변형 해석 기법의 개발=11,28,1
1. 용접 고유변형도의 결정=11,28,5
2. 선체 블록의 구속도 계산=15,32,2
3. 용접 열전도 해석=16,33,1
4. 용접변형 계산 결과=17,34,6
제2절 선체 블록 탑재시의 변형 해석 기법 개발=23,40,1
1. 블록 탑재 시 변형의 특성=23,40,4
2. 탑재 시뮬레이션=26,43,12
제3절 변형 최소화를 위한 최적 설계 방법론 개발=38,55,1
1. 열전달 이론 연구=38,55,5
2. 열 변형 이론 연구=42,59,2
3. 용접 해석 코드 연구=43,60,7
4. 용접 모델링 연구=49,66,6
5. 최적 설계 연구=55,72,20
제4절 결론=75,92,1
1. 선체 블록의 용접변형 해석 기법의 개발=75,92,1
2. 선체 블록 탑재시의 변형 해석 기법 개발=75,92,2
3. 변형 최소화를 위한 최적 설계 방법론 개발=76,93,1
제4장 목표달성도 및 관련분야에의 기여도=77,94,1
제1절 연구개발 목표 달성도=77,94,1
제2절 관련 분야에의 기여도=77,94,1
제5장 연구개발결과의 활용계획=78,95,1
제6장 참고 문헌=79,96,5
영문목차
[title page etc.]=0,1,2
Abstract (Korean)=ii,3,1
SUMMARY (Korean)=iii,4,3
SUMMARY (English)=vi,7,3
CONTENTS (English)=ix,10,2
CONTENTS (Korean)=xi,12,2
List of Tables=xiii,14,1
List of Figures=xiv,15,3
Chapter 1. Introduction=1,18,1
Section 1. Importance and background of the Project=1,18,2
Section 2. Objective of the Project=3,20,1
Section 3. Scope and Contents of the Project=3,20,1
1. Analysis of Welding Distortion of Ship Hull Blocks=3,20,2
2. Analysis of Deformation at the Erection Stage=4,21,2
3. Structural Optimization for the Minimum Distortion=5,22,2
Chapter 2. Current State-of-the-Art=7,24,1
Section 1. Analysis of Welding Distortion=7,24,3
Section 2. Determination of Inherent Strain=9,26,2
Section 3. Deformation Analysis and Accuracy Control of Ship Hull Blocks=10,27,1
Chapter 3. Contents and Results of the Project=11,28,1
Section 1. Analysis of welding distortion of ship hull blocks=11,28,1
1. Determination of Inherent Strain=11,28,5
2. Calculation of the Degree of Restraint=15,32,2
3. Welding Heat Transfer Analysis=16,33,1
4. Results=17,34,6
Section 2. Analysis of deformation at the erection stage=23,40,1
1. Characteristics of Deformation at the Erection Stage=23,40,4
2. Erection Simulation=26,43,12
Section 3. Structural optimization for the minimum distortion=38,55,1
1. Theory of Heat Transfer=38,55,5
2. Theory of Heat Deformation=42,59,2
3. Research of Welding Deformation Analysis=43,60,7
4. Modeling of Welding Conditions=49,66,6
5. Optimum Design=55,72,20
Section 4. Conclusions=75,92,1
1. Analysis of welding distortion of ship hull blocks=75,92,1
2. Analysis of deformation at the erection stage=75,92,2
3. Structural optimization for the minimum distortion=76,93,1
Chapter 4. Degree of Achievement and Expected Effects=77,94,1
Section 1. Degree of Achievement=77,94,1
Section 2. Expected Effects=77,94,1
Chapter 5. Plans for the Application=78,95,1
Chapter 6. References=79,96,5
Fig. 1.3.1 Deformation due to fillet welds in two types of boundary=3,20,1
Fig. 1.3.2 Welding deformation of a stiffened plate=3,20,1
Fig. 3.1.1 Definition of inherent strain=12,29,1
Fig. 3.1.2 One-dimensional Bar-spring model=13,30,1
Fig. 3.1.3 Thermal history of stress=13,30,1
Fig. 3.1.4 Thermal history of plastic strain=13,30,1
Fig. 3.1.5 Classification of welding distortions=14,31,1
Fig. 3.1.6 Flow chart for the welding deformation analysis of ship hull blocks=15,32,1
Fig. 3.1.7 Characteristics of internal restraint=15,32,1
Fig. 3.1.8 Temperature distribution=16,33,1
Fig. 3.1.9 Experiment model by Terasaki=17,34,1
Fig. 3.1.10 Calculation results compared with experiments of bead-on-plate welding=17,34,1
Fig. 3.1.11 Experiment model by Kim and Lee=18,35,1
Fig. 3.1.12 Calculation results compared with experiments of fillet welding=18,35,1
Fig. 3.1.13 Shape of stiffened plate for analysis=19,36,1
Fig. 3.1.14 Welding deformation of each assembly stage (case 1)=19,36,1
Fig. 3.1.15 Vertical displacement along x-axis=20,37,1
Fig. 3.1.16 Vertical displacement along y-axis=20,37,1
Fig. 3.1.17 Double bottom block=21,38,1
Fig. 3.1.18 FE mesh model=21,38,1
Fig. 3.1.19 Fabrication sequence=21,38,1
Fig. 3.1.20 Deformed shape of double bottom block=22,39,1
Fig. 3.1.21 Vertical Displacement of bottom plate along x-axis (y=22,39,1
Fig. 3.1.22 Vertical Displacement of bottom plate along y-axis (x=22,39,1
Fig. 3.2.1 Progress of deformation of ship hull blocks=23,40,1
Fig. 3.2.2 Measuring position of block deformation(upper deck structures of engine room block)=24,41,1
Fig. 3.2.3 Description for the illustration of deformation=25,42,1
Fig. 3.2.4 Final deformation of upper deck structures of engine room block=25,42,2
Fig. 3.2.5 3D FE model for the simulation of erection of engine room block=28,45,1
Fig. 3.2.6 Erection process simulation=29,46,2
Fig. 3.2.7 Comparison of final deformed shapes=30,47,2
Fig. 3.2.8 Lateral displacements of plate panels of deck structures of engine room block by erection simulation=31,48,1
Fig. 3.2.9 Final deformed shapes of deck structures of engine room block in case of deck thickness increase=32,49,1
Fig. 3.2.10 Lateral displacements of plate panels of deck structures of engine room block in case of deck thickness increase=33,50,1
Fig. 3.2.11 Correction of FE model for carling attachment=34,51,1
Fig. 3.2.12 Final deformed shapes of deck structures of engine room block in case of carling attachment=34,51,1
Fig. 3.2.13 Lateral displacements of plate panels of deck structures of engine room block in case of carling attachment=35,52,1
Fig. 3.2.14 Final deformed shapes of deck structures of engine room block in case of erection order change=36,53,1
Fig. 3.2.15 Lateral displacements of plate panels of deck structures of engine room block in case of erection order change=37,54,1
Fig. 3.3.1 Nonlinear material properties=42,59,1
Fig. 3.3.2 Residual stress σ~(이미지참조)=42,59,1
Fig. 3.3.3 FE model of plate=43,60,1
Fig. 3.3.4 Distribution of temperature=43,60,1
Fig. 3.3.5 Deformed shape=43,60,1
Fig. 3.3.6 Simple plate model=44,61,1
Fig. 3.3.7 History of temperature distribution=45,62,1
Fig. 3.3.8 Boundary conditions=45,62,1
Fig. 3.3.9 Deformed shape=46,63,1
Fig. 3.3.10 Distribution of plastic strain by welding speed=46,63,1
Fig. 3.3.11 Distribution of plastic strain at 1.Omm/sec=47,64,1
Fig. 3.3.12 Coupled solid-shell model=47,64,1
Fig. 3.3.13 Distribution of temperature by welding speed=48,65,1
Fig. 3.3.14 L-plate model=48,65,1
Fig. 3.3.15 Distribution of temperature=49,66,1
Fig. 3.3.16 Deformed shape=49,66,1
Fig. 3.3.17 Stiffened plate model=50,67,1
Fig. 3.3.18 Coupled FE model using solid-shell=50,67,1
Fig. 3.3.19 Temperature distribution in steady state=51,68,1
Fig. 3.3.20 Examples of simple modeling=51,68,1
Fig. 3.3.21 Process of double bottom modeling=52,69,1
Fig. 3.3.22 Double bottom model using shell element=53,70,1
Fig. 3.3.23 Model of welding deformation analysis=53,70,1
Fig. 3.3.24 Results of thermo transfer analysis=54,71,1
Fig. 3.3.25 Results of elastic-plastic analysis=54,71,1
Fig. 3.3.26 FE Model=55,72,1
Fig. 3.3.27 Conditions of analysis=56,73,1
Fig. 3.3.28 Temperature distribution (136 sec)=57,74,1
Fig. 3.3.29 Temperature distribution (at cooling)=57,74,1
Fig. 3.3.30 Result of displacement=58,75,1
Fig. 3.3.31 Stress Distribution=58,75,1
Fig. 3.3.32 Deformed shape=58,75,1
Fig. 3.3.33 Displacement at various welding speed=59,76,1
Fig. 3.3.34 Displacement distribution at y-direction=60,77,1
Fig. 3.3.35 Displacement distribution along time=60,77,1
Fig. 3.3.36 Displacement along welding sequence=61,78,1
Fig. 3.3.37 Curves of displacement along welding sequence=61,78,1
Fig. 3.3.38 Displacement distribution by welding condition (voltage)=62,79,1
Fig. 3.3.39 Distribution of temperature and displacement=62,79,1
Fig. 3.3.40 Geometric parameters of plane=63,80,1
Fig. 3.3.41 Geometric parameters of curved surface=63,80,1
Fig. 3.3.42 Composition of objective function=65,82,1
Fig. 3.3.43 Flowchart of optimization=65,82,1
Fig. 3.3.44 Model composed of plates=66,83,1
Fig. 3.3.45 Comparison of deformed shape=67,84,1
Fig. 3.3.46 Model composed of curved surface=68,85,1
Fig. 3.3.47 Comparison of deformed shape=69,86,1
Fig. 3.3.48 Model of bulbous bow=70,87,1
Fig. 3.3.49. Comparison of optimum design result=71,88,1
Fig. 3.3.50 Recomposed bulbous bow model=71,88,1
Fig. 3.3.51 Comparison of deformed shape=72,89,1
Fig. 3.3.52 Engine room model=73,90,1
Fig. 3.3.53 Comparison of deformed shape=74,91,1
*표시는 필수 입력사항입니다.
| 전화번호 |
|---|
| 기사명 | 저자명 | 페이지 | 원문 | 기사목차 |
|---|
| 번호 | 발행일자 | 권호명 | 제본정보 | 자료실 | 원문 | 신청 페이지 |
|---|
도서위치안내: / 서가번호:

우편복사 목록담기를 완료하였습니다.
*표시는 필수 입력사항입니다.
저장 되었습니다.
