
 대표어



권호기사보기
| 기사명 | 저자명 | 페이지 | 원문 | 기사목차 |
|---|
결과 내 검색
동의어 포함
목차
표제지=0,1,1
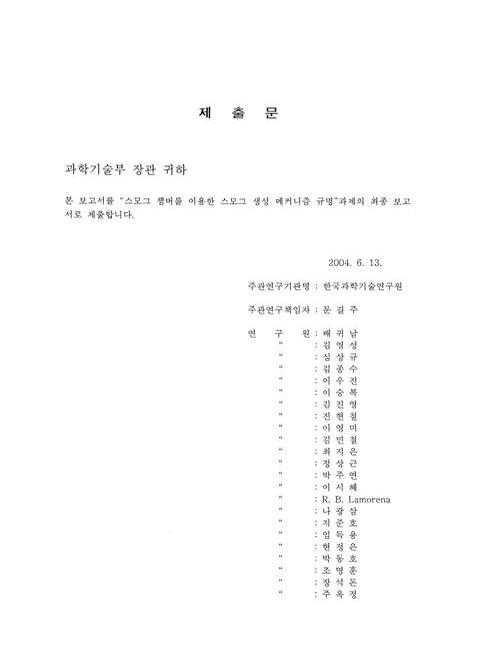
제출문=0,2,1
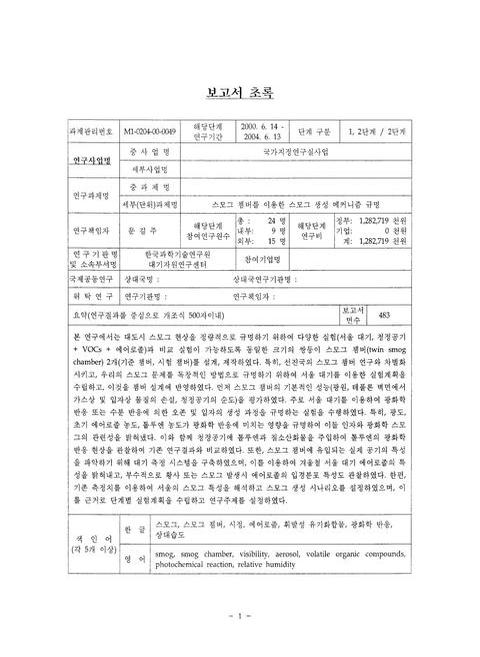
보고서 초록/문길주=1,3,2
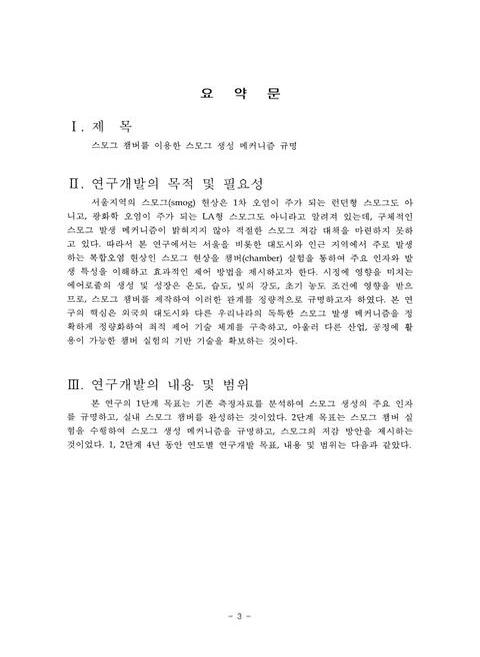
요약문=3,5,4
SUMMARY=7,9,6
CONTENTS=13,15,4
목차=17,19,4
표 목차=21,23,2
그림 목차=23,25,8
제1장 연구개발과제의 개요=31,33,1
제1절 스모그 제어 기술=31,33,5
제2절 연구개발의 필요성=35,37,7
제3절 연구개발의 내용 및 범위=41,43,4
제2장 국내외 기술개발 현황=45,47,1
제1절 국외 현황=45,47,7
제2절 국내 현황=51,53,4
제3장 연구개발 수행 내용 및 결과=55,57,1
제1절 전국의 시정 특성=55,57,1
1. 서론=55,57,3
2. 서울 스모그 특성의 1차 해석=57,59,5
3. 우리나라의 시정 분석=61,63,18
제2절 광화학 상자모델과 기체/입자 평형모델을 이용한 서울ㆍ수도권의 계절별 질산염 농도 변화=79,81,1
1. 서론=79,81,2
2. 모델링=80,82,8
3. 결과 및 고찰=87,89,7
4. 요약 및 결론=93,95,2
제3절 서울 스모그 생성 시나리오 작성 및 주요 인자=95,97,1
1. 서울 스모그 생성 시나리오=95,97,4
2. 2001년 6월 서울에서의 비메탄계 탄화수소와 미세입자의 농도 변화=98,100,16
제4절 다기능 실내 스모그 챔버=114,116,1
1. 개요=114,116,2
2. 스모그 챔버의 설계 및 제작=115,117,8
제5절 스모그 챔버의 성능 평가=123,125,1
1. 광원의 특성과 광분해율=123,125,5
2. 가스상 벽면 손실=127,129,3
3. 입자상 벽면 손실=129,131,14
4. 청정공기의 순도=142,144,2
5. 실제 대기의 광화학 반응 챔버로 사용되는 테플론 백의 오염도 평가=143,145,20
제6절 서울 대기를 이용한 광화학 반응 실험=163,165,1
1. 서론=163,165,3
2. 챔버 실험=165,167,4
3. 실험 결과 및 고찰=169,171,17
제7절 서울 대기를 이용한 수분 반응 실험=186,188,1
1. 2002년 봄철 대기를 이용한 실험=186,188,27
2. 2003년 겨울철 대기를 이용한 실험=212,214,14
3. 2003년 봄철 대기를 이용한 실험=225,227,23
제8절 스모그 인자의 광화학 반응 기여도 평가:광도의 영향=248,250,1
1. 서론=248,250,2
2. 챔버 실험=249,251,6
3. 결과=255,257,10
4. 검토=264,266,7
5. 결론=270,272,2
제9절 스모그 인자의 광화학 반응 기여도 평가:초기 입자의 영향=272,274,1
1. 서론=272,274,1
2. 챔버 실험=272,274,4
3. 결과 및 고찰=276,278,18
4. 결론=293,295,2
제10절 The Effect of Initial Concentration Ratio of Toluene/NOx(이미지참조) on the Photochemical Reaction in Twin Smog Chambers Filled with Ambient Air=295,297,1
1. Introduction=295,297,2
2. Experimental=296,298,5
3. Results and discussion=300,302,9
4. Conclusions=309,311,1
제11절 톨루엔-NOx(이미지참조)-공기 혼합물의 광화학 반응 실험 및 모사=310,312,1
1. 초기 톨루엔 농도가 톨루엔-NOx(이미지참조)-공기 혼합물의 광산화 반응에 미치는 영향:I. 가스상 물질의 변화=310,312,21
2. 초기 톨루엔 농도가 톨루엔-NOx(이미지참조)-공기 혼합물의 광산화 반응에 미치는 영향:II. 입자상 물질의 생성 및 성장=331,333,21
3. 모사=351,353,4
4. Morphology=355,357,4
제12절 에어로졸의 생성 및 성장 현상의 모사=359,361,1
1. Bimodal moment method를 이용한 톨루엔/NOx(이미지참조) 혼합물의 광화학 반응 실험의 모사=359,361,8
제13절 The Secondary Products by Ozone-initiated Reaction with Terpenes Emitted from Natural Paint=367,369,1
1. Introduction=367,369,3
2. Experimental=369,371,6
3. Results and discussion=374,376,10
4. Conclusions=383,385,1
제14절 서울 대기질 모니터링=384,386,1
1. 2001년 겨울철 서울 대기 에어로졸의 입경별 수 농도 특성=384,386,22
2. 2002년 봄철 서울 대기질 모니터링=405,407,5
3. APS와 OPC를 이용한 대기 에어로졸 입경분포 측정결과의 비교=410,412,5
제4장 목표달성도 및 관련분야의 기여도=415,417,1
제1절 연도별 연구목표=415,417,1
1. 연구개발 목표 및 연구 내용=415,417,1
2. 1단계 1차년도 연구수행 방법 및 연구내용=416,418,1
3. 1단계 2차년도 연구수행 방법 및 연구내용=417,419,2
4. 2단계 1차년도 연구수행 방법 및 연구내용=419,421,1
5. 2단계 2차년도 연구수행 방법 및 연구내용=420,422,1
제2절 연구개발의 목표 달성도=421,423,3
제3절 관련분야의 기여도=423,425,2
제5장 연구개발결과의 활용계획=425,427,1
제1절 국내외 관련분야의 환경변화=425,427,1
1. LA 지역의 스모그 문제 해결=425,427,2
2. 미세입자 중 유기성분에 관한 관심의 증대=426,428,2
3. 미세입자 성분의 실시간 측정=427,429,1
제2절 2단계 연구결과의 활용현황=428,430,2
제3절 연구결과의 활용방안=429,431,1
제4절 향후 연구 계획=430,432,1
1. 디젤 자동차 배출 가스 실험=430,432,5
2. Biogenic VOCs의 광화학 반응 챔버 실험=435,437,5
3. 스모그 저감 방안 연구=439,441,2
제6장 연구개발과정에서 수집한 해외과학기술정보=441,443,1
제1절 University of California,Riverside의 연구 동향=441,443,5
제2절 CSIRO,Sydney의 연구 동향=445,447,2
제3절 스모그 챔버 연구에 관한 국제 워크숍 개최=446,448,2
제4절 환경 입자 연구 교류회 개최=447,449,2
제7장 참고문헌=449,451,20
특정연구개발사업 연구결과 활용계획서/문길주=469,471,15
영문목차
[title page etc.]=0,1,14
CONTENTS=13,15,18
Chapter 1. Overview of R & D=31,33,1
Section 1. Smog control technology=31,33,5
Section 2. Need for R & D=35,37,7
Section 3. Contents and scope of R & D=41,43,4
Chapter 2. Present state of technology=45,47,1
Section 1. Abroad state=45,47,7
Section 2. Domestic state=51,53,4
Chapter 3. Contents and results=55,57,1
Section 1. Characteristics of nationwide visibility=55,57,1
1. Introduction=55,57,3
2. Analysis of smog characteristics in Seoul=57,59,5
3. Analysis of visibility trends in Korea=61,63,18
Section 2. Seasonal variation of nitrate in the Greater Seoul area using a photochemical box model and a gas/aerosol equilibrium model=79,81,1
1. Introduction=79,81,2
2. Description of model=80,82,8
3. Results and discussion=87,89,7
4. Summary and conclusions=93,95,2
Section 3. Set up Seoul smog formation scenario and major parameters=95,97,1
1. Seoul smog formation scenario=95,97,4
2. Characteristics of NMVOCs and aerosols in Seoul,June 2004=98,100,16
Section 4. Multi-functional indoor smog chamber=114,116,1
1. Outlines=114,116,2
2. Design and construction of a smog chamber=115,117,8
Section 5. Performance evaluation of a smog chamber=123,125,1
1. Characteristics of a light source and NO₂ photolysis rate=123,125,5
2. Wall loss of gas phase species=127,129,3
3. Wall loss of particle phase species=129,131,14
4. Purity of purified air=142,144,2
5. Evaluation of Teflon bags' wall contamination effect=143,145,20
Section 6. Preliminary experimental in a smog chamber using ambient air=163,165,1
1. Introduction=163,165,3
2. Chamber experiments=165,167,4
3. Results and discussion=169,171,17
Section 7. Water vapor reactions in a smog chamber using ambient air=186,188,1
1. Using ambient air in spring,2002=186,188,27
2. Using ambient air in winter,2003=212,214,14
3. Using ambient air in spring,2003=225,227,23
Section 8. Contribution of parameters to photochemical reactions:Light intensity effect=248,250,1
1. Introduction=248,250,2
2. Experimental=249,251,6
3. Results=255,257,10
4. Discussion=264,266,7
5. Conclusions=270,272,2
Section 9. Contribution of parameters to photochemical reactions:Initial particle effect=272,274,1
1. Introduction=272,274,1
2. Experimental=272,274,4
3. Results and discussion=276,278,18
4. Conclusions=293,295,2
Section 10. Contribution of parameters to photochemical reactions:Initial concentration ratio of toluene/NOx(이미지참조)=295,297,1
1. Introduction=295,297,2
2. Experimental=296,298,5
3. Results and discussion=300,302,9
4. Conclusions=309,311,1
Section 11. Photochemical reactions of toluene/NOx(이미지참조)/purified air mixture=310,312,1
1. Change of gas phase species=310,312,21
2. Formation and condensational growth of particles=331,333,21
3. Simulation=351,353,4
4. Morphology=355,357,4
Section 12. Simulation of formation and condensational growth of particles=359,361,1
1. Simulation of experiments using toluene/NOx(이미지참조)/purified air mixture=359,361,8
Section 13. Experiment of ozone-initiated reaction with terpenes emitted from natural paint=367,369,1
1. Introduction=367,369,3
2. Experimental=369,371,6
3. Results and discussion=374,376,10
4. Conclusions=383,385,1
Section 14. Monitoring of Seoul air quality=384,386,1
1. Analysis of ambient aerosols in Seoul in winter,2001=384,386,22
2. Analysis of ambient aerosols in Seoul in spring,2002=405,407,5
3. Comparison of OPC with APS for measuring ambient aerosols=410,412,5
Chapter 4. Accomplishment and contribution to the related field=415,417,1
Section 1. Research objectives of each year=415,417,1
1. Objectives and contents=415,417,1
2. Contents and accomplishment for the first year in the first stage=416,418,1
3. Contents and accomplishment for second year in the first stage=417,419,2
4. Contents and accomplishment for first year in the second stage=419,421,1
5. Contents and accomplishment for first year in the second stage=420,422,1
Section 2. A measure of research accomplishment=421,423,3
Section 3. Contribution to the related field=423,425,2
Chapter 5. Application plan of research results=425,427,1
Section 1. Change of international surrounding=425,427,1
1. Settlement of LA smog=425,427,2
2. Concern in organic component of fine particles=426,428,2
3. Real time monitoring of fine particles=427,429,1
Section 2. Application of the second stage research results=428,430,2
Section 3. Application plan of research results=429,431,1
Section 4. Future research plan=430,432,1
1. Experiment of photochemical reactions using diesel exhaust=430,432,5
2. Experiment of photochemical reactions using biogenic VOCs=435,437,5
3. Research of strategy for smog reduction=439,441,2
Chapter 6. Collection of oversea information related with this research=441,443,1
1. Research trend of University of California,Riverside=441,443,5
2. Research trend of CSIRO,Sydney=445,447,2
3. International workshop on the smog chamber study=446,448,2
4. Research workshop on the environmental aerosols=447,449,2
Chapter 7. References=449,451,35
그림 1-1-1 가스상,입자상 및 액상 대기오염물질의 반응(Meng of al.,1997)=32,34,1
그림 1-1-2 스모그 챔버의 모식도=33,35,1
그림 1-1-3 스모그 챔버 실험의 개념도=35,37,1
그림 1-2-1 Chemical links between the ozone and PM formation processes=36,38,1
그림 1-2-2 시정 변화 추이=38,40,1
그림 1-3-1 연구 개발 추진 계획=43,45,1
그림 2-1-1 Schematic of temperature-controlled enclosure to be used for the environmental chamber and light source=49,51,1
그림 3-1-1 서울지역 5월부터 9월까지 오존 시즌의 아침 9시와 오후 3시,시정이 5km 미만이었던 날 수=60,62,1
그림 3-1-2 5월부터 9월까지 오존 시즌 서울에서 낮 3시 시정이 아침 9시 시정보다 나쁜 날 수=60,62,1
그림 3-1-3 Distribution of visibility monitoring stations in Korea during the 1990s=63,65,1
그림 3-1-4 Visibility trends nationwide and in Seoul=65,67,1
그림 3-1-5 Comparison of visibility distribution for the first and latter 3 years in the 1990s=67,69,1
그림 3-1-6 Distribution of the stations at which the highest and lowest 10 values of the relevant variables occur=69,71,1
그림 3-1-7 Diurnal variations in visibility and relative humidity at four stations in the southeastern coast where the visibility was among the lowest in summer in comparison with those in Seoul during 1990-1992=70,72,1
그림 3-1-8 Distribution of the stations at which the rate of change is the highest and the lowest and at which the visibility is the highest and the lowest. The rate of change was calculated for 1990-1998,and the visibility was calculated for 1996-1998=72,74,1
그림 3-1-9 Grouping the stations. Six groups were defined including Group(M) which signifies the group of the stations in major metropolitan areas denoted by open rectangles=74,76,1
그림 3-1-10 Variations of the visibility in each group=75,77,1
그림 3-1-11 Distinction variations at several stations in comparison with the variations of the remaining others for Groups(M),(C),(S) and (J)=76,78,1
그림 3-2-1 Modeling domain and measurement sites in the greater Seoul area. Closed rectangles denote the National Air Monitoring Stations=84,86,1
그림 3-2-2 Determination of NOx(이미지참조) and VOC emission rates from nitrate,NO₂ and peak ozone isopleths in fall=86,88,1
그림 3-2-3 Comparison of observed and predicted concentrations on an annual basis=89,91,1
그림 3-2-4 (a) Major inorganic ion concentrations in the particle. (b) Seasonal variation of nitrate partition=89,91,1
그림 3-2-5 Isopleths of ion concentration by varying relative humidity and temperature=91,93,1
그림 3-2-6 Isopleths of ion concentration by varying VOC and NOx(이미지참조) emission rates=93,95,1
그림 3-3-1 Locations of the measurement site,Korea Institute of Science and Technology (KIST) and surface weather stations and air monitoring stations in the greater Seoul area=100,102,1
그림 3-3-2 Variations of meteorology and criteria pollutants during the measurement period=101,103,1
그림 3-3-3 Variations of NMHC and fine particle concentrations during the measurement period=104,106,1
그림 3-3-4 Diurnal variations of NMHC classes and total concentration=106,108,1
그림 3-3-5 Correlation between pollutants on the basis of daily average concentration=110,112,1
그림 3-4-1 Schematic diagram of the KIST indoor smog chamber=116,118,1
그림 3-4-2 Front view of the KIST indoor smog chamber=117,119,1
그림 3-4-3 Schematic diagram of the outdoor air supply system=120,122,1
그림 3-4-4 Schematic diagram of the purified air supply system=121,123,1
그림 3-5-1 An arrangement plan of blacklights=123,125,1
그림 3-5-2 Variation of light intensity with the direction in a smog chamber=124,126,1
그림 3-5-3 Comparison of blacklight and sunlight spectra=125,127,1
그림 3-5-4 NO₂광분해율 측정장치의 개략도=126,128,1
그림 3-5-5 KIST 스모그 챔버의 NO₂광분해율=127,129,1
그림 3-5-6 Wall loss of ozone in a 2.5-㎥ Teflon bag=128,130,1
그림 3-5-7 Change in the particle size distribution due to the wall loss in a 5.8-㎥ Teflon film bag filled with ambient air=132,134,1
그림 3-5-8 Natural decay of specific size-ranged particles in a 2.5-㎥ Teflon film bag filled with ambient air=133,135,2
그림 3-5-9 Wall loss rate as a function of particle size in a 2.5-㎥ Teflon film bag filled with ambient air=135,137,1
그림 3-5-10 Wall loss rates by particle size in Teflon bags filled with ambient air,as derived from 4 channel resolution data=136,138,1
그림 3-5-11 Change in wall loss rates with time. Horizontal line represents the time interval=138,140,1
그림 3-5-12 Comparison of wall loss rates with those of previous works=139,141,1
그림 3-5-13 Wall loss correction for particles of 20~300nm in photochemical reactions of ambient air in a 5.8-㎥ Teflon bag on April 16,2004=141,143,1
그림 3-5-14 Experimental procedures for evaluation of wall contamination=148,150,1
그림 3-5-15 Variation of gases concentrations in twin Teflon bags for B2 experiment=152,154,1
그림 3-5-16 Variation of ozone and NOx(이미지참조) concentrations with the irradiation time for Bl,B2,and B5~B8 experiments=153,155,1
그림 3-5-17 Variation of particle concentrations in twin Teflon bags for B6 experiment=158,160,1
그림 3-5-18 Change of particle size distributions with the irradiation time for B6 experiment=159,161,1
그림 3-5-19 Variation of total number and mass concentrations formed during the photochemical reaction of purified air=161,163,1
그림 3-6-1 Schematic diagram of the experimental system=167,169,1
그림 3-6-2 Variation of air temperature in a Teflon bag during the irradiation at k₁=0.49min-1(이미지참조)=170,172,1
그림 3-6-3 Variation of ozone concentration in a Teflon bag during the irradiation at k₁= 0.49min-1(이미지참조)=170,172,1
그림 3-6-4 Initial particle size distributions for the experiments at k₁=0.49 and 0.37min(이미지참조)=173,175,1
그림 3-6-5 Change of particle size distribution with the irradiation time at k₁=0.49 and 0.37min-1(이미지참조)=173,175,3
그림 3-6-6 Variation of particle concentration in a Teflon bag during the irradiation at k₁=0.49 and 0.37min-1(이미지참조)=177,179,2
그림 3-6-7 Variation of air temperature in a Teflon bag during the irradiation at k₁=0.37 and 0.26min(이미지참조)=179,181,1
그림 3-6-8 Variation of ozone concentration in a Teflon bag during the irradiation at k₁=0.37 and 0.26min-1(이미지참조)=180,182,1
그림 3-6-9 Initial particle size distributions for the experiments at k₁=0.26min-1(이미지참조)=180,182,1
그림 3-6-10 Change of particle size distribution with the irradiation time at k₁=0.26min-1(이미지참조)=181,183,2
그림 3-6-11 Variation of particle number concentration in a Teflon bag during the irradiation at k₁=0.26min-1(이미지참조)=183,185,2
그림 3-7-1 Experimental set-up for water vapor reactions in ambient air=191,193,1
그림 3-7-2 Variation of relative humidity in a Teflon bag during the experiment=195,197,1
그림 3-7-3 Variation of gas concentrations in a Teflon bag during the experiment=197,199,2
그림 3-7-4 Initial particle size distributions for water vapor reactions in ambient air=200,202,1
그림 3-7-5 Change of particle size distribution with the run time for Group I=202,204,2
그림 3-7-6 Variation of particle number concentration in a Teflon bag for Group I=203,205,2
그림 3-7-7 Change of particle size distribution with the run time for Croup II=206,208,2
그림 3-7-8 Variation of particle number concentration in a Teflon bag for Group II=208,210,2
그림 3-7-9 상대습도의 변화(2003,겨울)=214,216,1
그림 3-7-10 가스상 물질의 농도 변화(2003,겨울)=215,217,3
그림 3-7-11 입자의 초기 입경분포(2003,겨울)=218,220,1
그림 3-7-12 Group I의 시간에 따른 입자의 입경분포 변화(2003,겨울)=219,221,1
그림 3-7-13 Group II의 시간에 따른 입자의 입경분포 변화(2003,겨울)=220,222,2
그림 3-7-14 Group I의 시간에 따른 입자의 수 농도 변화(2003,겨울)=222,224,1
그림 3-7-15 Group II의 시간에 따른 입자의 수 농도 변화(2003,겨울)=223,225,2
그림 3-7-16 상대습도의 변화(2003,봄)=227,229,1
그림 3-7-17 가스상 물질의 농도 변화(2003,봄)=228,230,3
그림 3-7-18 입자의 초기 입경분포(2003,봄)=231,233,1
그림 3-7-19 Group I의 시간에 따른 입자의 입경분포 변화(2003,봄)=232,234,3
그림 3-7-20 Group II의 시간에 따른 입자의 입경분포 변화(2003,봄)=235,237,2
그림 3-7-21 Group I의 시간에 따른 입자의 수 농도 변화(2003,봄)=237,239,6
그림 3-7-22 Group II의 시간에 따른 입자의 수 농도 변화(2003,봄)=243,245,4
그림 3-8-1 Schematic diagram of twin smog chambers used in this study=252,254,1
그림 3-8-2 Performance comparison of twin smog chambers for 2L2-1 and 2L2-2 experiments=253,255,1
그림 3-8-3 Change in gaseous species concentrations with irradiation time for 2L1-1 experiment=255,257,1
그림 3-8-4 Dependency of ozone production rate on the NO₂photolysis rate=257,259,1
그림 3-8-5 Variation of particle number concentration with the irradiation time=260,262,2
그림 3-8-6 Typical change of particle size distribution with the irradiation time=262,264,1
그림 3-8-7 Dependency of aerosol formation on the initial particle number concentration=263,265,1
그림 3-8-8 Dependency of aerosol formation on the light intensity=264,266,1
그림 3-8-9 Dependency of concentration ratio of toluene/NOx(이미지참조)=266,268,1
그림 3-8-10 Effect of light intensity in twin chamber experiment=268,270,1
그림 3-9-1 Schematic diagram of twin smog chambers used in this study=274,276,1
그림 3-9-2 Variation of particle number concentration with the irradiation time=279,281,1
그림 3-9-3 Typical change of particle size distribution with the irradiation time=281,283,2
그림 3-9-4 Effect of initial particle concentration on the secondary aerosol formation=283,285,1
그림 3-9-5 Effect of initial particle concentration on the ozone formation=284,286,1
그림 3-9-6 Effect of aqueous SO₂reaction on the aerosol formation=285,287,2
그림 3-9-7 Effect of aerosol reduction on the formation of aerosol and ozone=288,290,2
그림 3-9-8 Effect of aerosol removal on the final aerosol concentration=291,293,2
그림 3-9-9 Effect of aerosol removal on the final ozone concentration=293,295,1
그림 3-10-1 Schematic diagram of twin smog chambers used in this study=297,299,1
그림 3-10-2 Effect of initial toluene/NO(이미지참조) concentration ratio(ppbC/ppb) on the ozone formation=301,303,1
그림 3-10-3 Change of toluene and aerosol number concentrations during the irradiation for X groups. (a) XA-2 (b) XB-1=303,305,1
그림 3-10-4 Size distributions of XA-2 and XB-1=304,306,1
그림 3-10-5 Change of toluene and aerosol number concentrations during the irradiation for X groups. (a) YA-1 (b) YB-1=306,308,1
그림 3-10-6 Size distributions of YA-1 and YB-1=307,309,1
그림 3-10-7 Change of toluene and aerosol number concentrations in ambient chambers of YA group=308,310,1
그림 3-10-8 Initial aerosol size distributions in YA group=308,310,1
그림 3-11-1 Possible mechanisms for the reaction of OH radical with toluene=312,314,1
그림 3-11-2 Schematic diagram of the experimental system=313,315,1
그림 3-11-3 Schematic diagram of the gas flow control unit=314,316,1
그림 3-11-4 Variation of air temperature outside the Teflon bag during the irradiation=318,320,1
그림 3-11-5 Change of gaseous species concentrations during the irradiation for A09R10=319,321,1
그림 3-11-6 Effect of initial toluene concentration for To1/NO(이미지참조)=5~6=323,325,1
그림 3-11-7 Effect of initial toluene concentration for To1/NO(이미지참조)=8=324,326,1
그림 3-11-8 Effect of initial toluene concentration for To1/NO(이미지참조)=10~11=326,328,1
그림 3-11-9 Effect of initial toluene concentration and light intensity for To1/NOx(이미지참조)=20=327,329,1
그림 3-11-10 Effect of initial toluene concentration and toluene/NOx(이미지참조) concentration ratio on the maximum ozone concentration=329,331,1
그림 3-11-11 Schematic diagram of the experimental system=333,335,1
그림 3-11-12 Change of gases and aerosol concentrations during the irradiation for A06R06=338,340,1
그림 3-11-13 Aerosol formation and growth during the irradiation for A06R06=339,341,1
그림 3-11-14 Morphology of aerosols formed by photooxidation for A06R06=340,342,1
그림 3-11-15 Change of gases and aerosol concentrations during the irradiation for background test=342,344,1
그림 3-11-16 Effect of initial toluene concentration for To1/NOx(이미지참조)=5~6 and 10~11=345,347,3
그림 3-11-17 Ozone and organic aerosol formation by photooxidation of toluene-NOx(이미지참조)-air mixture=347,349,2
그림 3-11-18 Effect of initial toluene concentration for To1/NOx(이미지참조)=8 and 20=350,352,1
그림 3-11-19 Comparison of experimental and predicted values for D06R20-1=352,354,2
그림 3-11-20 Comparison of experimental and predicted values for A09R10-1=354,356,1
그림 3-11-21 톨루엔/NOx(이미지참조) 혼합물의 광화학 반응에 의해 생성 및 성장한 이차 유기 입자의 형상(SEM 분석)=357,359,1
그림 3-11-22 톨루엔/NOx(이미지참조) 혼합물의 광화학 반응에 의해 생성 및 성장한 이차 유기 입자의 형상(TEM 분석)=358,360,1
그림 3-11-23 SMPS와 SEM image에서의 입경 분포 비교=358,360,1
그림 3-12-1 이차유기 에어로졸의 성장,응집 및 응축 모델링=361,363,1
그림 3-12-2 응축에 의해 성장한 입자의 분할 방법=363,365,1
그림 3-12-3 중간 크기 입자의 분할시 발생하는 2차 moment의 저평가=363,365,1
그림 3-12-4 톨루엔/NO(이미지참조) 혼합물의 광화학 반응 실험의 측정결과와 모사 결과=364,366,2
그림 3-12-5 톨루엔/NO(이미지참조) 혼합물의 광화학 반응 실험에서 두 번째 모드내 응집 효과=366,368,1
그림 3-13-1 Reaction mechanism between unsaturated hydrocarbon compounds and ozone=369,371,1
그림 3-13-2 Schematic diagrams of chamber and sample holder=371,373,1
그림 3-13-3 Compounds detected from small teflon bag in a natural paint sample of by GC-MS[원본불량;p.374]=374,376,1
그림 3-13-4 Degradation profile of a-pinene with ozone concentration using FTIR=376,378,1
그림 3-13-5 Comparison of theoretical and blank ozone concentrations=377,379,1
그림 3-13-6 Comparison of theoretical and real ozone concentrations=378,380,1
그림 3-13-7 (a) Ozone concentration and (b) particle concentration in chamber=379,381,1
그림 3-13-8 Maximum particle concentration at various ozone concentrations=380,382,1
그림 3-13-9 (a) Comparison of particle concentration and particle mass concentration. (b) Particle size distribution at time,t=381,383,1
그림 3-13-10 Secondary organic compounds formed from O₃-terpene compounds=383,385,1
그림 3-14-1 View of the air pollution monitoring station=386,388,1
그림 3-14-2 Schematic diagram of the air pollution monitoring system=387,389,1
그림 3-14-3 Urban aerosol size distributions in Seoul on January 3,2002=391,393,1
그림 3-14-4 Weekly variation of aerosol number and mass concentrations from December 29,2001 to January 4,2002=394,396,1
그림 3-14-5 Daily variation of aerosol number concentration from December 29,2001 to January 4,2002 except January 1,2002=395,397,1
그림 3-14-6 Weekly variation of gaseous concentrations from December 29,2001 to January 4,2002=397,399,1
그림 3-14-7 Relationship between fine particle number concentration and NO₂concentration=398,400,1
그림 3-14-8 Weekly variation of air temperature and relative humidity from December 29,2001 to January 4,2002=399,401,1
그림 3-14-9 Relationship between fine particle number concentration and relative humidity=400,402,1
그림 3-14-10 Relationship between visibility and particle number concentration in the range of 0.1 to 1㎛=402,404,1
그림 3-14-11 Dependency of aerosol size distribution on the visibility=403,405,1
그림 3-14-12 Schematic diagram of the air pollution monitoring system=406,408,1
그림 3-14-13 Weekly variation of aerosol number concentrations from April 27 to May31,2002=408,410,2
그림 3-14-14 Diurnal variation of aerosol number concentrations on February 25,2004=412,414,1
그림 3-14-15 Comparison of aerosol size distributions on February 25,2004=413,415,1
그림 5-4-1 탄소입자와 관련된 대기 물리 화학 반응들의 개념도=431,433,1
그림 5-4-2 디젤 자동차 배출가스 도입부 개념도=433,435,1
그림 5-4-3 Thermodesorber의 개념도=433,435,1
그림 5-4-4 개폐가능한 Teflon 반응백=434,436,1
그림 5-4-5 실제 입자의 여러 가지 형상들의 예=434,436,1
그림 5-4-6 우리나라 산림 분포=438,440,1
그림 5-4-7 대표 수종에 따른 모노테르펜의 구성 성분비=438,440,1
그림 5-4-8 Chemical links between the ozone and PM formation processes=440,442,1
*표시는 필수 입력사항입니다.
| 전화번호 |
|---|
| 기사명 | 저자명 | 페이지 | 원문 | 기사목차 |
|---|
| 번호 | 발행일자 | 권호명 | 제본정보 | 자료실 | 원문 | 신청 페이지 |
|---|
도서위치안내: / 서가번호:

우편복사 목록담기를 완료하였습니다.
*표시는 필수 입력사항입니다.
저장 되었습니다.
