
 대표어
대표어
권호기사보기
| 기사명 | 저자명 | 페이지 | 원문 | 기사목차 |
|---|
결과 내 검색
동의어 포함
목차
표제지=0,1,1
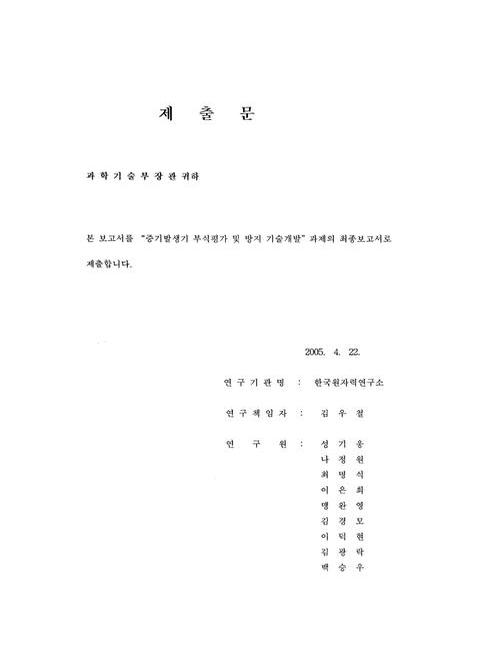
제출문=0,2,1
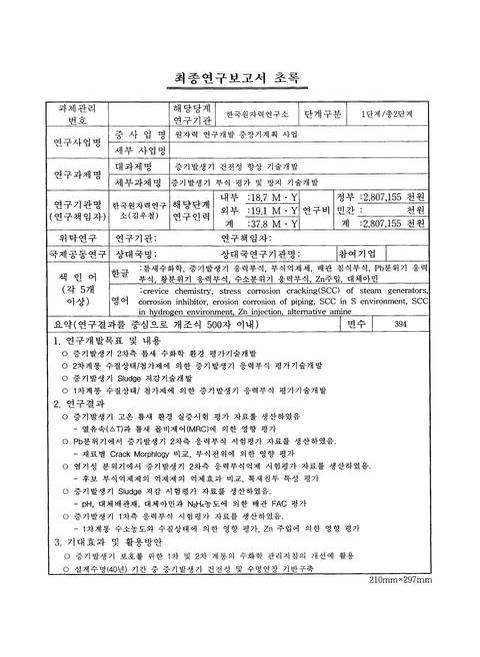
최종연구보고서 초록/김우철=0,3,1
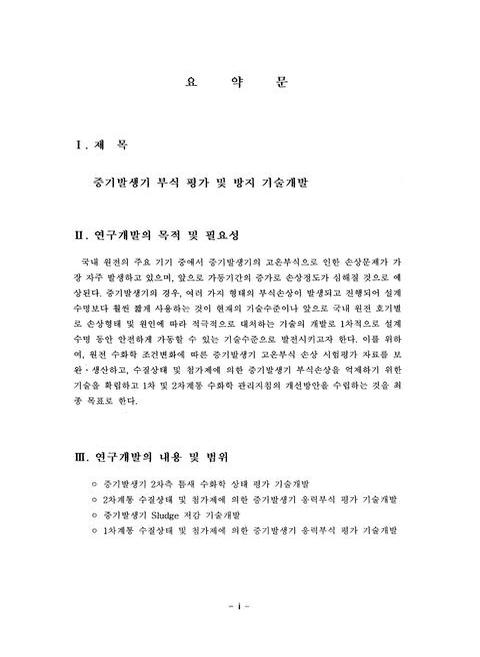
요약문=i,4,8
SUMMARY=ix,12,10
CONTENTS=xix,22,2
목차=xxi,24,4
표목차=xxv,28,2
그림목차=xxvii,30,15
제1장 연구개발과제의 개요=1,45,4
제2장 국내ㆍ외 기술개발 현황=5,49,3
1. 증기발생기 2차측 틈새수화학 환경평가 기술개발=7,51,5
2. 2차계통 수질상태/첨가제에 의한 증기발생기 응력부식 평가 기술개발=12,56,4
3. 증기발생기 Sludge 저감 기술개발=15,59,4
4. 1차계통 수질상태/첨가제에 의한 증기발생기 응력부식 평가 기술개발=18,62,9
제3장 연구개발 수행내용 및 결과=27,71,3
제1절 증기발생기 2차측 틈새수화학 환경평가 기술개발=29,73,1
1. 국내원전 증기발생기 틈새환경 변화추이=29,73,1
가. 몰비지수=29,73,3
나. 국내원전 틈새수화학 평가=31,75,2
2. 고온 틈새환경 평가제어 및 실증시험=33,77,1
가. 틈새 수화학 시험장치=33,77,1
나. 불순물 농축시험=33,77,3
다. 틈새 몰비제어 시험=35,79,2
라. 부식억제제 시험=36,80,3
3. 틈새수화학 감시장치용 기반자료 생산=38,82,1
가. 장치 설계제작=38,82,1
나. 기반자료 실증시험=38,82,2
4. 결론=39,83,3
제2절 2차계통 수질상태/첨가제에 의한 증기발생기 응력부식 평가 기술개발=42,86,1
1. 국내 가동원전 증기발생기 부식손상 진행 및 부식환경 평가=42,86,3
2. Pb 분위기에서 응력부식 시험평가 자료생산=44,88,1
가. 서론=44,88,2
나. 인가전위 CERT 시험=45,89,4
다. RUB 시편 장입 응력부식시험=48,92,3
3. 황이온 성분에 의한 응력부식시험 평가자료 생산=50,94,1
가. 연구배경=50,94,2
나. 실험방법=51,95,1
다. 실험결과 및 고찰=51,95,3
라. 결론=53,97,1
4. 염기성 분위기 응력부식 억제 시험 및 평가=54,98,1
가. 서론=54,98,1
나. 실험방법=54,98,2
다. 실험결과 및 고찰=55,99,3
라. 결론=57,101,2
제3절 증기발생기 Sludge 저감 기술개발=59,103,1
1. 서론=59,103,1
2. Sludge 유입 원인 평가 및 국내외 ETA 적용경험 분석=59,103,2
3. 아민에 의한 배관 재질 FAC 시험평가=60,104,1
가. 배관재질 FAC의 반응기구=60,104,2
나. 배관재질 FAC 실험방법=61,105,2
다. 탄소강 시편의 FAC 산화물 특성=62,106,2
라. 탄소강 시편 무게손실의 유속 의존성=63,107,1
마. 탄소강 및 저합금강 시편 무게손실의 오리피스 거리 의존성=63,107,2
바. 탄소강 및 저합금강 시편 무게손실의 재질 의존성=64,108,2
사. 탄소강 및 저합금강 시편 무게손실의 pH 의존성=65,109,4
아. 탄소강 및 저합금강 시편 무게손실의 pH 제어제 의존성=68,112,1
자. pH 제어제들의 물리 및 화학적 특성=68,112,3
차. 탄소강 FAC의 pH 제어제 의존성=70,114,3
4. Hydrazine 농도 및 부식억제제에 의한 배관 FAC 시험=72,116,1
가. 탄소강 시편 무게손실의 hydrazine 농도 의존성=72,116,3
나. 탄소강 시편의 백금 화합물 담지 특성=74,118,3
5. 터빈 계통 재료에 미치는 유기산 영향=76,120,1
가. 연구배경=76,120,2
나. 터빈 재료 SCC 손상 평가 시험=77,121,4
다. 터빈 재료 부식 피로 손상 평가 시험=80,124,4
6. 결론=83,127,3
제4절 1차계통 수질상태/첨가제에 의한 증기발생기 응력부식 평가 기술개발=86,130,1
1. 1차 계통 수소농도 및 수질상태가 증기발생기와 CRDM 응력부식에 미치는 영향 시험평가 자료생산=86,130,1
가. 연구배경=86,130,2
나. 실험방법=87,131,3
다. 실험결과 및 고찰=89,133,6
라. 결론=94,138,2
2. Zn 주입이 정화장치 성능에 미치는 영향시험 평가자료 생산=95,139,1
가. 연구배경=95,139,2
나. 원전 1차 냉각재의 정화계통 및 혼상수지=96,140,2
다. 원자로급 혼상수지에 의한 아연 흡착시험=97,141,2
라 정화장치 성능에 미치는 영향평가=98,142,2
마. 결론=99,143,1
3. 증기발생기 재료의 응력부식에 미치는 아연 주입의 영향 평가=99,143,1
가. 아연 주입 연구 배경 및 현황=99,143,2
나. PWSCC에 미치는 아연 주입 영향 시험=100,144,2
다. 시험 결과 및 고찰=101,145,6
라. 결론=106,150,213
제4장 연구개발 목표달성도 및 관련분야에의 기여도=319,363,3
1. 증기발생기 2차측 틈새수화학 환경평가 기술개발=321,365,2
2. 2차계통 수질상태/첨가제에 의한 증기발생기 응력부식 평가 기술개발=322,366,1
3. 증기발생기 Sludge 저감 기술개발=322,366,3
4. 1차계통 수질상태/첨가제에 의한 증기발생기 응력부식 평가 기술개발=324,368,1
제5장 연구개발 결과의 활용계획=325,369,3
1. 증기발생기 2차측 틈새수화학 환경평가 기술개발=327,371,1
2. 2차계통 수질상태/첨가제에 의한 증기발생기 응력부식 평가 기술개발=327,371,2
3. 증기발생기 Sludge 저감 기술개발=328,372,1
4. 1차계통 수질상태/첨가제에 의한 증기발생기 응력부식 평가 기술개발=329,373,2
제6장 연구개발과정에서 수집한 해외 과학기술정보=331,375,12
부록=343,387,2
A. Magnetically driven autoclave 시편표면 부위에서의 선속도 계산=345,389,7
영문목차
[title page etc.]=0,1,11
Summary=ix,12,10
Contents=xix,22,6
List of Tables=xxv,28,2
List of Figures=xxvii,30,15
Chapter 1. Introduction=1,45,4
Chapter 2. Current status of research and development=5,49,3
1. Technology to evaluate chemistry conditions in the secondary side crevices of steam generators=7,51,5
2. Stress corrosion cracking of steam generators by the water chemistry and additive chemicals in the secondary system=12,56,4
3. Technology to reduce the formation of sludge on steam generators=15,59,4
4. Stress corrosion cracking of steam generators by the water chemistry and additive chemicals in the primary system=18,62,9
Chapter 3. Contents and results of the project=27,71,3
1. Technology to evaluate chemistry conditions in the secondary side crevices of steam generators=29,73,13
2. Stress corrosion cracking of steam generators by the water chemistry and additive chemicals in the secondary system=42,86,17
3. Technology to reduce the formation of sludge on steam generators=59,103,27
4. Stress corrosion cracking of steam generators by the water chemistry and additive chemic실s in the primary system=86,130,233
Chapter 4. Achievement of project objectives=319,363,3
1. Technology to evaluate chemistry conditions in the secondary side crevices of steam generators=321,365,2
2. Stress corrosion cracking of steam generators by the water chemistry and additive chemicals in the secondary system=322,366,1
3. Technology to reduce the formation of sludge on steam generators=322,366,3
4. Stress corrosion tracking of steam generators by the water chemistry and additive chemicals in the primary system=324,368,1
Chapter 5. Plans for application of results=325,369,3
1. Technology to evaluate chemistry conditions in the secondary side crevices of steam generators=327,371,1
2. Stress corrosion cracking of steam generators by the water chemistry and additive chemicals in the secondary system=327,371,2
3. Technology to reduce the formation of sludge on steam generators=328,372,1
4. Stress corrosion cracking of steam generators by the water chemistry and additive chemicals in the primary system=329,373,2
Chapter 6. References=331,375,12
Appendices=343,387,9
Fig. 2-1-1 CLARINETTE facility flow sheet from J. L. Campan.(2-1-4)=20,64,1
Fig. 2-1-2 Heated crevice monitorfrom J. B. Lumsden.(2-1-5)=21,65,1
Fig. 2-1-3 Model boiler at Ohi unit 1 from H. Takamatsu.(2-1-6)=22,66,1
Fig. 2-3-1 World-wide experience of the flow accelerated corrosion damage to LWR secondary-side Piping (2-3-1)=23,67,1
Fig. 2-3-2 A recent pipe rupture accident occurred at the position just after a flow-meter with an orifice-typed device,reported in 2004(2-3-3).=24,68,1
Fig. 2-3-3 EDF Data of relative FAC rate of carbon steel at 235℃,dependent on hydrazine concentration with DO less than 5 ㎍/㎏ under 5 or 10 m/sec(from M. Merilo et al.)(2-3-14)=24,68,1
Fig. 2-3-4 Observed and predicted relationships of crack growth rate verse corrosion potential for furnace sensitized type 304 SS(2-3-15)=25,69,1
Fig. 3-1-1 Schematic diagram for mass balance in steam generator=134,178,1
Fig. 3-1-2 Molar ratio index profile with cycle at K site.=135,179,1
Fig. 3-1-3 Molar ratio index profile with cycle at Y site.=136,180,1
Fig. 3-1-4 Mo13r ratio index profile with cycle at U site.=137,181,1
Fig. 3-1-5 Crevice chemistry Analysis and Simulation System=138,182,1
Fig. 3-1-6 Schematic of crevice vessel=139,183,1
Fig. 3-1-7 Concentration model in crevice=140,184,1
Fig. 3-1-8 Thermodynamically-limited transient.=141,185,1
Fig. 3-1-9 Location of the thermocouples in crevice=142,186,1
Fig. 3-1-10 Liquid penetration depth with superheat.=143,187,1
Fig. 3-1-11 Concentration factor and pH with boiling point elevation of NaOH solution.=144,188,1
Fig. 3-1-12 Electrochemical potential with concentration factor of NaOH solution=145,189,1
Fig. 3-1-13 Temperature profile with △T:25℃ and feed water with 40 wppm NaOH=146,190,1
Fig. 3-1-14 Electrochemical potential profile with △T:20℃ and feed water with 40 wppm NaOH=147,191,1
Fig. 3-1-15 Temperature profile with △T:20℃ and feed water with 40 wppm NaOH=148,192,1
Fig. 3-1-16 Electrochemical potential profile with △T:20℃ and feed water with 40 wppm NaOH.=149,193,1
Fig. 3-1-17 Soubility of NH₄Cl in water=150,194,1
Fig. 3-1-18 pH of 53.5 wppm NH₄Cl solution.=151,195,1
Fig. 3-1-19 ECP of 53.5 wppm NH₄Cl solution=152,196,1
Fig. 3-1-20 pH of 5.35 wppm NH₄Cl solution=153,197,1
Fig. 3-1-21 ECP of 5.35 wppm NH₄Cl solution.=154,198,1
Fig. 3-1-22 Concentration factor and pH with boiling point elevation of 5.35 wppm-NH₄Cl solution=155,199,1
Fig. 3-1-23 Temperature profile with △T:25℃ and feed water with 53.5 wppm NH₄Cl.=156,200,1
Fig. 3-1-24 Electrochemical potential profile with △T:25℃ and feed water with 53.5 wppm NH₄Cl=157,201,1
Fig. 3-1-25 Temperature profile with △T:25℃ and feed water with 5.3 wppm NH₄Cl after NaOH concentration=158,202,1
Fig. 3-1-26 Electrochemical profile with △T:25℃ and feed water with 5.3 wppm NH₄Cl after NaOH concentration=159,203,1
Fig. 3-1-27 Soubility of H₃BO₃ in water=160,204,1
Fig. 3-1-28 pH of boric acid solution=161,205,1
Fig. 3-1-29 Electrochemical potential of 50 wppm B solution with temperature=162,206,1
Fig. 3-1-30 Concentration factor and pH with boiling point elevation of boric acid solution.=163,207,1
Fig. 3-1-31 Electrochemical potential of 50 wppm boron solution with concentration factor.=164,208,1
Fig. 3-1-32 Temperature profile with △T:25℃ and feed water with 50 wppm B as H₃BO₃=165,209,1
Fig. 3-1-33 Electrochemical profile with △T:25℃ and feed water with 50 wppm B as H₃BO₃=166,210,1
Fig. 3-1-34 Temperature profile with △T:20℃ and feed water with 50 wppm B as H₃BO₃=167,211,1
Fig. 3-1-35 Electrochemical profile with △T:20℃ and feed water with 50 wppm B as H₃BO₃=168,212,1
Fig. 3-1-36 Electrochemical potential profile during ECP measurement=169,213,1
Fig. 3-1-37 Temperature profile during ECP measurement=170,214,1
Fig. 3-1-38 Temperature profile with △T:25℃ and feed water after H₃BO₃Concentration=171,215,1
Fig. 3-1-39 Electrochemical profile with △T:25℃ and feed water after H₃BO₃Concentration=172,216,1
Fig. 3-1-40 Temperature Profile with △T:10℃ and feed water after H₃BO₃Concentration=173,217,1
Fig. 3-1-41 Electrochemical potential profile with △T:10℃ and feed water after H₃BO₃concentration=174,218,1
Fig. 3-1-42 Temperature profile with △T:25℃ and feed water with 50 wppm B as H₃BO₃.after NaOH concentration.=175,219,1
Fig. 3-1-43 Electrochemical profile with △T:25℃ and feed water with 50 wppm B as H₃BO₃ after NaOH concentration=176,220,1
Fig. 3-1-44 Temperature profile with △T:20℃ and feed water with 50 wppm B as H₃BO₃ after NaOH concentration=177,221,1
Fig. 3-1-45 Electrochemical profile with △T:20℃ and feed water with 50 wppm B as H₃BO₃ after NaOH concentration.=178,222,1
Fig. 3-1-46 Schematic diagram of ECP measurement loop.=179,223,1
Fig. 3-1-47 Potential of YSZ electrode to SHE.=179,223,1
Fig. 3-1-48 pH of 8% NaOH solution with weight % of B.=180,224,1
Fig. 3-1-49 ECP profile of 8% NaOH solution.=181,225,1
Fig. 3-1-50 ECP profile of 8% NaOH + 1% B solution.=182,226,1
Fig. 3-1-51 ECP profile of 8% NaOH + 2% B solution.=183,227,1
Fig. 3-2-1 Removed sludge of steam generator A at Kori unit 1,2,3 and 4.=184,228,1
Fig. 3-2-2 Removed sludge of steam generator A at Yonggwang unit 1,2,3 and 4=184,228,1
Fig. 3-2-3 Removed sludge of steam generator A at Ulchin unit 1,2,3 and 4=185,229,1
Fig. 3-2-4 Dimension of the CERT Specimen.(unit:mm)=185,229,1
Fig. 3-2-5 Results of CERT tests in the condition of applied potentials=186,230,1
Fig. 3-2-6 continue.=186,230,1
Fig. 3-2-7 SEM micrograph of Alloy 600 MA after SSRT in water containing 1000 ppm Pb at 300℃,pH 10,strain rate of 2 × 10⁻⁷ sec-1,potential of -500 mV vs Ag/AgCl.(이미지참조)=187,231,1
Fig. 3-2-8 SEM micrograph of Alloy 600 MA after SSRT in water containing 1000 ppm Pb at 300℃,pH 10,strain rate of 2 × 10⁻⁷ sec-1,potential of -650 mV vs Ag/AgCl(이미지참조)=187,231,1
Fig. 3-2-9 SEM micrograph of Alloy 600 MA after SSRT in water containing 1000 ppm Pb at 300℃,pH 10,strain rate of 2 × 10⁻⁷ sec-1,potential of -700 mV vs Ag/AgCl(이미지참조)=188,232,1
Fig. 3-2-10 SEM micrograph of Alloy 600 MA after CERT test in solution of pH 10 distilled water containing 1,000 ppm Pb at 300℃ ,under applied potential of -850 mV vs Ag/AgCl(이미지참조)=188,232,1
Fig. 3-2-11 SEM micrograph of Alloy 600 MA after SSRT test in solution of pH 10 distilled water containing 1,000 ppm Pb at 300℃ ,under applied potential of -900 mV vs Ag/AgCl=189,233,1
Fig. 3-2-12 SEM micrograph of Alloy 600 MA after SSRT test in solution of pH 10 distilled water containing 1,000 ppm Pb at 300℃ ,under applied potential of -950 mV vs Ag/AgCl=189,233,1
Fig. 3-2-13 SEM micrograph of Alloy 600 MA after SSRT test in solution of pH 10 distilled water containing 1,000 ppm Pb at 300℃ ,under applied potential of -1100 mV vs Ag/AgCl=190,234,1
Fig. 3-2-14 SEM micrograph of Alloy 600 MA after SSRT test in solution of pH 7 distilled water containing 1,000 ppm Pb at 300℃,under applied potential of -750 mV vs Ag/AgCl=190,234,1
Fig. 3-2-15 Potential effect on %SCC area of Alloy 600MA in Pb containing environment=191,235,1
Fig. 3-2-16 Potential effect on the SCC of Alloy 600 MA in a PH 10 solution containing 1,000 ppm Pb at 300℃=191,235,1
Fig. 3-2-17 Schematic drawing and dimensions of the modified reverse U-bend (RUB) specimen.(Unit: mm)=192,236,1
Fig. 3-2-18 Results of the SCC tests with the RUB specimens in 10% NaOH solution without any additives at 315℃.=192,236,1
Fig. 3-2-19 Results of the SCC tests with the RUB specimens in 10% NaOH solution at 315℃ with (a) 1,000 Prm PbO (b) 1,000 ppm PbO+SiO₂.=193,237,1
Fig. 3-2-20 Crack morphology of the steam generator tube materials tested in 10% NaOH solution at 315℃=194,238,1
Fig. 3-2-21 Crack morphology of the steam generator tube materials tested in 10% NaOH solution containing 1,000 ppm Pb at 315℃=195,239,1
Fig. 3-2-22 SEM micrographs of SCC tests with RUB specimens in solution of 10% NaOH,315℃ with 1,000 ppm PbO.=196,240,1
Fig. 3-2-23/Fig. 3-2-31 Polarization curves of Alloy 600 MA,Alloy 690 TT,and Alloy 800 MA in deaerated (a) 0.01 M and (b) 0.1 M Na₂SO₄ solutions at 300℃=197,241,1
Fig. 3-2-24/Fig. 3-2-32 SEM micrographs of Alloy 600 MA in deaerated 0.01 M (a) Na₂SO₄ and (b) Na₂S₂O₃ Solutions at 340℃=198,242,1
Fig. 3-2-25 Schematic drawing of specimen with different crevice gaps.=199,243,1
Fig. 3-2-26 Particle diameter distribution of TiO₂ Powder from the LS particle size analyzer test.=199,243,1
Fig. 3-2-27 Results of SCC tests with RUB specimens in condition of 10% NaOH solution at 315℃ with (a) TiO₂(P25) 1 g/L (b) CeB6(이미지참조) 1g/L (c) TyzorLA 1 g/L (d) TiO₂ anatase form 1 g/L=200,244,1
Fig. 3-2-28 Crack morphology of steam generator tube materials tested in a 10% NaOH solution at 315℃ with TiO₂(P2S) 1 g/L.=201,245,1
Fig. 3-2-29 Specimen surface photograph tested in 10% NaOH,at 315℃=202,246,1
Fig. 3-2-30 Specimen surface photograph tested in 10% NaOH with 1 g/L TiO₂(P25),at 315℃=203,247,1
Fig. 3-2-31 Specimen surface Photograph tested in 10% NaOH with 1 g/L CeB6(이미지참조),at 315℃=204,248,1
Fig. 3-2-32 AES depth profiles of the elements in the film formed on Alloy 600 with addition of CeB6(이미지참조) (a)(c)(d) on the edge of specimen(fig. 3-2-30) tested in 1 % NaOH solution at 150℃,and (b) on the surface of mRUB tested in 10% NaOH solutio=205,249,1
Fig. 3-2-33 AES depth profiles of the elements in the film formed on Alloy 600 with addition of CeB6(이미지참조) on the middle of specimen(fig. 3-2-30) tested in 1 % NaOH solution at 150℃=206,250,1
Fig. 3-2-34 AES depth profiles of the elements in the film formed on Alloy 600 in 1% NaOH solution at 150℃ (a) without any additives and (b) with 2 g/L TiO₂=207,251,1
Fig. 3-3-1 Estimation of metallic ions in rinse wastes after chemical cleaning,showing magnetite-rich sludge in a domestic nuclear power plant(K)=208,252,1
Fig. 3-3-2 Chemical composition ratio of hard and soft sludge in a domestic nuclear power plant(K)=209,253,1
Fig. 3-3-3 Power increase after ETA application mainly due to fouling reduction at domestic and oversea nuclear power plants=210,254,1
Fig. 3-3-4 ron concentration reduction at the local areas of secondary system due to the amount of ETA at a domestic nuclear power plant(K)=211,255,1
Fig. 3-3-5 The measured concentrations of organic acids generated by ETA decomposition in some local areas of the secondary system at a domestic nuclear power plant(K)=212,256,1
Fig. 3-3-6 Schematic diagram of an Erosion-Corrosion Test Loop=213,257,1
Fig. 3-3-7 Schematic diagram of the Erosion-Corrosion Test Specimen=214,258,1
Fig. 3-3-8 SEM micrographs of the carbon steel(CS) after 500 hours at pH 9.0 under the flow velocity of 4 m/sec(A),and the original one(B)=215,259,1
Fig. 3-3-9 Fe2p(이미지참조) XPS spectrum in Fe₃O₄ formed on the carbon steel(CS) after 500 hours at pH 8.5 and 9.5 under the flow velocity of 4 m/sec.=216,260,1
Fig. 3-3-10 XRD patterns of the carbon steel at pH 8.50(A) and 9.50(B) at 130℃ under the flow velocity of 4 m/sec.=217,261,1
Fig. 3-3-11 Weight loss of the carbon steel after 500 hours at 20.4 mm from the orifice,dependent under the flow velocities of 4 and 9 m/sec.=218,262,1
Fig. 3-3-12 Weight loss of the specimens of carbon steel(CS) and low-alloy steels (P11 and P22) at pH 8.0,9.0,9.5 and 10.0,dependent on the materials at 130℃ after 500 hours,versus the distance of the orifice=219,263,1
Fig. 3-3-13 Regressed curves of the weight loss of CS,P11 and P22 after 500 hours at pH 9.0 and 130℃ ,dependent on the orifice distance.=220,264,1
Fig. 3-3-14 Turbulent pipe with separation(complex velocity field with reverse flow)=221,265,1
Fig. 3-3-15 Cr2p(이미지참조) XPS spectrum in Cr₂O₃ formed on the carbon steel and the low-alloy steels(P11 and P22) after 500 hours at pH 9.75 under the flow velocity of 4 m/sec.=222,266,1
Fig. 3-3-16 X-ray diffraction patterns of the carbon steel(A),P11(B) and P22(C) after 500 hours at pH 9.75 and 130℃ under the flow velocity of 4 m/sec=223,267,1
Fig. 3-3-17 Weight loss of the specimens of CS,P11 and P22 after 500 hours at 20.4 and 27.2 mm from the orifice and 130℃,dependent on the material=224,268,1
Fig. 3-3-18 Regressed curves of the weight loss of CS,P11 and P22 at 20.4mm from the orifice at 130℃,dependent on the material=225,269,1
Fig. 3-3-19 Weight loss of the specimens of carbon steel(CS) and low-alloy steels(P11: 1Cr-1/2Mo,P22: 21/4Cr-1Mo)(이미지참조) at 20.4 mm from the orifice,dependent on the pH and material at 130℃ after 500 hours=226,270,1
Fig. 3-3-20 Contributions of the individual soluble iron species to the total magnetite solubility in an aqueous solution,calculated at 130℃,dependent on pH=227,271,1
Fig. 3-3-21 Dissolved iron concentration in the aqueous solution of the test loop at pH 8~10 after 500 hour-testing=228,272,1
Fig. 3-3-22 Weight loss of the specimens of carbon steel and low-alloy steel at 20.4 mm from the orifice under the flow velocity of 4 m/sec in the pH range of 10~11 controlled with LiOH at 130℃ during 500 hours,particularly,dependent on the material c=229,273,1
Fig. 3-3-23 Weight loss of the specimens of carbon steel and low-alloy steel at 20.4 mm from the orifice under the flow velocities of 4 m/sec and 9 m/sec. in the pH range of 10~11 controlled with LiOH at 130℃ during 500 hours,particularly,dependent o=230,274,1
Fig. 3-3-24 Weight loss of the specimens of carbon steel and low-alloy steel at 20.4 mm from the orifice under the flow velocity of 4 m/sec. in the pH range of 10~11 controlled with LiOH at 130℃ during 500 hours,particularly,dependent on pH at 25℃ an=231,275,1
Fig. 3-3-25 Final concentration of the soluble iron species dissolved in the aqueous solution of the test loop at the pH range of 10~11 controlled with LiOH at 130℃ during 500 hours,particularly.=232,276,1
Fig. 3-3-26 The base strengths(Kb) of seven chemical species thermodynamically calculated with the concentration of 10 ppm=233,277,1
Fig. 3-3-27 Relative volatilities(RV) of ammonia,morpholine,ETA,MPA and pyrrolidine thermodynamically calculated with the concentration of 10 ppm=234,278,1
Fig. 3-3-28 The distribution coefficients(Kd) of ammonia,morpholine,ETA,MPA and pyrrolidine thermodynamically calculated with the concentration of 10 ppm=235,279,1
Fig. 3-3-29 Decomposition rates of morpholine,ETA and MPA at 286℃,plotted from the data in Reference(3-3-2)=236,280,1
Fig. 3-3-30 Decomposition rates of morpholine,ETA and MPA in the temperature range of 140~280℃ ,plotted from the data In Reference(3-3-2)=237,281,1
Fig. 3-3-31 Decomposition of morpholine proposed In Reference(3-3-2)=238,282,1
Fig. 3-3-32 At-temperature pHs of the pH controlling agents when the pH at 25℃ is 9.0=239,283,1
Fig. 3-3-33 pHs at 130℃ of the pH controlling agents when the pH at 25℃ is 9.0=240,284,1
Fig. 3-3-34 Experimental specific weight loss of the carbon steel specimen at PH130℃(이미지참조) of 6.78 controlled with five pH-controlling agents in de-oxygenated aqueous solution under flow velocity of 4 and 9 m/sec. at 130℃,including the regressiv=241,285,1
Fig. 3-3-35 Final concentration of the soluble iron species dissolved in the aqueous solution of the test loop at the pH130℃(이미지참조) of 6.78 controlled with five pH controlling agents at 130℃ during 500 hours,particularly=242,286,1
Fig. 3-3-36 Relative(to an arbitrary and historical fouling rate database) tube bundle fouling rate of magnetite particles for various water treatment chemicals. ETA=ethanolamine; Morph=morpholine; Pyrr=pyrrolidine; MPA=methoxypropylamine; 4AB:4 aminobu=243,287,1
Fig. 3-3-37 Schematic diagram of High Temperature Magnetically Driven Autoclave System used=244,288,1
Fig. 3-3-38 Photograph of Erosion-Corrosion Test Loop,including High Temperature Autoclave System.=245,289,1
Fig. 3-3-39 Photograph of the rotating blade and the specimen bundle in High Temperature Autoclave System=246,290,1
Fig. 3-3-40 Hydrazine concentration dependency on FAC of carbon steel(A106 Gr. B) after 500 hour tests at 250℃ in de-oxygenated solution(DO < 2 ppb) of pH25℃(이미지참조) 9.0 with ammonia=247,291,1
Fig. 3-3-41 Schematic diagram of a doping apparatus=248,292,1
Fig. 3-3-42 XPS-EDX(x 5000) of a platinum cluster(a white point in the yellow circle) doped on the surface of each specimen of carbon steel,stainless steel and alloy 600 TT after 24 hour-water bathing at 80℃=249,293,1
Fig. 3-3-43 Schematic showing typical locations and orientations of cracks in various U. S. low-pressure rotor disks.=250,294,1
Fig. 3-3-44 Example of turbine components failures in local plants=251,295,1
Fig. 3-3-45 CERT apparatus for SCC tests=252,296,1
Fig. 3-3-46 Geometry of CERT test specimen.=253,297,1
Fig. 3-3-47 Effects of pH(acetic acid) on Stress-strain curves of turbine steels tested in water at 150℃=254,298,1
Fig. 3-3-48 Effects of pH(acetic acid) on the failure morphology of turbine steels tested in water at 150℃=255,299,1
Fig. 3-3-49 Effects of pH(acetic acid) on the morphology of fracture surfaces of turbine steels tested in water at 150℃=256,300,1
Fig. 3-3-50 Effects of pH(acetic acid) on the SCC ratio in fracture surfaces of turbine steels tested in deaerated water at 150℃=257,301,1
Fig. 3-3-51 Effects of pH(acetic acid) on the elongation of turbine steels tested in deaerated water at 150℃=258,302,1
Fig. 3-3-52 Effects of pH(acetic acid) on the reduction in area(%) of turbine steels tested in deaerated water at 150℃=259,303,1
Fig. 3-3-53 Cracking morphologies as a function of solution pH in deaerated water at 150℃ (pH control: acetic acid)=260,304,1
Fig. 3-3-54 Reduction in area(%) of turbine steels tested in deaerated water at 150℃ as a function of acetic acid concentration(ppm,pH control: acetic acid)=261,305,1
Fig. 3-3-55 Effects of PH(formic acid) on Stress-strain curves of turbine steels tested in water at 150℃=262,306,1
Fig. 3-3-56 Stress corrosion crack growth behavior of turbine steels tested in deaerated water at 150℃ (pH control: formic acid,pH 3.41: intergranular,pH 3.08: transgranular)=263,307,1
Fig. 3-3-57 Effects of pH(acetic acid) on the polarization curves of turbine steels tested in deaerated water at 150℃=264,308,1
Fig. 3-3-58 Effects of pH(formic acid) on the polarization curves of turbine steels tested in deaerated water at 150℃=265,309,1
Fig. 3-3-59 (a) SCC Initiation from the Corrosion Pits and (b) SCC growth from the place of fracture of surface oxide(Turbine Steels tested in deaerated water at 150℃,pH=4.13,PH control: acetic acid)=266,310,1
Fig. 3-3-60 Effects of pH on the corrosion fatigue crack growth length of turbine steels in deaerated water at 150℃ . (pH control: acetic acid)=267,311,1
Fig. 3-3-61 Effects of acetic acid on the corrosion fatigue crack growth rate of turbine steels in deaerated water at 25℃ . (pH control: acetic acid)=268,312,1
Fig. 3-3-62 Effects of pH on the corrosion fatigue crack growth rate of turbine steels in deaerated water at 150℃ . (PH control: acetic acid)=269,313,1
Fig. 3-3-63 Effects of pH on the fracture surface morphologies of turbine steels. (corrosion fatigue tested in deaerated water at 150℃,pH control: acetic acid)=270,314,1
Fig. 3-4-1 Microstructure of alloy 600 CRDM nozzle material=271,315,1
Fig. 3-4-2 Dimension of tensile specimen for constant extension rate test.=271,315,1
Fig. 3-4-3 Microstructure of alloy 600LTMA steam generator tube material.=272,316,1
Fig. 3-4-4 Changes of hydrogen partial pressure with temperature in simulated MOC and EOC water chemistry.=273,317,1
Fig. 3-4-5 Stress-strain curves from CERT in simulated MOC water chemistry at 330℃ with various dissolved hydrogen contents.=274,318,1
Fig. 3-4-6 Fractographs and IGSCC area of CERT specimens in simulated MOC water chemistry=275,319,1
Fig. 3-4-7 Stress-strain curves from CERT in simulated EOC water chemistry at 330℃ with various dissolved hydrogen contents=276,320,1
Fig. 3-4-8 Fractographs and IGSCC area of CERT specimens in simulated EOC water chemistry=277,321,1
Fig. 3-4-9 Dependence of crack growth rate on hydrogen contents in simulated MOC and BOC water chemistry around the operation temperature=278,322,1
Fig. 3-4-10 Summary plot of CER data,on a scc/kg hydrogen basis(4-3-9)=279,323,1
Fig. 3-4-11 Effects of hydrogen concentration and temperature on Ni/NiO phase stability and peak crack growth rate for PWSCC in Alloy 600(4-3-1)=280,324,1
Fig. 3-4-12 Summary of crack initiation test using modified RUB specimens.=281,325,1
Fig. 3-4-13 Morphology of crack in modified RUB specimens after 3,000 hours exposure to simulated primary water with the hydrogen concentration of 35 ccSTP/kg-water=282,326,1
Fig. 3-4-14 Morphology of crack in modified RUB specimens after 3,000 hours exposure to simulated primary water with the hydrogen concentration of 50 ccSTP/kg -water=283,327,1
Fig. 3-4-15 Effect of hydrogen concentration on time to PWSCC crack initiation at 330℃ (3-4-1)=284,328,1
Fig. 3-4-16 Chemical and Volume Control System in PWR.=284,328,1
Fig. 3-4-17 Break through curves for different temperature in the adsorption of Zn on Amberlite IRN150 and IRN217 from aqueous Zn(CH₃CO₂)₂ solution(Inlet concentration: 1000 ppm Zn,Bed volume: 19 mL)=285,329,1
Fig. 4-4-18 Break through curves for different flow rate in the adsorption of Zn on Amberlite IRN150 and IRN217 from aqueous Zn(CH₃CO₂)₂solution(Inlet concentration: 1000 ppm Zn,Bed volume: 19 mL)=285,329,1
Fig. 3-4-19 Adsorption rate of Zn on Amberlite IRN150 and IRN217 from aqueous Zn(CH₃CO₂)₂ solution(Initial concentration: 100 ppm Zn,Solution volume: 1.5 L,Resin amount: 5 g)=286,330,1
Fig. 3-4-20 Time to reach break-point vs. coolant zinc concentration=286,330,1
Fig. 3-4-21 CERT apparatus and Loop system for PWSCC tests=287,331,1
Fig. 3-4-22 Geometry of Hump specimen.=288,332,1
Fig. 3-4-23 Stress-strain curves of Alloy 600(B,shoulder released) tested in ZnO injected water at 360℃.=289,333,1
Fig. 3-4-24 Effect of Zn concentration on the fracture surface morphologies of Alloy 600(B,shoulder released) tested in ZnO injected water at 360℃(strain rate: 2.Sx10-7 /sec)(이미지참조)=290,334,1
Fig. 3-4-25 PWSCC area ratio(%) and crack growth rate of Alloy 600(B,shoulder released) in ZnO injected water at 360℃(strain rate: 2.5x10⁻⁷ /sec).(이미지참조)=291,335,1
Fig. 3-4-26 Effect of Zn concentration on the fracture surface morphologies of Alloy 600(B,shoulder released) tested in ZnO injected water at 360℃(strain rate: Sx10-7 /sec).(이미지참조)=292,336,1
Fig. 3-4-27 PWSCC area ratio(%) and crack growth rate of Alloy 600(B,shoulder released) in ZnO injected water at 360℃(strain rate: Sx10-7 /sec).(이미지참조)=293,337,1
Fig. 3-4-28 Stress-strain curves of Alloy 600(C,shoulder released) tested in ZnO injected water at 360℃.=294,338,1
Fig. 3-4-29 Effect of Zn concentration on the fracture surface morphologies of Alloy 600(C,shoulder released) tested in ZnO injected water at 360℃(strain rate: 2.5x10⁻⁷ /sec).(이미지참조)=295,339,1
Fig. 3-4-30 Effect of Zn concentration on the fracture surface morphologies of Alloy 600(C,shoulder released) tested in ZnO injected water at 360℃(strain rate: 5x10⁻⁷ /sec).=296,340,1
Fig. 3-4-31 Stress-strain curves of Alloy 600(B,shoulder fixed) tested in Zinc borate injected deaerated water at 360℃.=297,341,1
Fig. 3-4-32 Effect of Zn concentration on the fracture surface morphologies of Alloy 600(B,shoulder fixed) tested in Zinc borate injected water at 360℃(strain rate: 2.5x10⁻⁷ /sec)(이미지참조)=298,342,1
Fig. 3-4-33 Effect of Zn concentration on the fracture surface morphologies of Alloy 600(B,shoulder fixed) tested in Zinc borate injected water at 360℃(strain rate: 5x10⁻⁷/sec).(이미지참조)=299,343,1
Fig. 3-4-34 Initiation and crack growth in hump specimens during CERT tests=300,344,1
Fig. 3-4-35 Residual stress distribution after bending to hump type specimen.(x: longitudinal,y: lateral).=301,345,1
Fig. 3-4-36 Longitudinal (x) and lateral (y) stress distribution when the hump specimen is pulled by 2 m (7% elongation) in longitudinal direction.=302,346,1
Fig. 3-4-37 Variation of longitudinal (y) and lateral (x) stress when the hump specimen is pulled by 2 m(7% elongation) in longitudinal direction.=303,347,1
Fig,3-4-38 Shape of stress-strain curve in 3 different conditions=304,348,1
Fig. 3-4-39 Fracture surfaces showing different cracking behavior for the similar shape of stress-strain curve during hump tests=305,349,1
Fig. 3-4-40 Effects of strain rates on the stress-strain curves of Alloy 600 tested in deaerated water at 360℃.=306,350,1
Fig. 3-4-41 Effects of strain rates on the SCC ratio in fracture surface of Alloy 600 tested in deaerated water at 360℃=307,351,1
Fig. 3-4-42 Effects of cold work on the stress-strain curves of Alloy 600 tested in deaerated water at 360℃(50 ppb Zn,strain rate: 5x10⁻⁷ /sec)(이미지참조)=308,352,1
Fig. 3-4-43 Effects of cold work on the SCC ratio in fracture surface of Alloy 600 tested in deaerated water at 360℃(50 ppb Zn,strain rate: 5x10⁻⁷ /sec)(이미지참조)=309,353,1
Fig. 3-4-44 Effects of temperature on the stress-strain curves of Alloy 600 tested in deaerated water at 360℃(50 pub Zn,strain rate: 5x10⁻⁷ /sec)(이미지참조)=310,354,1
Fig. 3-4-45 Effects of temperature on the SCC ratio in fracture surface of Alloy 600 tested in deaerated water at 360℃(50 ppb Zn,strain rate: 5x10 7 /sec)(이미지참조)=311,355,1
Fig. 3-4-46 Effect of zinc injection(ZnO) on the surface oxide structure of Alloy 600 formed In zinc injected deaerated water at 360℃(strain rate: 5x10⁻⁷ /sec)(이미지참조)=312,356,1
Fig. 3-4-47 Effect of zinc injection(ZnO) on the surface oxide structure of Alloy 600 formed in zinc injected deaerated water at 360℃(strain rate: 2.5x10⁻⁷ /sec).=313,357,1
Fig. 3-4-48 Magnified microstructure of surface oxide on Alloy 600 tested in deaerated water at 360℃(50 ppb ZnO dissolved,172 hrs)=314,358,1
Fig,3-4-49 Preperation of TEM specimens by FIB(Focused ion Beam) and Observation of oxide layers of Alloy 600 tested in deaerated water at 360℃(50 ppb ZnO dissolved,172 hrs).=315,359,1
Fig. 3-4-50 TEM EDS analysis for Zn implementation in oxide layer of Alloy 600 tested in deaerated water at 360℃(50 ppb ZnO dissolved,172 hrs)=316,360,1
Fig. 3-4-51 Zn implementation in oxide of Alloy 600 tested in deaerated water at 360℃(10 ppb Zn dissolved)=317,361,1
Fig. 3-4-52 Effects of Zn injection on the thickness of surface oxide of Alloy 600 in water at 360℃.=318,362,1
Fig. A-1 Schematic diagram of the Magnetically-Driven Autoclave system.=349,393,1
Fig. A-2 Calculation lattice=350,394,1
Fig. A-3 Velocity distribution(2500 rpm).=350,394,1
Fig. A-4 Pressure distribution(2500 rpm).=351,395,1
Fig. A-5 Velocity distribution(1500 rpm).=351,395,1
jpg
Fig. 3-1-23 Temperature profile with △T:25℃ and feed water with 53.5 wppm NH₄Cl.=156,200,1
Fig. 3-1-24 Electrochemical potential profile with △T:25℃ and feed water with 53.5 wppm NH₄Cl=157,201,1
Fig. 3-1-25 Temperature profile with △T:25℃ and feed water with 5.3 wppm NH₄Cl after NaOH concentration=158,202,1
Fig. 3-1-26 Electrochemical profile with △T:25℃ and feed water with 5.3 wppm NH₄Cl after NaOH concentration=159,203,1
Fig. 3-1-37 Temperature profile during ECP measurement=170,214,1
Fig. 3-3-47 Effects of pH(acetic acid) on Stress-strain curves of turbine steels tested in water at 150℃=254,298,1
Fig. 3-3-48 Effects of pH(acetic acid) on the failure morphology of turbine steels tested in water at 150℃=255,299,1
Fig. 3-4-35 Residual stress distribution after bending to hump type specimen.(x: longitudinal,y: lateral).=301,345,1
Fig. 3-4-36 Longitudinal (x) and lateral (y) stress distribution when the hump specimen is pulled by 2 m (7% elongation) in longitudinal direction.=302,346,1
*표시는 필수 입력사항입니다.
| 전화번호 |
|---|
| 기사명 | 저자명 | 페이지 | 원문 | 기사목차 |
|---|
| 번호 | 발행일자 | 권호명 | 제본정보 | 자료실 | 원문 | 신청 페이지 |
|---|
도서위치안내: / 서가번호:

우편복사 목록담기를 완료하였습니다.
*표시는 필수 입력사항입니다.
저장 되었습니다.
