


권호기사보기
| 기사명 | 저자명 | 페이지 | 원문 | 기사목차 |
|---|
| 대표형(전거형, Authority) | 생물정보 | 이형(異形, Variant) | 소속 | 직위 | 직업 | 활동분야 | 주기 | 서지 | |
|---|---|---|---|---|---|---|---|---|---|
| 연구/단체명을 입력해주세요. | |||||||||
|
|
|
|
|
|
* 주제를 선택하시면 검색 상세로 이동합니다.
목차
표제지=0,1,1
제출문=1,2,2
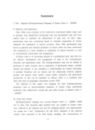
Summary=3,4,4
CONTENTS=7,8,1
목차=8,9,1
List of Tables=9,10,1
List of Figures=10,11,7
제1장 서언=17,18,4
제2장 지형=21,22,2
제3장 지질 및 광상=23,24,1
제1절 지질=23,24,8
제2절 지질구조=30,31,1
제3절 광상=30,31,4
제4장 수리지화학=34,35,1
제1절 야외조사 및 분석방법=34,35,2
제2절 성분별 수리지화학도=35,36,73
제3절 다변량 통계분석=108,109,15
제4절 토론=123,124,11
제5장 동위원소지화학=134,135,1
제1절 하천수의 산소 안정동위원소 연구=134,135,22
제2절 동위원소연대=156,157,37
제6장 지열지화학=193,194,12
제7장 결론=205,206,2
참고문헌=207,208,14
영문목차
[title page etc.]=0,1,7
CONTENTS=7,8,10
Chapter 1. Introduction=17,18,4
Chapter 2. Topography=21,22,2
Chapter 3. Geology and ore deposits=23,24,1
3-1. Geology=23,24,8
3-2. Geostructure=30,31,1
3-3. Ore deposits=30,31,4
Chapter 4. Hydrogeochemistry=34,35,1
4-1. Sampling and Anaytical Methods=34,35,2
4-2. Hygrogeochemical Maps=35,36,73
4-3. Multivariate Statistical Analysis=108,109,15
4-4. Discussion=123,124,11
Chapter 5. Isotope Geochemistry=134,135,1
5-1. Oxygen isotope=134,135,22
5-2. Geochronology=156,157,37
Chapter 6. Geothermal Chemistry of Granite=193,194,12
Chapter 7. Conclusion=205,206,2
참고문헌=207,208,14
Fig. 1-1. Hydrogeochemical Mapping programme for stream water in South Korea=19,20,1
Fig. 1-2. Geographic index map of the Daejeon sheet (1/250,000)=20,21,1
Fig. 2-1. Topographical map of the northern part of the Daejeon sheet (1/250,000). The name of 1:50,000 scale topographical map are showed=24,25,1
Fig. 3-1. Geologic map of the Daejeon sheet (1/250,000;after KIGAM,1996)=25,26,1
Fig. 3-2. Relief and geostructural map of the Daejeon sheet(1/250,000)=32,33,1
Fig. 4-1. Sample sites map of the Daejeon sheet(1/250,000)=33,34,1
Fig. 4-2. Regional hydrogeochemical map of Ag in stream waters of the Daejeon sheet(1/250,000)=37,38,1
Fig. 4-3. Regional hydrogeochemical map of Al in stream waters of the Daejeon sheet(1/250,000)=38,39,1
Fig. 4-4. Regional hydrogeochemical map of As in stream waters of the Daejeon sheet(1/250,000)=43,44,1
Fig. 4-5. Regional hydrogeochemical map of Ba in stream waters of the Daejeon sheet(1/250,000)=44,45,1
Fig. 4-6. Regional hydrogeochemical map of Ca in stream waters of the Daejeon sheet(1/250,000)=49,50,1
Fig. 4-7. Regional hydrogeochemical map of Cd in stream waters of the Daejeon sheet(1/250,000)=50,51,1
Fig. 4-8. Regional hydrogeochemical map of Co in stream waters of the Daejeon sheet(1/250,000)=53,54,1
Fig. 4-9. Regional hydrogeochemical map of Cr in stream waters of the Daejeon sheet(1/250,000)=54,55,1
Fig. 4-10. Regional hydrogeochemical map of Cu in stream waters of the Daejeon sheet(1/250,000)=57,58,1
Fig. 4-11. Regional hydrogeochemical map of Fe in stream waters of the Daejeon sheet(1/250,000)=58,59,1
Fig. 4-12. Regional hydrogeochemical map of K in stream waters of the Daejeon sheet(1/250,000)=62,63,1
Fig. 4-13. Regional hydrogeochemical map of Li in stream waters of the Daejeon sheet(1/250,000)=63,64,1
Fig. 4-14. Regional hydrogeochemical map of Mg in stream waters of the Daejeon sheet(1/250,000)=67,68,1
Fig. 4-15. Regional hydrogeochemical map of Mn in stream waters of the Daejeon sheet(1/250,000)=68,69,1
Fig. 4-16. Regional hydrogeochemical map of Mo In stream waters of the Daejeon sheet(1/250,000)=72,73,1
Fig. 4-17. Regional hydrogeochemical map of Na in stream waters of the Daejeon sheet(1/250,000)=73,74,1
Fig. 4-18. Regional hydrogeochemical map of Ni in stream waters of the Daejeon sheet(1/250,000)=76,77,1
Fig. 4-19. Regional hydrogeochemical map of Pb in stream waters of the Daejeon sheet(1/250,000)=77,78,1
Fig. 4-20. Regional hydrogeochemical map of Si in stream waters of the Daejeon sheet(1/250,000)=81,82,1
Fig. 4-21. Regional hydrogeochemical map of Sr in stream waters of the Daejeon sheet(1/250,000)=82,83,1
Fig. 4-22. Regional hydrogeochemical map of V in stream waters of the Daejeon sheet(1/250,000)=86,87,1
Fig. 4-23. Regional hydrogeochemical map of W in stream waters of the Daejeon sheet(1/250,000)=87,88,1
Fig. 4-24. Regional hydrogeochemical map of Zn in stream waters of the Daejeon sheet(1/250,000)=91,92,1
Fig. 4-25. Regional hydrogeochemical map of HCO₃- in stream waters of the Daejeon sheet(1/250,000)=92,93,1
Fig. 4-26. Regional hydrogeochemical map of electrical conductivity in stream waters of the Daejeon sheet(1/250,000)=95,96,1
Fig. 4-27. Regional hydrogeochemical map of Acidity(pH) in stream waters of the Daejeon sheet(1/250,000)=96,97,1
Fig. 4-28. Regional hydrogeochemical map of Eh in stream waters of the Daejeon sheet(1/250,000)=98,99,1
Fig. 4-29. Regional hydrogeochemical map of Cl- in stream waters of the Daejeon sheet(1/250,000)=99,100,1
Fig. 4-30. Regional hydrogeochemical map of F in stream waters of the Daejeon shcet(1/250,000)=102,103,1
Fig. 4-31. Regional hydrogeochemical map of NO₃in stream waters of the Daejeon sheet(1/250,000)=103,104,1
Fig. 4-32. Regional hydrogeochemlcal map of SO²₄in stream waters of the Daejeon sheet(1/250,000)=106,107,1
Fig. 4-33. Plot of principal component 1 (PC1) versus principal component 2 (PC2) for hydrochemical data in the study area. (Gr:granite,Gn:gneiss,Qtz:quartzite,Sch:Schist,Phy:phyllite,C_Sed:Cretaceous sedimentary rocks,Ls:limestone,Vol:volcanics,J_Sed:Jur=114,115,1
Fig. 4-34. Plot of principal component 1 (PC1) versus principal component 3 (PC3) for hydrochemical data in the study area.(Gr:granite,Gn:gneiss,Qtz:quartzite,Sch:Schist,Phy:phyllite,C_Sed:Cretaceous sedimentary rocks,Ls:limestone,Vol:volcanics,J_Sed:Jura=115,116,1
Fig. 4-35. Regional hydrogeochemical map of principal component 1(PC1) in stream waters over the Daejeon sheet(1/250,000)=116,117,1
Fig. 4-36. Regional hydrogeochemical map of principal component 2(PC2) in stream waters over the Daejeon sheet(1/250,000)=117,118,1
Fig. 4-37. Regional hydrogeochemical map of principal component 3(PC3) in stream waters over the Daejeon sheet(1/250,000)=118,119,1
Fig. 4-38. The results of correspondence analysis(CA) showing the relationship between streamwater component and sample (Dim 1 vs Dim 2)=119,120,1
Fig. 4-39. Box-Whisker plot of pH and EC in streamwaters. The samples were grouped by geology of sampling site (Gr:granite,Gn:gneiss,Qtz:quartzite,Sch:schist,Ls:limestone,Vol:volcanics,C_Se:Cretaceous sedimentary rocks,J_Se:Jurassic sedimentary rocks.)=124,125,1
Fig. 4-40. Box-Whisker plot of Ca and HCO₃in streamwaters. The samples were grouped by geology of sampling site (Gr:granite,Gn:gneiss,Qtz:quartzite,Sch:schist,Ls:limestone,Vol:volcanics,C_Se:Cretaceous sedimentary rocks,J_Se:Jurassic sedimentary rocks)=125,126,1
Fig. 4-41. Box-Whisker plot of Mg and Sr in streamwaters. The samples were grouped by geology of sampling site (Gr:granite,Gn:gneiss,Qtz:quartzite,Sch:schist,Ls:limestone,Vol:volcanics,C_Se:Cretaceous sedimentary rocks,J_Se:Jurassic sedimentary rocks)=126,127,1
Fig. 4-42. Box-Whisker plot of Cl and NO₃in streamwaters. The samples were grouped by geology of sampling site (Gr:granite,Gn:gneiss,Qtz:quartzite,Sch:schist,Ls:limestone,Vol:volcanics,C_Se:Cretaceous sedimentary rocks,J_Se:Jurassic sedimentary rocks)=127,128,1
Fig. 4-43. Box-Whisker plot of Na and K in streamwaters. The samples were grouped by geology of sampling site (Gr:granite,Gn: gneiss,Qtz:quartzite,Sch:schist,Ls:limestone,Vol:volcanics,C_Se:Cretaceous sedimentary rocks,J_Se:Jurassic sedimentary rocks)=128,129,1
Fig. 4-44. Box-Whisker plot of Si and SO₄in streamwaters. The samples were grouped by geology of sampling site (Gr:granite,Gn:gneiss,Qtz:quartzite,Sch:schist,Ls:limestone,Vol:volcanics,C_Se:Cretaceous sedimentary rocks,J_Se:Jurassic sedimentary rocks)=129,130,1
Fig. 4-45. Box-Whisker plot of Ba and F in streamwaters. The samples were grouped by geology of sampling site (Gr:granite,Gn:gneiss,Qtz:quartzite,Sch:schist,Ls: limestone,Vol:volcanics,C_Se:Cretaceous sedimentary rocks,J_Se:Jurassic sedimentary rocks)=130,131,1
Fig. 4-46. Box-Whisker plot of Al and Fe in streamwaters. The samples were grouped by geology of sampling site (Gr:granite,Gn:gneiss,Qtz:quartzite,Sch:schist,Ls:limestone,Vol:volcanics,C_Se:Cretaceous sedimentary rocks,J_Se:Jurassic sedimentary rocks)=131,132,1
Fig. 4-47. Box-Whisker plot of Mn and Zn in streamwaters. The samples were grouped by geology of sampling site (Gr:granite,Gn:gneiss,Qtz:quartzite,Sch:schist,Ls:limestone,Vol:volcanics,C_Se:Cretaceous sedimentary rocks,J_Se:Jurassic sedimentary rocks)=132,133,1
Fig. 5-1. Geomorphic map showing the sample sites of stream water from the Daejeon sheet(1/250,000 scale) area=139,140,1
Fig. 5-2. A frequency diagram showing variations of δ 18(이미지참조)O value of strem water from the Daejeon sheet(1/250,000 scale) area=140,141,1
Fig. 5-3. Contour map for δ 18(이미지참조)O values of stream water from the Daejeon sheet(1/250,000 scale) area=150,151,1
Fig. 5-4. Latitude and longitude effects of δ 18(이미지참조)O values for stream water from the Daejeon sheet(1/250,000 scale) area=152,153,1
Fig. 5-5. The relationships of altitude vs. latitude and longitude of the sample locations of stream water=153,154,1
Fig. 5-6. Altitude effect of δ 18(이미지참조)O values for stream water from the Daejeon sheet(1/250,000 scale) area=154,155,1
Fig. 5-7. Isotope age map for the Daejeon sheet(1:250,000 scale)=160,161,1
Fig. 6-1. Map shows the measuring sites of the total radioactivity in the Daejeon sheet(1:250,000)=198,199,1
Fig. 6-2. Map shows the measuring sites of the radioactivity of K(%) in the Daejeon sheet(1:250,000)=199,200,1
Fig. 6-3. Map shows the measuring sites of the radioactivity of U(ppm) in the Daejeon sheet(1:250,000)=200,201,1
Fig. 6-4. Map shows the measuring sites of the radioactivity of Th(ppm) in the Daejeon sheet(1:250,000)=201,202,1
Fig. 6-5. The anomaly maps of total and U radioactivities in Daejeon sheet(1:250,000)=204,205,1
jpg
Fig. 1-1. Hydrogeochemical Mapping programme for stream water in South Korea=19,20,1
Fig. 1-2. Geographic index map of the Daejeon sheet (1/250,000)=20,21,1
Fig. 2-1. Topographical map of the northern part of the Daejeon sheet (1/250,000). The name of 1:50,000 scale topographical map are showed=24,25,1
Fig. 3-1. Geologic map of the Daejeon sheet (1/250,000;after KIGAM,1996)=25,26,1
Fig. 4-1. Sample sites map of the Daejeon sheet(1/250,000)=33,34,1
Fig. 4-2. Regional hydrogeochemical map of Ag in stream waters of the Daejeon sheet(1/250,000)=37,38,1
Fig. 4-3. Regional hydrogeochemical map of Al in stream waters of the Daejeon sheet(1/250,000)=38,39,1
Fig. 4-4. Regional hydrogeochemical map of As in stream waters of the Daejeon sheet(1/250,000)=43,44,1
Fig. 4-5. Regional hydrogeochemical map of Ba in stream waters of the Daejeon sheet(1/250,000)=44,45,1
Fig. 4-6. Regional hydrogeochemical map of Ca in stream waters of the Daejeon sheet(1/250,000)=49,50,1
Fig. 4-7. Regional hydrogeochemical map of Cd in stream waters of the Daejeon sheet(1/250,000)=50,51,1
Fig. 4-8. Regional hydrogeochemical map of Co in stream waters of the Daejeon sheet(1/250,000)=53,54,1
Fig. 4-9. Regional hydrogeochemical map of Cr in stream waters of the Daejeon sheet(1/250,000)=54,55,1
Fig. 4-10. Regional hydrogeochemical map of Cu in stream waters of the Daejeon sheet(1/250,000)=57,58,1
Fig. 4-11. Regional hydrogeochemical map of Fe in stream waters of the Daejeon sheet(1/250,000)=58,59,1
Fig. 4-12. Regional hydrogeochemical map of K in stream waters of the Daejeon sheet(1/250,000)=62,63,1
Fig. 4-13. Regional hydrogeochemical map of Li in stream waters of the Daejeon sheet(1/250,000)=63,64,1
Fig. 4-14. Regional hydrogeochemical map of Mg in stream waters of the Daejeon sheet(1/250,000)=67,68,1
Fig. 4-15. Regional hydrogeochemical map of Mn in stream waters of the Daejeon sheet(1/250,000)=68,69,1
Fig. 4-16. Regional hydrogeochemical map of Mo In stream waters of the Daejeon sheet(1/250,000)=72,73,1
Fig. 4-17. Regional hydrogeochemical map of Na in stream waters of the Daejeon sheet(1/250,000)=73,74,1
Fig. 4-18. Regional hydrogeochemical map of Ni in stream waters of the Daejeon sheet(1/250,000)=76,77,1
Fig. 4-19. Regional hydrogeochemical map of Pb in stream waters of the Daejeon sheet(1/250,000)=77,78,1
Fig. 4-20. Regional hydrogeochemical map of Si in stream waters of the Daejeon sheet(1/250,000)=81,82,1
Fig. 4-21. Regional hydrogeochemical map of Sr in stream waters of the Daejeon sheet(1/250,000)=82,83,1
Fig. 4-22. Regional hydrogeochemical map of V in stream waters of the Daejeon sheet(1/250,000)=86,87,1
Fig. 4-23. Regional hydrogeochemical map of W in stream waters of the Daejeon sheet(1/250,000)=87,88,1
Fig. 4-24. Regional hydrogeochemical map of Zn in stream waters of the Daejeon sheet(1/250,000)=91,92,1
Fig. 4-25. Regional hydrogeochemical map of HCO₃-in stream waters of the Daejeon sheet(1/250,000)=92,93,1
Fig. 4-26. Regional hydrogeochemical map of electrical conductivity in stream waters of the Daejeon sheet(1/250,000)=95,96,1
Fig. 4-27. Regional hydrogeochemical map of Acidity(pH) in stream waters of the Daejeon sheet(1/250,000)=96,97,1
Fig. 4-28. Regional hydrogeochemical map of Eh in stream waters of the Daejeon sheet(1/250,000)=98,99,1
Fig. 4-29. Regional hydrogeochemical map of Cl- in stream waters of the Daejeon sheet(1/250,000)=99,100,1
Fig. 4-30. Regional hydrogeochemical map of F in stream waters of the Daejeon shcet(1/250,000)=102,103,1
Fig. 4-31. Regional hydrogeochemical map of NO₃in stream waters of the Daejeon sheet(1/250,000)=103,104,1
Fig. 4-32. Regional hydrogeochemlcal map of SO²₄in stream waters of the Daejeon sheet(1/250,000)=106,107,1
Fig. 4-33. Plot of principal component 1 (PC1) versus principal component 2 (PC2) for hydrochemical data in the study area. (Gr:granite,Gn:gneiss,Qtz:quartzite,Sch:Schist,Phy:phyllite,C_Sed:Cretaceous sedimentary rocks,Ls:limestone,Vol:volcanics,J_Sed:Jur=114,115,1
Fig. 4-34. Plot of principal component 1 (PC1) versus principal component 3 (PC3) for hydrochemical data in the study area.(Gr:granite,Gn:gneiss,Qtz:quartzite,Sch:Schist,Phy:phyllite,C_Sed:Cretaceous sedimentary rocks,Ls:limestone,Vol:volcanics,J_Sed:Jura=115,116,1
Fig. 4-35. Regional hydrogeochemical map of principal component 1(PC1) in stream waters over the Daejeon sheet(1/250,000)=116,117,1
Fig. 4-36. Regional hydrogeochemical map of principal component 2(PC2) in stream waters over the Daejeon sheet(1/250,000)=117,118,1
Fig. 4-37. Regional hydrogeochemical map of principal component 3(PC3) in stream waters over the Daejeon sheet(1/250,000)=118,119,1
Fig. 4-38. The results of correspondence analysis(CA) showing the relationship between streamwater component and sample (Dim 1 vs Dim 2)=119,120,1
Fig. 5-3. Contour map for δ 18(이미지참조)O values of stream water from the Daejeon sheet(1/250,000 scale) area=150,151,1
Fig. 5-7. Isotope age map for the Daejeon sheet(1:250,000 scale)=160,161,1
Fig. 6-1. Map shows the measuring sites of the total radioactivity in the Daejeon sheet(1:250,000)=198,199,1
Fig. 6-2. Map shows the measuring sites of the radioactivity of K(%) in the Daejeon sheet(1:250,000)=199,200,1
Fig. 6-3. Map shows the measuring sites of the radioactivity of U(ppm) in the Daejeon sheet(1:250,000)=200,201,1
Fig. 6-4. Map shows the measuring sites of the radioactivity of Th(ppm) in the Daejeon sheet(1:250,000)=201,202,1
Fig. 6-5. The anomaly maps of total and U radioactivities in Daejeon sheet(1:250,000)=204,205,1
*표시는 필수 입력사항입니다.
| 전화번호 |
|---|
| 기사명 | 저자명 | 페이지 | 원문 | 기사목차 |
|---|
| 번호 | 발행일자 | 권호명 | 제본정보 | 자료실 | 원문 | 신청 페이지 |
|---|
도서위치안내: / 서가번호:

우편복사 목록담기를 완료하였습니다.
*표시는 필수 입력사항입니다.
저장 되었습니다.
