
 대표어
대표어
권호기사보기
| 기사명 | 저자명 | 페이지 | 원문 | 기사목차 |
|---|
결과 내 검색
동의어 포함
목차
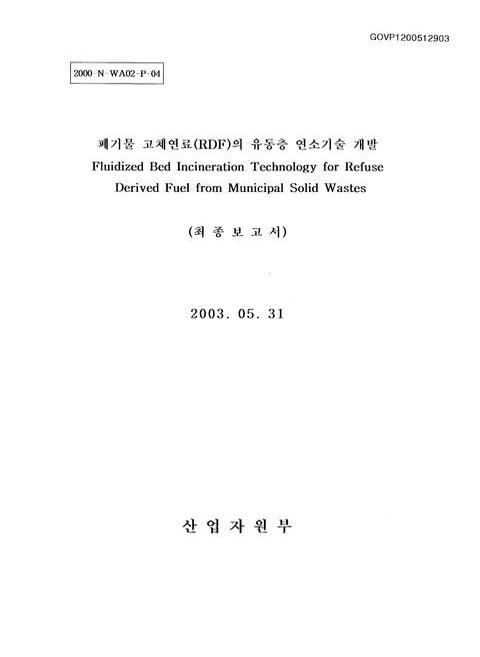
표제지=0,1,1
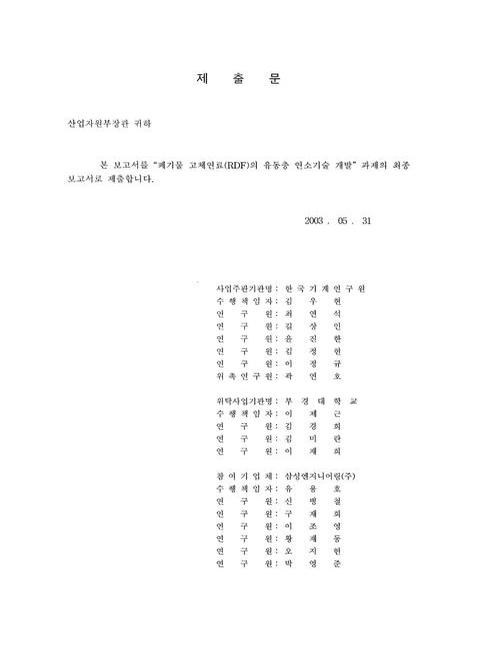
제출문=0,2,1
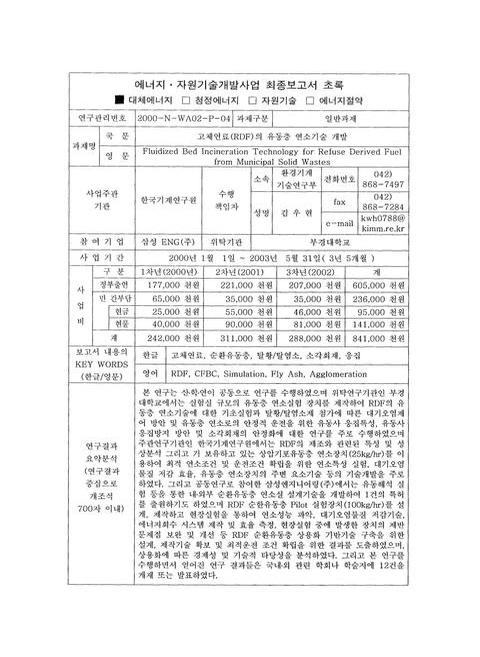
에너지ㆍ자원기술개발사업 최종보고서 초록/김우현=0,3,1
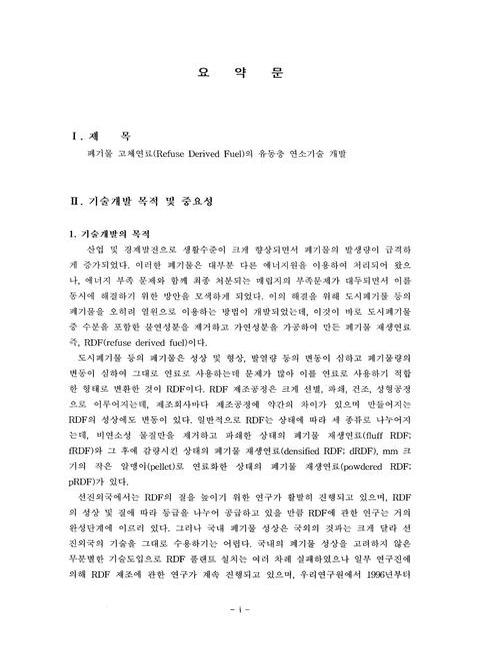
요약문=i,4,9
목차=x,13,7
표차례=xvii,20,3
그림차례=xx,23,8
제1장 서론=1,31,1
제1절 연구 목적 및 필요성=1,31,1
1. 연구 개요=1,31,2
2. 기술 개발의 필요성=2,32,4
3. 개발기술의 당면과제 및 기술적 애로=5,35,1
4. 관련 기술의 국내ㆍ외 현황=5,35,9
제2절 연구 내용 및 범위=14,44,1
1. 1차년도=14,44,1
2. 2차년도=14,44,2
3. 3차년도=15,45,1
제3절 연구개발 추진체계=16,46,1
1. 1차년도=16,46,1
2. 2차년도=17,47,1
3. 3차년도=18,48,1
제2장 기술현황 조사 및 분석=19,49,1
제1절 폐기물의 발생 및 처리현황=19,49,1
1. 폐기물 발생량 및 조성=19,49,1
2. 성상별 발생량=19,49,2
3. 폐기물 처리현황=20,50,3
4. 폐기물 발생 및 처리 전망=22,52,3
제2절 RDF 특성 및 제조 기술=25,55,1
1. RDF 특성=25,55,3
2. RDF 제조기술=27,57,4
3. RDF의 품질,규격 및 조건=30,60,4
제3절 유동층 연소기술=34,64,1
1. 개요=34,64,5
2. 순환유동층 연소로의 원리=38,68,2
3. 순환유동층 연소의 장점=40,70,1
4. 순환유동층 연소보일러의 종류=40,70,3
5. 유동층 보일러 개발 및 보급현황=42,72,7
제4절 유동층 연소로에서 대기오염물질 생성 및 제어=49,79,1
1. 개요=49,79,1
2. 황산화물(SOx)=49,79,11
3. 질소산화물(NOx)=60,90,12
4. 유기성 오염물질=72,102,3
5. 중금속(Heavy metal) 및 할로겐 화합물=74,104,4
제3장 RDF의 제조 및 특성=78,108,1
제1절 RDF 제조 및 성상분석=78,108,1
1. RDF 제조용 생활폐기물 성상조사=78,108,1
2. RDF 제조=78,108,2
제2절 RDF 특성분석=79,109,1
1. RDF 밀도분석=79,109,1
2. RDF 발열량 분석=80,110,1
3. RDF 원소 및 공업분석=80,110,1
4. RDF 원소시 CI의 거동 분석=80,110,4
제3절 결과요약=83,113,1
제4장 Lab-scale RDF 유동층 연소특성 기초실험=84,114,1
제4-1장 RDF 유동층 연소특성연구=84,114,1
제1절 서론=84,114,1
제2절 실험장치 및 방법=84,114,1
1. 실험장치=84,114,9
2. 실험방법=93,123,1
제3절 RDF의 물리화학적 특성=94,124,1
1. RDF 성분분석=94,124,1
2. 열중량분석(TGA) 분석결과=95,125,1
3. Lab-scale 유동층 연소로의 최소유동화 속도(Umf)=96,126,1
제4절 조업조건 변화에 따른 RDF 연소특성=97,127,1
1. RDF 유동층 연소로내 온도 분포=97,127,1
2. 조업조건에 따른 대기오염물질 배출특성=98,128,1
3. 총괄 공기-연료비 변화에 따른 연소효율=98,128,4
제5절/제4절 결과요약=102,132,1
제4-2장 탈황/탈염소제 첨가에 따른 배가스 특성=103,133,1
제1절 서론=103,133,1
제2절 연구방법=103,133,1
1. 열역학평형 모델을 이용한 대기오염물질 거동 연구방법=103,133,2
2. 중금속 화합물의 배출 거동=104,134,1
제3절 Limestone 주입에 따른 배가스 특성=105,135,7
제4절 Limestone 주입에 따른 중금속 화합물의 배출특성=112,142,7
제5절 결과요약=119,149,1
제5장 Bench scale 기포유동층 연소장치 설계 및 연소특성=120,150,1
제1절 RDF 유동층 소각시스템 설계=120,150,1
1. 유동층 소각로 최적설계 절차=120,150,1
2. 유동층 소각로 기본설계=120,150,7
3. 시스템 사양=126,156,2
4. 시스템 개요=127,157,6
제2절 RDF 연소특성 기초실험=133,163,1
1. 최소 유동화 속도=133,163,1
2. RDF별 연소실 승온속도=134,164,2
3. RDF 연소특성=136,166,7
제3절 Ca(OH)₂첨가량별 RDF 유동층 연소특성=143,173,1
1. 연소배출가스 특성=143,173,4
2. RDF 유동층 연소시 CI 배출 거동측성=147,177,2
3. RDF 유동층 연소 비산재내의 중금속 함유량=148,178,2
제4절 RDF 유동층 최적연소실험=150,180,1
1. 실험조건=150,180,1
2. 최적연소실험 결과=150,180,6
3. 최적연소조건에서의 소석회 주입량에 따른 CI 배출특성=156,186,1
제5절 결과요약=157,187,2
제6장 내ㆍ외부 순환유동층 연소실 설계기술=159,189,1
제1절 유동층 유동특성 실험 및 연소실 유동해석=159,189,1
1. 순환유동층 cold bed 실험=159,189,7
2. 연소실 유동해석 Modeling=165,195,2
3. 순환유동층 반응기 선정=166,196,4
4. 결과요약=169,199,2
제2절 순환유동층 cold bed 실험 및 pilot 설계=171,201,1
1. 내부 순환유동층 특허조사=171,201,3
2. 내부 순환유동층 Cold Bed 실험=174,204,3
3. 순환유동층 설계인자 조사=176,206,6
4. RDF 연소 기초실험=181,211,2
5. 내부 순환유동층 설계프로그램=182,212,5
6. 내부 순환유동층 Pilot 설계=187,217,5
7. 결과요약=192,222,1
제7장 외부 순환유동층 RDF Pilot 설계 및 연소실험=193,223,1
제1절 외부 순환유동층 설계=193,223,1
1. 외부 순환유동층 Type선정 및 Pilot 실험 변경 및 실험 연장사유=193,223,1
2. 외부 순환유동층 설계=194,224,15
제2절 외부 순환유동층 Pilot plant 제작 및 설치=209,239,1
1. 공정 설명=209,239,3
2. 단위기기 사양=211,241,4
제3절 외부 순환유동층 Pilot plant 연소실험=215,245,1
1. 실험개요=215,245,6
2. 유동층 소각로 내 온도 및 압력 분포=221,251,7
3. 연소가스 분석=228,258,3
4. 소각재 분석=231,261,3
5. 결과요약=234,264,2
제8장 RDF 유동층 연소 최적조업조건 확립을 위한 유동사 응집특성 연구=236,266,1
제8-1장 RDF 유동층 연소시 층응집 생성 및 성장 메카니즘=236,266,1
제1절 서론=236,266,1
제2절 분석방법=237,267,1
제3절 EPMA 분석을 통한 층응집 생성 메카니즘=238,268,1
1. 층응집물을 형성하는 물질의 분포 특성=238,268,8
2. 층응집물을 형성하는 물질의 조성=246,276,6
제4절 층응집 생성 및 성장 메카니즘=252,282,1
1. 층응집 생성 메카니즘 연구 동향=252,282,5
2. 층응집 생성 및 성장 메카니즘=257,287,6
제5절 결과 요약=263,293,2
제8-2장 RDF 유동층 연소시 층응집 생성 예측=265,295,1
제1절 서론=265,295,1
제2절 연구방법=266,296,1
1. 열역학평형모델=266,296,1
2. 층응집 생성 예측을 위한 입력자료=266,296,9
제3절 알칼리 함량에 의한 층응집 특성=275,305,2
제4절 Sulfer 함량에 의한 층응집 특성=277,307,2
제5절 Chlorine 함량에 의한 층응집 특성=279,309,2
제6절 운전조건 변화에 따른 층응집 특성=281,311,1
1. 연소온도에 의한 영향=281,311,1
2. 과잉공기비(이미지참조)에 의한 영향=281,311,2
3. 압력에 의한 영향=283,313,1
제7절 결과요약=284,314,2
제8-3장/제7-3장 층응집 생성 예측 평가기준=286,316,1
제1절 서론=286,316,1
제2절 연구방법=287,317,13
제3절 층응집 생성 예측 평가기준 설정=300,330,8
제4절 결과요약=308,338,1
제9장 유동사 응집 방지방안 및 소각회재 안정화 연구=309,339,1
제9-1장 RDF 유동층 연소시 층응집 방지방안=309,339,1
제1절 서론=309,339,1
제2절 층물질 변경에 의한 층응집 방지 특성=310,340,1
1. Alumina sand bed=310,340,2
2. Limestone bed=312,342,1
3. Dolomite bed=312,342,2
제3절 무기첨가제 주입시 층응집 방지 특성=314,344,1
1. Ferrite oxide 주입에 의한 영향=314,344,3
2. Diphosphorus pentoxide(P₂O5(이미지참조)) 주입에 의한 영향=317,347,2
제4절 타 연료와의 혼합연소시 층응집 방지 특성=319,349,1
1. 유연탄과의 혼합연소=319,349,1
2. 무연탄과의 혼합연소=319,349,3
제5절 결과요약=322,352,1
제9-2장 RDF 소각재의 안정화를 위한 용융고형화=323,353,1
제1절 서론=323,353,1
제2절 실험장치 및 방법=324,354,1
1. 실험장치=324,354,1
2. 실험방법=325,355,2
제3절 소각재의 물리ㆍ화학적 특성=327,357,1
1. 소각재의 물성=327,357,1
2. 중금속 농도 및 용출 특성=328,358,2
제4절 용융슬래그 분배 특성=330,360,2
제5절 용융슬래그 중금속 분리율=332,362,1
1. 용융분위기에 따른 변화 특성=332,362,2
2. 용융조업시간에 따른 변화=334,364,1
제6절 중금속 용출 특성=335,365,2
제7절 결과요약=337,367,1
제10장 결론=338,368,11
참고문헌=349,379,14
부록:장치도면[원본불량;p.364~370]=363,393,21
Fig. 2-1 K-RDF 제조 공정도=29,59,1
Fig. 2-2 Fluidized bed zone=35,65,1
Fig. 2-3 순환유동층 보일러 개념도=39,69,1
Fig. 2-4 보일러 형태에 따른 분류=43,73,1
Fig. 2-5 소성온도에 대한 과잉공기량의 영향=53,83,1
Fig. 2-6 Ca/S 몰비에 따른 탈황율 및 흡수제 이용율의 변화=54,84,1
Fig. 2-7 층온도에 따른 탈황특성의 변화=55,85,1
Fig. 2-8 석회석 종류에 따른 SO₂저감특성=57,87,1
Fig. 2-9 탈황특성에 대한 흡수제 입경변화의 영향=59,89,1
Fig. 2-10 유동층에서 fuel NOx 생성과 관련된 반응경로=62,92,1
Fig. 2-11 유동층 연소에서 유연탄 연소시 질소산화물(NOx)의 로내 수직온도분포=64,94,1
Fig. 2-12 배가스중 O2 농도별 NOx 배출농도에 대한 층온도의 영향(연료입경< 6㎜)=66,96,1
Fig. 2-13 배가스중의 O₂농도에 따른 연료중 질소성분의 전환율(연료입경< 6㎜;coke 제외)=67,97,1
Fig. 2-14 연료중 질소성분의 함량별 NO로의 전환에 대한 휘발분의 영향(배가스중 8% O₂)=67,97,1
Fig. 2-15 NO 배출농도에 대한 과잉공기량의 영향=69,99,1
Fig. 2-16 0.25㎡ 단단 및 2단 유동층 연소로에서의 NOx 배출농도 비교=70,100,1
Fig. 2-17 산소농도(과잉공기량) 변화에 따른 일산화탄소의 배출특성=73,103,1
Fig. 2-18 다이옥신류와 퓨란류의 주요 생성기구=73,103,1
Fig. 2-19 도시폐기물의 소각시 다이옥신의 생성 메카니즘=75,105,1
Fig. 2-20 소각로에서 중금속의 거동=76,106,1
Fig. 3-1 RDF forming equipment and produced RDF=79,109,1
Fig. 4-1 Schematic diagram of fluidized bed incinerator of RDF=87,117,1
Fig. 4-2 Photo. of RDF incinerator=88,118,1
Fig. 4-3 Schematic diagram of vibration feeder=89,119,1
Fig. 4-4 Photo. of vibration feeder=90,120,1
Fig. 4-5 Photo. of vibrator=91,121,1
Fig. 4-6 Photo. of double cyclones=92,122,1
Fig. 4-7 TGA analysis results=95,125,1
Fig. 4-8 Umf(이미지참조) of Lab-scale fluidized bed incinerator=96,126,1
Fig. 4-9 Temperature profiles with height above the distributor=97,127,1
Fig. 4-10 Effects of air/fuel ratio on air pollutant concentration(U0(이미지참조)=0.8㎧,Tem.:850℃)=99,129,1
Fig. 4-11 Effects of air/fuel ratio on air pollutant concentration(U0(이미지참조)=1.0㎧,Tem.:850℃)=99,129,1
Fig. 4-12 Effects of air/fuel ratio on air pollutant concentration(U0(이미지참조)=1.2㎧,Tem.:850℃)=100,130,1
Fig. 4-13 Effects of air/fuel ratio on air pollutant concentration(U0(이미지참조)=1.4㎧,Tem.:850℃)=100,130,1
Fig. 4-14 Combution efficiency vs. total air-fuel ratio=101,131,1
Fig. 4-15 The concentration of gaseous pollutant with operating temperature(λT(이미지참조)=1.2,Ca/S=1.3,RDF)=107,137,1
Fig. 4-16 The concentration of gaseous pollutant with operating temperature(λT(이미지참조)=1.2,Ca/S=5.5,RDF)=107,137,1
Fig. 4-17 The concentration of gaseous pollutant with operating temperature(λT(이미지참조)=1.2,Ca/S=6.5,RDF)=108,138,1
Fig. 4-18 The mole fraction of gaseous pollutants with Ca/S ratio(T=800℃,RDF)=108,138,1
Fig. 4-19 The concentration of calcium compounds with Ca/S ratio(T=800℃,λT(이미지참조)=1.2,RDF)=109,139,1
Fig. 4-20 The concentration of phosphate compounds with Ca/S ratio(T=800℃,λT(이미지참조)=1.2,RDF)=109,139,1
Fig. 4-21 The concentration of Aluminuim compounds with Ca/S ratio(T=800℃,λT(이미지참조)=1.2,RDF)=110,140,1
Fig. 4-22 The concentration of sodium compounds with Ca/S ratio(T=800℃,λT(이미지참조)=1.2,RDF)=110,140,1
Fig. 4-23 The concentration of Magnesium compounds with Ca/S ratio(T=800℃,λT(이미지참조)=1.2,RDF)=111,141,1
Fig. 4-24 Chrome compounds distribution in combustion gas with operating temperature;(λT(이미지참조)=1.2,Ca/S=1.3,RDF)=113,143,1
Fig. 4-25 Chrome compounds distribution in combustion gas with operating temperature;(λT(이미지참조)=1.2,Ca/S=5.5,RDF)=113,143,1
Fig. 4-26 Chrome compounds distribution in combustion gas with operating temperature;(λT(이미지참조)=1.2,Ca/S=6.5,RDF)=114,144,1
Fig. 4-27 Copper and lead compounds distribution in combution gas with operating temperature;(λT(이미지참조)=1.2,Ca/S=1.3,RDF)=114,144,1
Fig. 4-28 Copper and lead compounds distribution in combution gas with operating temperature;(λT(이미지참조)=1.2,Ca/S=5.5,RDF)=115,145,1
Fig. 4-29 Copper and lead compounds distribution in combution gas with operating temperature;(λT(이미지참조)=1.2,Ca/S=6.5,RDF)=115,145,1
Fig. 4-30 Zinc compounds distribution in bombution gas with operating temperature;(λT(이미지참조)=1.2,Ca/S=1.3,RDF)=116,146,1
Fig. 4-31 Zinc compounds distribution in bombution gas with operating temperature;(λT(이미지참조)=1.2,Ca/S=5.5,RDF)=116,146,1
Fig. 4-32 Zinc compounds distribution in bombution gas with operating temperature;(λT(이미지참조)=1.2,Ca/S=6.5,RDF)=117,147,1
Fig. 4-33 The concentration of Chrome compounds with Ca/S ratio(T=800℃,λT(이미지참조)=1.2,RDF)=117,147,1
Fig. 4-34 The concentration of copper and lead compounds with Ca/S ratio(T=800℃,λT(이미지참조)=1.2,RDF)=118,148,1
Fig. 4-35 The concentration of zine compounds with Ca/S ratio(T=800℃,λT(이미지참조)=1.2,RDF)=118,148,1
Fig. 5-1 Flow diagram of FBC design=121,151,1
Fig. 5-2 Diagram of RDF Fluidized bed combustor=129,159,1
Fig. 5-3 Diagram of rotary feeder=130,160,1
Fig. 5-4 Diagram of chain conveyor=130,160,1
Fig. 5-5 Bench scale RDF fluidized bed combustor=131,161,1
Fig. 5-6 Combustion air injection system=131,161,1
Fig. 5-7 Cyclone=131,161,1
Fig. 5-8 Air pre-heater=132,162,1
Fig. 5-9 Ca(OH)₂injection feeder=132,162,1
Fig. 5-10 Temperature acquisition system=132,162,1
Fig. 5-11 Cooling water=132,162,1
Fig. 5-12 Variation in pressure drop with superficial gas velocity for a bed sand=133,163,1
Fig. 5-13 Increasing ratio of temperature at each density and diameter of RDF=134,164,1
Fig. 5-14 Distribution of temperature in stable state of RDF combustion=135,165,1
Fig. 5-15 Distribution of gaseous pollutant concentration(1st:500ℓ/min,2nd:150ℓ/min)=137,167,1
Fig. 5-16 Distribution of gaseous pollutant concentration(1st:500ℓ/min,2nd:300ℓ/min)=137,167,1
Fig. 5-17 Distribution of gaseous pollutant concentration(1st:550ℓ/min,2nd:150ℓ/min)=138,168,1
Fig. 5-18 Distribution of gaseous pollutant concentration(1st:550ℓ/min,2nd:300ℓ/min)=138,168,1
Fig. 5-19 Distribution of gaseous pollutant concentration(1st:500ℓ/min,2nd:150ℓ/min)=141,171,1
Fig. 5-20 Distribution of gaseous pollutant concentration(1st:500ℓ/min,2nd:300ℓ/min)=141,171,1
Fig. 5-21 Distribution of gaseous pollutant concentration(1st:550ℓ/min,2nd:150ℓ/min)=142,172,1
Fig. 5-22 Distribution of gaseous pollutant concentration(1st:550ℓ/min,2nd:300ℓ/min)=142,172,1
Fig. 5-23 Distribution of gaseous pollutant concentration(Ca/0.5CI = 0)=144,174,1
Fig. 5-24 Distribution of gaseous pollutant concentration(Ca/0.5CI = 1)=144,174,1
Fig. 5-25 Distribution of gaseous pollutant concentration(Ca/0.5CI = 1.5)=145,175,1
Fig. 5-26 Distribution of gaseous pollutant concentration(Ca/0.5CI = 2)=145,175,1
Fig. 5-27 Distribution of gaseous pollutant concentration(Ca/0.5CI = 3)=146,176,1
Fig. 5-28 Distribution of gaseous pollutant concentration(Ca/0.5CI = 5)=146,176,1
Fig. 5-29 CI concentration in exhaust gas and fly ash=147,177,1
Fig. 5-30 Temperature distribution with feeding rate in stable state=151,181,1
Fig. 5-31 Concentration of exhaust gases with second air variation(RDF feeding rate:3㎏/hr)=152,182,1
Fig. 5-32 Concentration of exhaust gases with second air variation(RDF feeding rate:4㎏/hr)=153,183,1
Fig. 5-33 Concentration of exhaust gases with second air variation(RDF feeding rate:5㎏/hr)=154,184,1
Fig. 5-34 CI concentration in exhaust gas and fly ash=156,186,1
Fig. 6-1 The experimental column for cold bed test=160,190,1
Fig. 6-2 Determination of minimum fluidizing velocity by pressure drop=162,192,1
Fig. 6-3 Axial distribution of wood,PE,MC and PA particles in a fluidized bed with the various gas velocity=163,193,1
Fig. 6-4 Effect of gas velocity on the overall mixing index of large cylindrical particles=164,194,1
Fig. 6-5 Effect of large particle's length on mixing index at U=3*Umf(Umf = 0.32㎧)=165,195,1
Fig. 6-6 Field of fluid using distributer not improved=167,197,1
Fig. 6-7 Field of fluid using distributer improved=167,197,1
Fig. 6-8 Schematic diagram of Internal CFBC=175,205,1
Fig. 6-9 Distributor of fluidized bed=178,208,1
Fig. 6-10 Schematic diagram of RDF feeder=179,209,1
Fig. 6-11 Temperature profiles along the height from air distributor=183,213,1
Fig. 6-12 Distribution of CO,NOx,SO₂concentration=183,213,1
Fig. 6-13 Distribution of temperature with time in reactor=184,214,1
Fig. 6-14 Distribution of temperature at each facility=184,214,1
Fig. 6-15 Bed zone of ICFC=189,219,1
Fig. 6-16 Distributor of ICFC=190,220,1
Fig. 6-17 Schematic diagram of ICFC=191,221,1
Fig. 7-1 Schematic diagram of CFBc pilot plant for RDF combustion=209,239,1
Fig. 7-2 Gas sampler=218,248,1
Fig. 7-3 Dust sampler=219,249,1
Fig. 7-4 ICP=220,250,1
Fig. 7-5 Temperature profile in the CFBc for incinerating RDF=223,253,1
Fig. 7-6 Typical temperature and pressure profiles in the riser with each operating condition=224,254,1
Fig. 7-7 Heat capacity profiles in the riser with each operating condition=227,257,1
Fig. 7-8 Photograph of the cyclone ash=233,263,1
Fig. 7-9 Photograph of the bag filter ash=233,263,1
Fig. 8-1 Backscattered electron image of silica sand before used=239,269,1
Fig. 8-2 Backscattered electron image of an agglomerate from fluidized bed combustion of RDF=240,270,1
Fig. 8-3 X-ray images of an agglomerate from RDF combustion for Si-component=240,270,1
Fig. 8-4 X-ray images of an agglomerate from RDF combustion for K- and Na-component=241,271,1
Fig. 8-5 X-ray images of an agglomerate from RDF combustion for Na-,Ca-and S-component=242,272,1
Fig. 8-6 X-ray images of an agglomerate from RDF combustion for P-component=243,273,1
Fig. 8-7 Backscattered electron image of a bed particle from fluidized bed combustion of RDF=243,273,1
Fig. 8-8 Line scanning results of a bed particle from RDF combustion for Si- and Ca-component=244,274,1
Fig. 8-9 Line scanning results of a bed particle from RDF combustion for Na-,P-and Fe-component=245,275,1
Fig. 8-10 Backscattered electron image of an agglomerate and a bed particle from fluidized bed combustion of RDF=247,277,1
Fig. 8-11 Backscattered electron image of an agglomerate and a bed particle after dye sludge combustion=248,278,1
Fig. 8-12 Backscattered electron image of an agglomerate and a bed particle after sewage sludge combustion=250,280,1
Fig. 8-13 Backscattered electron image of bed particle after RDF combustion=251,281,1
Fig. 8-14 Illustration of the processes of the bed agglomeration mechanism(Ohman et.al.,2000)=253,283,1
Fig. 8-15 Schematic diagram for particle-to-particle bonding(Mann et al.,1996)=255,285,1
Fig. 8-16 Schematic diagram for particle-to-fuel bonding(Mann et al.,1996)=256,286,1
Fig. 8-17 Schematic diagram for high temperature sintering(Mann et al.,1996)=256,286,1
Fig. 8-18 Step 1 of formation and growth mechanism of bed agglomeration=259,289,1
Fig. 8-19 Step 2 of formation and growth mechanism of bed agglomeration=259,289,1
Fig. 8-20 Step 3 of formation and growth mechanism of bed agglomeration=260,290,1
Fig. 8-21 Step 4 of formation and growth mechanism of bed agglomeration=260,290,1
Fig. 8-22 Step 5 of formation and growth mechanism of bed agglomeration=261,291,1
Fig. 8-23 Step 6 of formation and growth mechanism of bed agglomeration=261,291,1
Fig. 8-24 Agglomerates from commercial fluidized bed incinerator of RDF=262,292,1
Fig. 8-25 System of heat balance=271,301,1
Fig. 8-26 Mole fraction of silicate melts produced with temperature during fluidized bed combustion of eight fuels=276,306,1
Fig. 8-27 Mole fraction of silicate melts produced with S/(K₂O+Na₂O) molar ratio during fluidized bed combustion of five fuels=278,308,1
Fig. 8-28 Mole fraction of silicate melts produced with CI/(K₂O+Na₂O) molar ratio during fluidized bed combustion of five fuels=280,310,1
Fig. 8-29 Mole fraction of silicate melts produced with operating temperature during fluidized bed combustion of five fuels=282,312,1
Fig. 8-30 Mole fraction of silicate melts with λT(이미지참조) ratio during fluidized bed combustion of six fuels=282,312,1
Fig. 8-31 Mole fraction of silicate melts produced with operating pressure during fluidized bed combustion of six fuels=283,313,1
Fig. 8-32 Mapping of estimated mole fraction of silicate melt with various fuels(No. of fuel refers to Table 8-11)=307,337,1
Fig. 9-1 Mole fraction of silicate melts produced with temperature from kinds fuel combustion by using silica sand bed=311,341,1
Fig. 9-2 Mole fraction of silicate melts produced with temperature from kinds fuel combustion by using alumina sand bed=311,341,1
Fig. 9-3 Mole fraction of silicate melts produced with temperature from kinds fuel combustion by using limestone sand bed=313,343,1
Fig. 9-4 Mole fraction of silicate melts produced with temperature from kinds fuel combustion by using dolomite sand bed=313,343,1
Fig. 9-5 Mole fraction of silicate melts with Fe₂O₃/(K₂O+Na₂O) molar ratio during RDF combustion=316,346,1
Fig. 9-6 Mole fraction of silicate melts with Fe₂O₃/(K₂O+Na₂O) molar ratio during straw pellet combustion=316,346,1
Fig. 9-7 Mole fraction of silicate melts with Fe₂O5(이미지참조)/(K₂O+Na₂O) molar ratio during RDF combustion=318,348,1
Fig. 9-8 Mole fraction of silicate melts with Fe₂O5(이미지참조)/(K₂O+Na₂O) molar ratio during straw pellet combustion=318,348,1
Fig. 9-9 Mole fraction of silicate salt melt produced with bituminous coal/fuel mixing ratio during four fuels combustion=321,351,1
Fig. 9-10 Mole fraction of silicate salt melt produced with anthracite coal/fuel mixing ratio during four fuels combustion=321,351,1
Fig. 9-11 Schematic diagram of high temperature electric furnace=324,354,1
Fig. 9-12 XRD results of ash from RDF incineration=327,357,1
Fig. 9-13 Diagram for gravitational separated parts of melting slag=331,361,1
Fig. 9-14 Separation efficiency of heavy metals from slag with melting atmosphere:S-O,slowly cooled slag in oxidizing condition;S-R,slowly cooled slag in reducing condition=333,363,1
Fig. 9-15 Separation rate of heavy metal in ash with melting time=334,364,1
*표시는 필수 입력사항입니다.
| 전화번호 |
|---|
| 기사명 | 저자명 | 페이지 | 원문 | 기사목차 |
|---|
| 번호 | 발행일자 | 권호명 | 제본정보 | 자료실 | 원문 | 신청 페이지 |
|---|
도서위치안내: / 서가번호:

우편복사 목록담기를 완료하였습니다.
*표시는 필수 입력사항입니다.
저장 되었습니다.
