
 대표어
대표어


권호기사보기
| 기사명 | 저자명 | 페이지 | 원문 | 기사목차 |
|---|
결과 내 검색
동의어 포함
목차
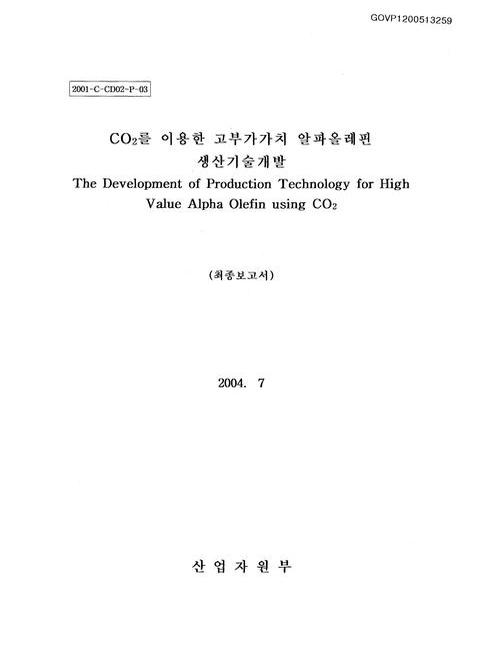
표제지=0,1,1
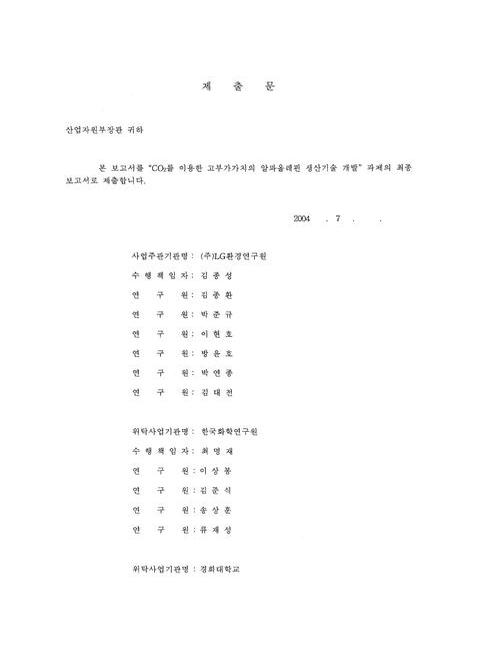
제출문=0,2,2
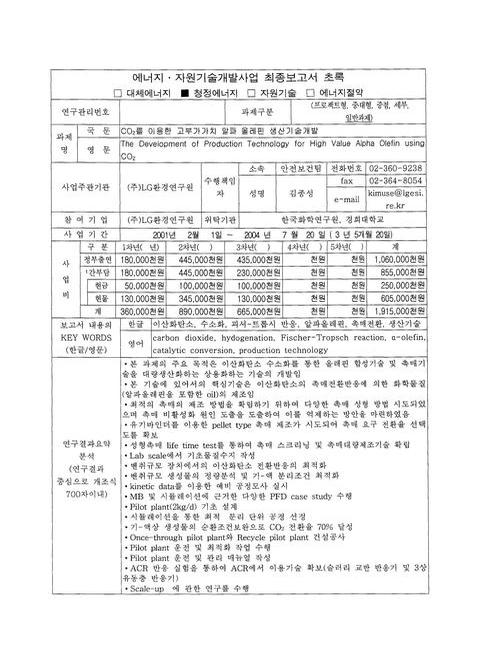
에너지ㆍ자원기술개발사업 최종보고서 초록/김종성=0,4,1
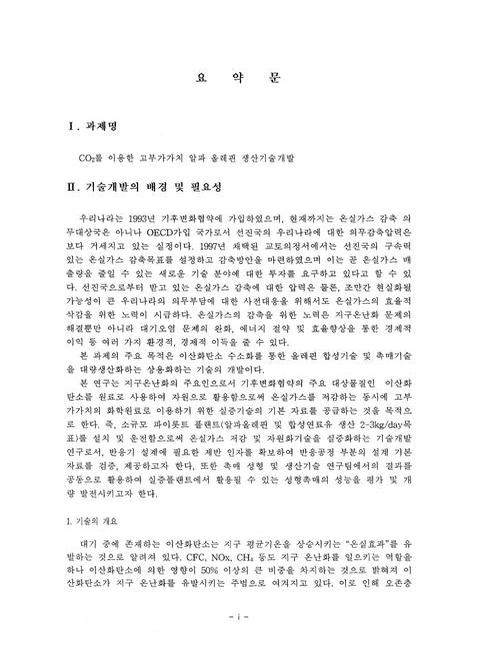
요약문=i,5,20
목차=xxi,25,3
표목차=xxiv,28,2
그림목차=xxvi,30,6
제1장 벤취규모 단위기술 최적화 연구=1,36,1
제1절 벤취규모 장치에서의 촉매제조 및 활성실험=1,36,4
제2절 벤취규모 장치에서의 이산화탄소 전환반응 one pass 물질수지,PFD 및 P&ID용 자료작성=4,39,6
제3절/다) 벤취규모 생성물의 정량분석 및 알파올레핀 분리용 원료규격 설정=9,44,3
제4절/라) 이산화탄소 전환반응기술의 보완을 위한 재순환 반응기 연구=11,46,4
제5절/마) 벤취규모 고정층 재순환 반응기의 연속 운전=14,49,4
제6절/바) 기-액상 생성물의 순환 조건 및 one pass 물질수지 보완,설계완성=17,52,3
제7절/사) 재순환 반응 생성물의 분석 기술=19,54,4
제8절/아 ACR 이용 기술[원본불량;p.22]=22,57,14
제2장 반응용 촉매의 대량 생산 연구=36,71,1
제1절 촉매 제조 방법 연구=36,71,19
제2절 촉매 성능 향상 연구=55,90,12
제3절 알파올레핀 선택도 향상 연구=67,102,10
제4절 비활성화 경로 연구=77,112,14
제3장/제2장 파일럿 최적화 및 운전 결과=91,126,1
제1절 안전운전을 위한 HAZOP Study=91,126,22
제2절 파일럿플랜트 공사 및 점검 내용=113,148,7
제3절 파일럿플랜트 최적화 작업 내용=120,155,20
제4절 Pilot Plant 운전 결과=140,175,14
제4장 파일럿플랜트 공정설명 및 운전 매뉴얼=154,189,1
제1절 Design Basis=154,189,4
제2절 Process Description=157,192,5
제3절 Utility=162,197,3
제4절 Equipment=164,199,10
제5절 Control System=173,208,3
제6절 Start-up Procedure=175,210,5
제7절 Catalyst Reduction=179,214,6
제8절 Normal Operation=184,219,11
제9절 Emergency Procedure=194,229,4
제10절 Instrumental Analysis=197,232,3
참고문헌=200,235,2
부록=202,237,1
첨부 1:PFB와 물질수지=203,238,6
첨부 2:P&ID=209,244,6
첨부 3:Equipment List=215,250,46
첨부 4:Line List=261,296,4
첨부 5:Instrument List=265,300,7
첨부 6:분리공정 Screening 및 Simulation 결과=272,307,31
첨부 7:환원 및 전환반응 운전 Data=303,338,10
Figure 1-1. Prepared calalysts with various particle sizes and shapes in KRICT=4,39,1
Figure 1-2. Photograph of bench-scale fixed bed reactor=5,40,1
Figure 1-3. Pressure loss in the fixed bed reactor=6,41,1
Figure 1-4. Effects of dpcat(이미지참조) on XCO2(이미지참조)=6,41,1
Figure 1-5. Temperature profile in the fixed bed=7,42,1
Figure 1-6. Comparison of XCO2(이미지참조) between the calculated and the experimentally obtained values=7,42,1
Figure 1-7. Mass balance in the bench scale fixed bed reactor=8,43,1
Figure 1-8. Process flow diagram for a pilot scale fixed bed reactor=9,44,1
Figure 1-10. GC of gas fraction of reaction mixture separated by PoraPlot Q column and FID=10,45,1
Figure 1-11. Gas chromatogram of the liquid hydrocarbon in the fixed bed=10,45,2
Figure 1-12. Effects of R on the XCO2(이미지참조),YHC(이미지참조) and YCO(이미지참조) in a fixed bed recycle reactor=14,49,1
Figure 1-13. Effects of SVT on the XCO2(이미지참조),YHC(이미지참조) and YCO(이미지참조) in a fixed bed recycle reactor=14,49,1
Figure 1-14. Life time test in the bench-scale fixed bed recycle reactors=16,51,1
Figure 1-15. Example of mass balance in the bench scale fixed bed recycle reactor=17,52,1
Figure 1-16. Basic process flow diagram of fixed bed reaction system=18,53,1
Figure 1-17. MFT fixed bed reactor=19,54,1
Figure 1-18. GC of gas fraction of recycle reaction mixture separated by Carbonsphere column with TCD=20,55,1
Figure 1-19. GC of gas fraction of recycle reaction mixture separated by PoraPlot Q column with FID=20,55,1
Figure 1-20. Gas chromatogram of the wax in the recycle reactor=21,56,1
Figure 1-21. GC/MS of organic Compound in water phase[원본불량;p.22]=22,57,1
Figure 1-22. Experimental apparatus of the fluidized bed reactor=23,58,1
Figure 1-23. Experimental apparatus of the slurry reactor=24,59,1
Figure 1-24. Effects of gas velocity on the XCO2(이미지참조),YHC(이미지참조) and YCO(이미지참조) in the fluidized bed reactor=25,60,1
Figure 1-25. Effects of space velocity on the XCO2(이미지참조),YHC(이미지참조) and YCO(이미지참조) in the fluidized bed reactor=25,60,1
Figure 1-26. Effects of gas velocity on the space-time-yield in the fluidized bed reactor=27,62,1
Figure 1-27. Effects of temperature on the XCO2(이미지참조),YHC(이미지참조) and YCO(이미지참조) in the fluidized bed reactor=27,62,1
Figure 1-28. Effects of pressure on the XCO2(이미지참조),YHC(이미지참조) and YCO(이미지참조) in the fluidized bed reactor=28,63,1
Figure 1-29. Effects of H₂/CO₂ ratio on the XCO2(이미지참조),YHC(이미지참조) and YCO(이미지참조) in the fluidized bed reactor=28,63,1
Figure 1-30. Effects of gas velocity on the XCO2(이미지참조),YHC(이미지참조) and YCO(이미지참조) in the slurry reactor=30,65,1
Figure 1-31. Effects of space velocity on tthe XCO2(이미지참조),YHC(이미지참조) and YCO(이미지참조) in the slurry reactor=30,65,1
Figure 1-32. Effects of gas on the space- time-yield in the slurry reactor=31,66,1
Figure 1-33. Effects of temperature on the the XCO2(이미지참조),YHC(이미지참조) and YCO(이미지참조) in the slurry reactor=31,66,1
Figure 1-34. Effects of pressure on the XCO2(이미지참조),YHC(이미지참조) and YCO(이미지참조) in the slury reactor=32,67,1
Figure 1-35. Effects Of H₂/CO₂ ratio on the XCO2(이미지참조),YHC(이미지참조) and YCO(이미지참조) in the slurry reactor=32,67,1
Figure 1-36. Molecular weight distribution of hydrocarbons as a function of the carbon number=33,68,1
Figure 1-37. Olefin-(1) content in linear hydrocarbons as a function of the carbon number=33,68,1
Figure 1-38. Characteristics of the multiphase calalytic reactors for the carbon dioxide hydrogenation=34,69,1
Figure 1-39. Optimum process parameter obtained with different types of reactor for the carbon dioxide hydrogenation=34,69,1
Figure 2-1. 촉매 제조 반응기=36,71,1
Figure 2-2. impeller type=37,72,1
Figure 2-3. impeller type에 따른 혼합 효과=37,72,1
Figure 2-4. impeller 형태별 교반 속도에 따른 혼합 효과=38,73,1
Figure 2-5. 촉매 크기에 따른 압력 강하=41,76,1
Figure 2-6. 촉매 입자의 크기에 따른 반응물 농도 구배=43,78,1
Figure 2-7. powder type 촉매 제조법=44,79,1
Figure 2-8. Pore size distribution=45,80,1
Figure 2-9. Morphology of Fe-K/γ-Al₂O₃=45,80,1
Figure 2-10. PVA binder를 이용한 extruding법=45,80,1
Figure 2-11. 열안정성 측정 결과=46,81,1
Figure 2-12. Sphere wetting법=47,82,1
Figure 2-13. 구형 촉매의 열안정성=48,83,1
Figure 2-14. wetting 시간에 따른 침투 정도=48,83,1
Figure 2-15. Sphere coating method의 wetting 시간에 따른 EDX image mapping=49,84,1
Figure 2-16. Single type extruder=50,85,1
Figure 2-17. 촉매 성형 절차=51,86,1
Figure 2-18. 바인더에 따른 세공 분포=53,88,1
Figure 2-19. 바인더 첨가에 따른 표면 변화=53,88,1
Figure 2-20. 성형된 촉매의 형상=54,89,1
Figure 2-21. 이산화탄소 수소화 반응 장치=55,90,1
Figure 2-22. 다양한 바인더로 성형된 촉매의 XRD profile=60,95,1
Figure 2-23. 27(이미지참조)Al MAS-NMR of Fe-K/γ-Al₂O₃=61,96,1
Figure 2-24. Pore size distribution in formed catalysts with various catalysts=62,97,1
Figure 2-25. NH₃-TPD profile of Fe-K/γ-Al₂O₃ with various binders=63,98,1
Figure 2-26. TPR profiles of Fe-K/γ-Al₂O₃ with various binders=64,99,1
Figure 2-27. TPDC profiles of Fe-K/γ-Al₂O₃ with various binders=65,100,1
Figure 2-28. The propagation and termination of CO₂ hydrogenation=66,101,1
Figure 2-29. Pore size distribution of Fe-K/r-Al₂O₃ catalysts with various aluminum loading=68,103,1
Figure 2-30. XRD patterns of Fe-K/r-Al₂O₃ catalysts with various aluminum loading=69,104,1
Figure 2-31. 27(이미지참조)Al-NMR=70,105,1
Figure 2-32. Proposed mechanism of adding aluminum metal=71,106,1
Figure 2-33. Expected models for fixation of catalysts on r-Al₂O₃=71,106,1
Figure 2-34. CO₂ Hydrogenation=72,107,1
Figure 2-35. TPDC results of various Fe-K/r-Al₂O₃ catalysts=73,108,1
Figure 2-36. Fe-C 결합세기에 따른 선택도 변화 모델=74,109,1
Figure 2-37. Effect of Internal pore structure=76,111,1
Figure 2-38. Reaction rate change with reaction time=78,113,1
Figure 2-39. Reactor temperature change with reaction time=78,113,1
Figure 2-40. Hydrocarbon activity with reaction time=79,114,1
Figure 2-41. XRD patterns with Reactor position=81,116,1
Figure 2-42. Iron phase intensity change with reactor position and time=81,116,1
Figure 2-43. Iron phase change with reactor position II=82,117,1
Figure 2-44. Mossbauer results with reactor position(Relative Transmission)=83,118,1
Figure 2-45. Mossbauer results with reactor position(Relative Area)=83,118,1
Figure 2-46. Proposed mechanism=84,119,1
Figure 2-47. Catalyst shape with reactor position:reaction time of 100h=85,120,1
Figure 2-48. Catalyst shape with reactor position:reaction time of 300h=86,121,1
Figure 2-49. Catalyst shape with reactor position:reaction time of 500h=86,121,1
Figure 2-50. TGA results with reactor position=87,122,1
Figure 2-51. DTA results with reactor position=88,123,1
Figure 2-52. coke formation mechanism=89,124,1
Figure 2-53. Morphology of carbon deposition=90,125,1
Figure 3-1. Feeding=123,158,1
Figure 3-2. Reaction=123,158,1
Figure 3-3. Separator=124,159,1
Figure 3-4. Storaging=124,159,1
Figure 3-5 Close 되어있는 지붕=125,160,1
Figure 3-6 개폐식 지붕 작업=126,161,1
Figure 3-7 커텐형식으로 된 측면 비닐 Cover=126,161,1
Figure 3-8 Chiller와 Air Comp. 측면=127,162,1
Figure 3-9 H₂ Bombe 지붕 작업=127,162,1
Figure 3-10 H₂ Bombe 측면=127,162,1
Figure 3-11 Feed Gas(왼쪽)와 Recycle Gas(오른쪽)=128,163,1
Figure 3-12 Vent Gas(왼쪽)와 GC분석장치의 Gas 주입부분(오른쪽)=128,163,1
Figure 3-13 방폭등(왼쪽)과 PSV(오른쪽)=129,164,1
Figure 3-14. E-101B Downstream 보온제거 전(왼쪽)과 후(오른쪽)=130,165,1
Figure 3-15 Reactor의 보온제거 전(왼쪽)과 후(오른쪽)=130,165,1
Figure 3-16 기존의 Line Heater가 완전히 제거된 모습=130,165,1
Figure 3-17 설치된 E-101B Downstream Line Heater의 모습=131,166,1
Figure 3-18 설치된 Reactor Line Heater와 구간별 coil 수=131,166,1
Figure 3-19 반응기 보온 작업=132,167,1
Figure 3-20 보온 작업 완료 후의 반응기=132,167,1
Figure 3-21 Ethylene Glycol(왼쪽)과 Chiller(오른쪽)=133,168,1
Figure 3-22 물품 보관함 설치 작업=134,169,1
Figure 3-23 F101에 설치된 Line Heater와 TG(왼쪽),교체 후의 E-101B(오른쪽)=135,170,1
Figure 3-24 F101,E-101B 보온 작업=135,170,1
Figure 3-25/Figure 7-25 설치된 Reactor A/B와 C/D의 TG=136,171,1
Figure 3-26 추가 설치된 3마력 Compressor(왼쪽)와 Common Line(오른쪽)=136,171,1
Figure 3-27 Recycle Gas Control Valve와 유량계=137,172,1
Figure 3-28 설치 완료된 Rotameter=138,173,1
Figure 3-29 Sight Glass가 설치된 F-103의 모습=139,174,1
Figure 3-30. GC-FID of liquid fraction from CO₂ to AO pilot plant=142,177,1
Figure 3-31. 원료 투입과 예열 공정 운전 조건=145,180,1
Figure 3-32. 반응기와 hot separator,recycle gas 투입 공정 운전 조건=146,181,1
Figure 3-33. cold separator,recycle gas 압축 공정 운전 조건=147,182,1
Figure 3-34. oil-water separator,제품 저장,vent gas 처리 공정 운전 조건=148,183,1
Figure 3-35. 반응기 A 온도 profile=149,184,1
Figure 3-36. 반응기 B 온도 profile=150,185,1
Figure 3-37. 반응기 C 온도 profile=151,186,1
Figure 3-38. 반응기 D 온도 profile=152,187,1
Figure 3-39. 공정 온도 profile=153,188,1
Figure 4-1. Process flow Diagram - Once Through Mode=159,194,1
Figure 4-2. Process Flow Diagram - Recycle Mode=160,195,1
Figure 4-3. Process Flow & Instrument Diagram - Recycle Mode=161,196,1
Figure 4-4. C-101=167,202,1
Figure 4-5. E-101A/B=167,202,1
Figure 4-6. E-102=168,203,1
Figure 4-7. E-103=168,203,1
Figure 4-8. E-105=168,203,1
Figure 4-9. T-101/102/103=169,204,1
Figure 4-10. R-101A/B/C/D=170,205,1
Figure 4-11. F-101=170,205,1
Figure 4-12. F-102=171,206,1
Figure 4-13. F-103=171,206,1
Figure 4-14. F-104=171,206,1
Figure 4-15. F-105=172,207,1
Figure 4-16. X-104=172,207,1
Figure 4-17. X-105=173,208,1
Figure 4-18. X-106=173,208,1
Figure 4-19. 전력 Panel 내부 전원스위치=176,211,1
Figure 4-20 Flare Stack=179,214,1
Figure 4-21 H₂ Stream=180,215,1
Figure 4-22 촉매 Loading=180,215,1
Figure 4-23. Pressure Regulator=181,216,1
Figure 4-24. Panel 내의 Stroke 조절기=182,217,1
Figure 4-25. N₂ 공급여부 확인=183,218,1
Figure 4-26 Feed Stream=185,220,1
Figure 4-27 N₂ Stream=185,220,1
Figure 4-28 Once-through mode시 open하여야 할 Valve=187,222,1
Figure 4-29 Feed Stream=189,224,1
Figure 4-30 N₂ Stream=189,224,1
Figure 4-31 ESD switch=194,229,1
Figure 4-32 가스 분석용 G/C=198,233,1
Figure 4-33 CO₂ 분석기=198,233,1
*표시는 필수 입력사항입니다.
| 전화번호 |
|---|
| 기사명 | 저자명 | 페이지 | 원문 | 기사목차 |
|---|
| 번호 | 발행일자 | 권호명 | 제본정보 | 자료실 | 원문 | 신청 페이지 |
|---|
도서위치안내: / 서가번호:

우편복사 목록담기를 완료하였습니다.
*표시는 필수 입력사항입니다.
저장 되었습니다.
