
 대표어
권호기사보기
| 기사명 | 저자명 | 페이지 | 원문 | 기사목차 |
|---|
결과 내 검색
동의어 포함
목차
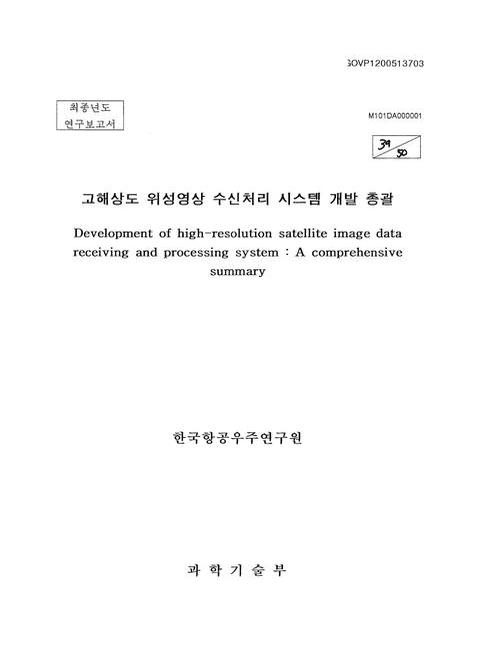
표제지=0,1,1
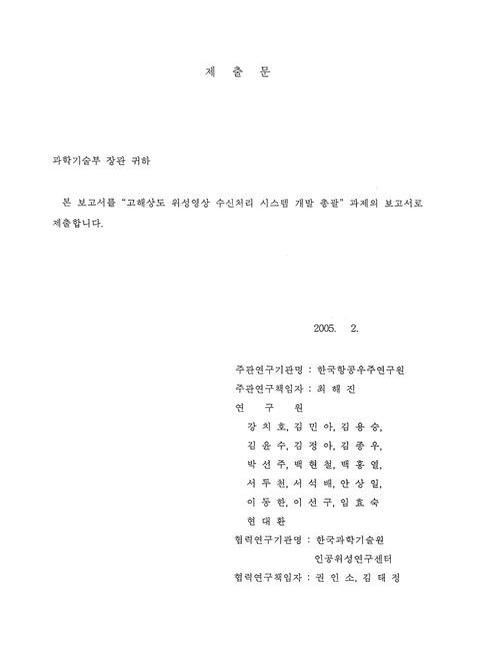
제출문=0,2,1
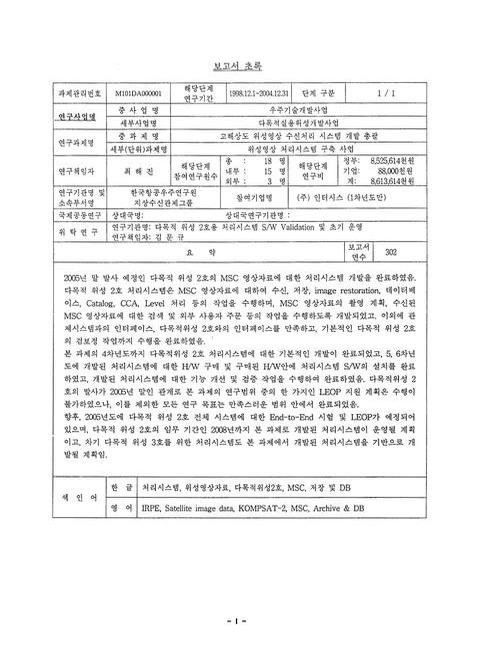
보고서 초록/최해진=I,3,1
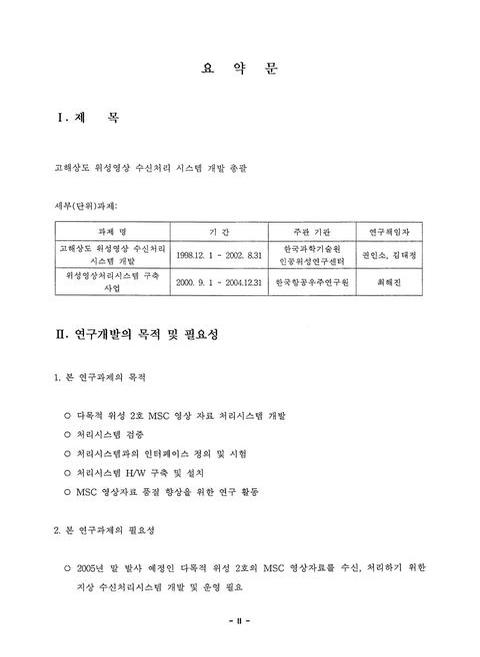
요약문=II,4,9
SUMMARY=XI,13,3
CONTENTS=XIV,16,1
목차=XV,17,1
표목차=XVI,18,2
그림목차=XVIII,20,6
제1장 연구개발과제의 개요=1,26,1
제1절 연구개발의 배경 및 필요성=1,26,5
제2절 연구의 목표 및 내용=6,31,10
제2장 국내외 기술개발 현황=16,41,5
제3장 연구 개발 수행 내용 및 결과=21,46,1
제1절 고해상도 위성영상 수신처리시스템 개발=21,46,1
제2절 위성영상처리시스템 구축 사업=22,47,1
1. 서론=22,47,1
2. 처리시스템 개발 관리,설치,운영=22,47,42
3. 처리시스템 관련 개발 업무=64,89,50
4. 처리시스템 시험=114,139,38
5. 관제-수신 인터페이스=152,177,31
6. MSC 검보정 지원=183,208,40
7. 처리시스템 부수 장비 구매,설치=223,248,12
8. 영상 자료 처리 관련 연구 업무=235,260,42
9. 위성 영상 품질 향상을 위한 지상 시험 연구=277,302,1
10. 위탁과제-다목적 위성 2호용 처리시스템 S/W Validation 및 초기 운영=278,303,8
11. 결론=286,311,1
제4장 목표 달성도 및 관련분야에의 기여도=287,312,6
제5장 연구개발결과의 활용계획=293,318,1
제6장 연구개발과정에서 수집한 해외과학기술정보=294,319,7
제7장 참고문헌=301,326,2
특정연구개발사업 연구결과 활용계획서=1,328,20
영문목차
[title page etc.]=0,1,15
CONTENTS=0,16,10
Chapter 1. Summary of Research & Development=1,26,1
1. Research Need and Background=1,26,5
2. Research Objectives and Contents=6,31,10
Chapter 2. Domestic and Oversea Trend of Technological Development=16,41,5
Chapter 3. Outline and Results of Research Developments=21,46,1
Section 1. Development of high-resolution satellite image data receiving and processing system=21,46,1
Section 2. Foundation of the satellite image data processing system=22,47,1
1. Introduction=22,47,1
2. Development,Administrator,Installation and Operation of DPF=22,47,42
3. Developing Works within DPF=64,89,50
4. DPF Test=114,139,38
5. The Interface between MCE and IRPE=152,177,31
6. The Works of Calibration and Validation=183,208,40
7. Procurement of DPF H/W equipments=223,248,12
8. Research works of MSC image data processing=235,260,42
9. A Study on Ground Test for Satellite Image Enhancement=277,302,1
10. Contract Project-KOMPSAT-2 Image Processing System S/W Validation and LEOP=278,303,8
11. Conclusion=286,311,1
Chapter 4. Level of Achievement and Contribution to Related Fields=287,312,6
Chapter 5. Application Plan for Research Outcomes=293,318,1
Chapter 6. Foreign Science and Technology Information Collected During the Research & Developmental Period=294,319,7
Chapter 7. References=301,326,22
그림 1-1. 해상도별 위성영상 비교=1,26,1
그림 1-2. 위성영상자료 수요 시장 규모 비교=3,28,1
그림 3-1. MSC 영상 자료 처리 Level definition=23,48,1
그림 3-2. 백업 방식=25,50,1
그림 3-3. 수신/처리 시스템 전체 구성도=33,58,1
그림 3-4. 처리시스템 구성도=33,58,1
그림 3-5. SaTReC 처리시스템 S/W 구성도=51,76,1
그림 3-6. SaTReC 처리시스템 S/W 모듈=52,77,1
그림 3-7. CAP GUI 화면=53,78,1
그림 3-8. CBI GUI 화면=54,79,1
그림 3-9. OM GUI 화면=55,80,1
그림 3-10. SIM GUI 화면=56,81,1
그림 3-11. MIS GUI 화면=58,83,1
그림 3-12. PSS GUI 화면=59,84,1
그림 3-13. catalogue Search and Order Ingest=60,85,1
그림 3-14. Acquisition Request Process=61,86,1
그림 3-15. Pass Data Handling=62,87,1
그림 3-16. Image Product Generation Order=63,88,1
그림 3-17. Distribution Order Handling=63,88,1
그림 3-18. BMS와 AMS 인터페이스 H/W 구성도=65,90,1
그림 3-19. BMS 데이터 흐름도(DFD)=68,93,1
그림 3-20. BMS 이벤트 시나리오=68,93,1
그림 3-21. BMS 백업 이벤트 시나리오=69,94,1
그림 3-22. BMS 복구 이벤트 시나리오=69,94,1
그림 3-23. BMS 검색 이벤트 시나리오=70,95,1
그림 3-24. ODBC 설정 화면=70,95,1
그림 3-25. MS-SQL ODBC 설정 화면 1=71,96,1
그림 3-26. MS-SQL ODBC 설정 화면 2=71,96,1
그림 3-27. MS-SQL ODBC 설정 화면 3=72,97,1
그림 3-28. MS-SQL ODBC 설정 화면 4=72,97,1
그림 3-29. MS-SQL ODBC 설정 화면 5=73,98,1
그림 3-30. MS-SQL ODBC 설정 화면 6=73,98,1
그림 3-31. MS-SQL ODBC 설정 화면 7=73,98,1
그림 3-32. MS-SQL ODBC 설정 화면 8=74,99,1
그림 3-33. Oracle ODBC 설정 화면 1=74,99,1
그림 3-34. Oracle ODBC 설정 화면 2=75,100,1
그림 3-35. Microsoft ODBC 설정 화면=75,100,1
그림 3-36. Oracle ODBC 설정 화면 3=76,101,1
그림 3-37. Oracle ODBC 설정 화면 4=76,101,1
그림 3-38. Oracle ODBC 설정 화면 5=76,101,1
그림 3-39. DB Sync S/W 실행화면 1=86,111,1
그림 3-40. DB Sync S/W 실행화면 2=87,112,1
그림 3-41. DB Sync S/W 실행화면 3=87,112,1
그림 3-42. DB Sync S/W 실행화면 4=88,113,1
그림 3-43. DB Sync S/W 실행화면 5=88,113,2
그림 3-44. DB Sync S/W 실행화면 7=90,115,1
그림 3-45. EZStor 구성도=91,116,1
그림 3-46. EZStor의 Dll 구성도=92,117,1
그림 3-47. EZStor의 작업 Flow=93,118,1
그림 3-48. ROM Administrator와Jukebox Administrator의 구성도=93,118,1
그림 3-49. Image creating Flow=103,128,1
그림 3-50. Burning Flow=106,131,1
그림 3-51. ROM Administrator기본화면=107,132,1
그림 3-52. JukeBox Administrator의 기본화면=108,133,1
그림 3-54. 통합 시험 화면=119,144,1
그림 3-55. 전체 테스트 환경=127,152,1
그림 3-56. RAS 테스트 환경=128,153,1
그림 3-57. PLS와 RAS의 연결 방법=128,153,1
그림 3-58. SPS 시험 환경=129,154,1
그림 3-59. 관제-수신 운영 시나리오=152,177,1
그림 3-60. 운영 시나리오에 따른 인터페이스 자료=154,179,1
그림 3-61. Weekly Plan=159,184,1
그림 3-62. OBC Dump Data format=163,188,1
그림 3-63. 시험 환경=177,202,1
그림 3-64. 번들 조정에 사용된 EOC 좌우 영상 및 기준점 및 검사점 분포=186,211,1
그림 3-65. 거리 정확도 분포도=187,212,1
그림 3-66. Example of IKONOS Relative Spectral Response=190,215,1
그림 3-67. 다목적 위성 2호 MSC의 TDI 운영 방법=192,217,1
그림 3-68. 위성의 Jitter와 Drift에 의한 영상 자료의 영향=194,219,1
그림 3-69. TDI에 의한 위성 Yaw Steering의 필요성 및 원리=195,220,1
그림 3-70. 위성 고도에 따른 GSD의 변화(왼쪽)와 MTF의 변화(오른쪽)=195,220,1
그림 3-71. 위성의 Pitch tilt에 따른 GSD의 변화(왼쪽)와 MTF의 변화(오른쪽)=196,221,1
그림 3-72. 위성의 Roll tilt에 따른 GSD의 변화(왼쪽)와 MTF의 변화(오른쪽)=196,221,1
그림 3-73. Pitch(왼쪽) & Roll(오른쪽) tilt를 함에 따라 TDI에 의한 위성 영상에 대한 영향=197,222,1
그림 3-74. TDI에 의한 Roll tilt와 Line rate와의 관계(왼쪽),Line rata과 MTF와의 관계(오른쪽)=197,222,1
그림 3-75. CCD pixel 상의 위치별 위성의 Roll tilt angle에 따른 GSD의 변화(왼쪽)와 Line rate 값의 변화(오른쪽)=198,223,1
그림 3-76. CCD pixel 상의 위치별 위성의 Pitch tilt angle에 따른 GSD의 변화(왼쪽)와 Line rate 값의 변화(오른쪽)=198,223,1
그림 3-77. Science mode attitude Determination data flow=199,224,1
그림 3-78. AOCS Error Budget of KOMPSAT-2=200,225,1
그림 3-79. Calculation of NUC table parameters=209,234,1
그림 3-80. Description of th basic statistical approach=209,234,1
그림 3-81. MSC Frontside View=210,235,1
그림 3-82. MSC PAN channels=211,236,1
그림 3-83. Folding among PAN CCD panels=211,236,1
그림 3-84. Geometry among PAN CCD panels=212,237,1
그림 3-85. MS CCD panels=212,237,1
그림 3-86. Geometry among MS CCD panels=213,238,1
그림 3-87. When an optical system is defocused,the image of a point becomes a blurred spot. The size of the blur is determined by the relative aperture of the system and the focus shift=216,241,1
그림 3-88. Relationships used to determine the longitudinal depth of field in terms of a tolerable angular blur=216,241,1
그림 3-89. The distribution of illumination in the Airy disk. The appearance of the Airy disk is shown in the upper right=217,242,1
그림 3-90. The dashed lines represent the diffraction patterns of two point images at various separations. The solid line indicates the combined diffraction pattern. Case (b) is the Sparrow criterion for resolution. Case (c) is the Rayleigh criterion=218,243,1
그림 3-91. OPD를 설명하는 그림=218,243,1
그림 3-92. The optical path difference (OPD) introduced by a small longitudinal displacement (δ) of the reference point is equal to the index (n) times [the radius of the reference sphere (1+δ) minus the radius of the wave front (1) minus δ cos U]=219,244,1
그림 3-93. The image modulation can be plotted as a function of the frequency of the test pattern. When the modulation drops below the minimum that can be detected,the target is not resolved. (b) the system represented by (a) will produce a superior image=220,245,1
그림 3-94. The modulation transfer function of an aberration-free system (solid line). Note that frequency is expressed as a fraction of the cutoff frequency. The dashed line is the modulation factor for a square wave (bar) target. Both curves are based o=221,246,1
그림 3-95. The effect of defocusing on the modulation transfer function of an aberration-free system=221,246,1
그림 3-96. 처리시스템 H/W 구성도=223,248,1
그림 3-97. 처리시스템 S/W와 DVD back-up Jukebox와의 인터페이스=228,253,1
그림 3-98. 정규화계수(h)의 결정=240,265,1
그림 3-99. Look Vector Modeling=242,267,1
그림 3-100. RPC 생성을 위한 지상 기준점 추출 개념도=244,269,1
그림 3-101. 사용된 영상데이터=244,269,1
그림 3-102. 사용된 SPOT PAN 영상=246,271,1
그림 3-103. 기준점 분포 현황도(Red:GCP,Blue:CHK)=247,272,1
그림 3-104. 위성 영상 생성 과정=254,279,1
그림 3-105. 일반적인 MTF 보정 과정=255,280,1
그림 3-106. 아리랑 위성 1호 EOC Level 1 처리 과정=256,281,1
그림 3-107. EOC 영상에 대한 MTF 보정 알고리즘=257,282,1
그림 3-108. 시험에 사용된 아리랑 위성 1호 EOC 영상=259,284,1
그림 3-109. 시험용 샘플 영상=260,285,1
그림 3-110. 논 지역 영상에 대한 EOC Level 1R 영상-MTF=261,286,1
그림 3-111. 논 지역 영상에 대한 sharpen-MTF=261,286,1
그림 3-112. 논 지역 영상에 대한 sharpen edge-MTF=261,286,1
그림 3-113. 논 지역 영상에 대한 sharpen more-MTF=261,286,1
그림 3-114. 논 지역 영상에서의 행들의 상관관계=262,287,1
그림 3-115. 논 지역 영상에서의 열들의 상관관계=262,287,1
그림 3-116. 도시 지역 영상에 대한 EOC Level 1 영상-MTF=263,288,1
그림 3-117. 도시 지역 영상에 대한 sharpen-MTF=263,288,1
그림 3-118. 도시 지역 영상에 대한 Sharpen edge 영상-MTF=263,288,1
그림 3-119. 도시 지역 영상에 대한 sharpen more-MTF=263,288,1
그림 3-120. 도시 지역 영상에서의 행들의 상관관계=264,289,1
그림 3-121. 도시 지역 영상에서의 열들의 상관관계=264,289,1
그림 3-122. 산 지역 영상에 대한 EOC Level 1 영상-MTF=265,290,1
그림 3-123. 산 지역 영상에 대한 sharpen-MTF=265,290,1
그림 3-124. 산 지역 영상에 대한 Sharpen edge 영상-MTF=266,291,1
그림 3-125. 산 지역 영상에 대한 sharpen more-MTF=266,291,1
그림 3-126. 산 지역 영상에서의 행들의 상관관계=266,291,1
그림 3-127. 산 지역 영상에서의 열들의 상관관계=266,291,1
그림 3-128. 다목적 위성 2호용 KGRS-2=271,296,1
그림 3-129. MSC 영상 처리 절차=272,297,1
그림 3-130. 처리된 원본 영상과 Level 1G 브라우즈 영상=279,304,1
그림 3-131. 수신저장시스템 구성 변경 및 H/W 구성=282,307,1
그림 3-132. 추가 요구 사항의 반영의 결과 KOMPSAT-2 수신처리시스템 운영 환경=283,308,1
그림 3-133. 시스템 시험 순서=284,309,1
*표시는 필수 입력사항입니다.
| 전화번호 |
|---|
| 기사명 | 저자명 | 페이지 | 원문 | 기사목차 |
|---|
| 번호 | 발행일자 | 권호명 | 제본정보 | 자료실 | 원문 | 신청 페이지 |
|---|
도서위치안내: / 서가번호:

우편복사 목록담기를 완료하였습니다.
*표시는 필수 입력사항입니다.
저장 되었습니다.
