
 대표어
대표어

권호기사보기
| 기사명 | 저자명 | 페이지 | 원문 | 기사목차 |
|---|
결과 내 검색
동의어 포함
목차
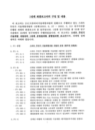
표제지=0,1,1
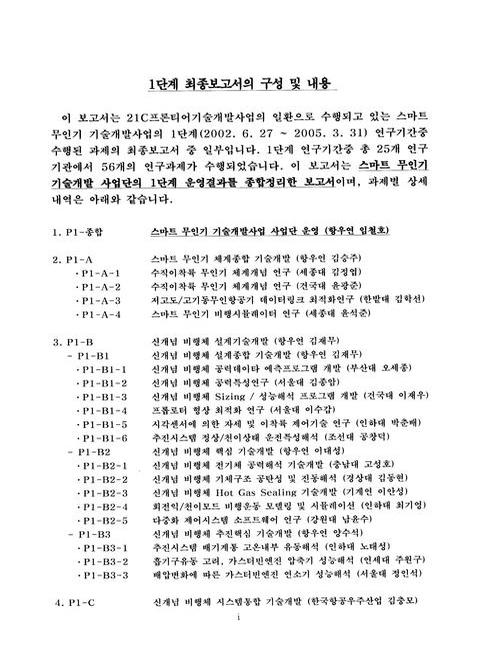
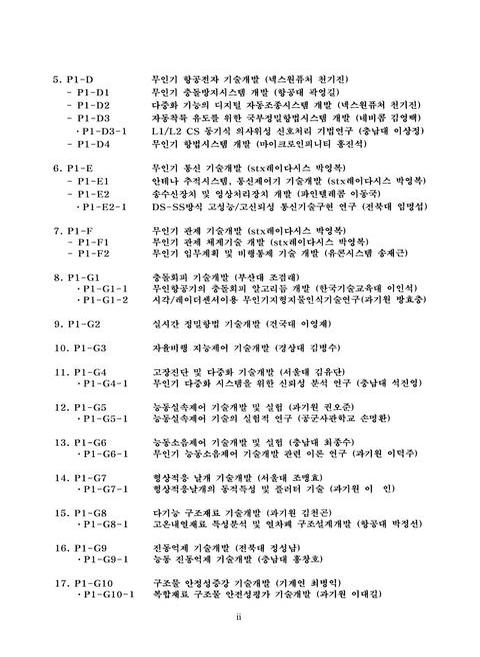
1단계 최종보고서의 구성 및 내용=0,2,2
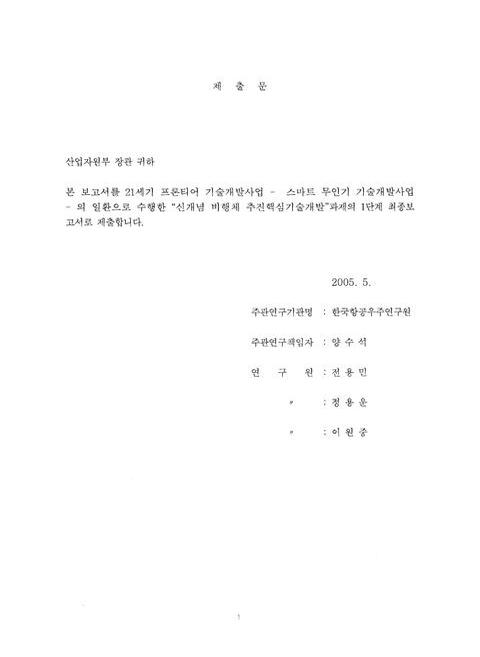
제출문=1,4,1
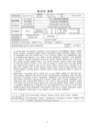
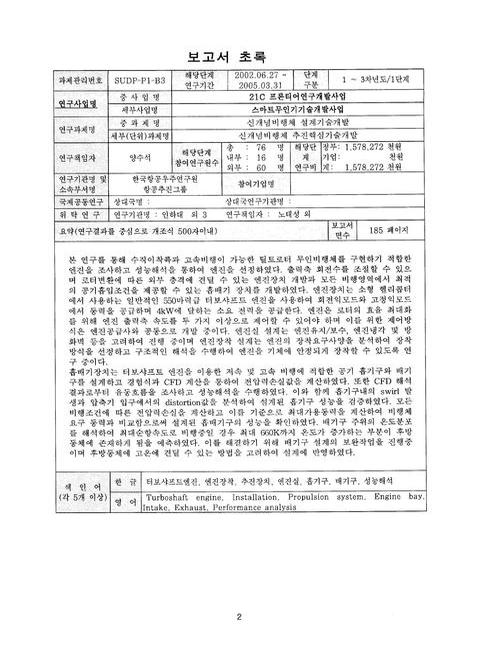
보고서 초록/양수석=2,5,1
요약문=3,6,2
SUMMARY=5,8,1
목차=6,9,2
표차례=7,10,2
그림차례=8,11,6
CONTENTS=14,17,2
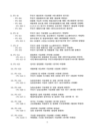
1장 연구개발과제의 개요=16,19,1
1절 연구개발 목적 및 필요성=16,19,1
1. 연구개발의 목적=16,19,1
2. 연구개발의 과학기술,사회경제적 중요성=16,19,2
3. 연구개발 범위=17,20,1
2장 국내외 기술개발 현황=18,21,1
1절 기술개발 현황=18,21,1
1. 국내=18,21,1
2. 국외=19,22,1
2절 파급효과=19,22,1
1. 국내시장의 동향 및 전망=19,22,2
2. 국외시장의 동향 및 전망=20,23,1
3장 연구개발수행 내용 및 결과=21,24,1
1절 Tipjet Rotor CRW 엔진장치=21,24,1
1. 추진장치 개요=21,24,11
2. 요구 사양 도출=31,34,3
3. 후보 엔진=33,36,5
4. 추진장치 개념연구=37,40,12
5. 회전익 추진장치 시험방안 도출=48,51,8
2 절 Tilt Rotor 엔진장치=56,59,1
1. 개요=56,59,2
2. 요구 사양 도출=57,60,13
3. 엔진별 최대허용 토크 대 작동요구 조건비교결과=69,72,1
4. 엔진선정=70,73,7
3절 엔진보기류=77,80,1
1. 오일열교환기=77,80,13
2. 시동발전기 사양분석=90,93,2
4절 흡배기장치=92,95,1
1. CRW 비행체를 위한 덕트설계=92,95,8
2. CRW 비행체를 위한 흡기구 설계=100,103,15
3. 외부물질흡입방지장치=115,118,9
4. 틸트로터를 위한 흡기구 설계=124,127,15
5. 틸트로터를 위한 배기구 설계=139,142,19
5절 연료장치=158,161,1
1. 연료계통 설계요구조건=158,161,2
2. 장치 & 요소부품 개념설계=160,163,6
4장 목표달성도 및 관련분야에서의 기여도=166,169,1
1절 목표달성도=166,169,2
2절 기여도=168,171,1
1. 1차년도 Tipjet 추진장치 개발=168,171,1
2. 2차년도,3차년도 Tilt Rotor 추진장치 개발=168,171,2
5장 연구개발결과의 활용계획=170,173,1
1절 향후 활용 계획=170,173,1
1. 추가연구의 필요성=170,173,1
2. 타 연구에의 응용=170,173,1
2절 기업화 방안=170,173,1
1. 기업화 추진방안=170,173,1
6장 해외기술과학정보:해당사항 없음=171,174,1
7장 참고문헌=172,175,2
특정연구개발사업 연구결과 활용계획서=174,177,1
[첨부 1] 연구결과활용계획서=175,178,5
[첨부 2] 기술 요약서=180,183,5
영문목차
[title page etc.]=0,1,4
Abstract=2,5,1
SUMMARY(In Korean)=3,6,2
SUMMARY(In English)=5,8,1
CONTENTS (In Korean)=6,9,8
CONTENTS (In English)=14,17,2
Chapter 1 An Introduction=16,19,1
1.1 Objectives and Necessities=16,19,1
1.1.1 Objectives=16,19,1
1.1.2 Technical,Social,and Economic Importance=16,19,2
1.1.3 R&D Range=17,20,1
Chapter 2 Status of Domestic/Oversea Technology Development=18,21,1
2.1 Technology Trend=18,21,1
2.1.1 Domestic=18,21,1
2.1.2 Oversea=19,22,1
2.2 Ripple Effect=19,22,1
2.2.1 Trend of Domestic Market=19,22,2
2.2.2 Trend of Oversea Market=20,23,1
Chapter 3 Details and Results=21,24,1
3.1 Tipjet Rotor CRW Engine System=21,24,1
3.1.1 Introduction=21,24,11
3.1.2 Requirements=31,34,3
3.1.3 Candidates=33,36,5
3.1.4 Conceptual Study for Propulsion system=37,40,12
3.1.5 Tipjet Rotor Test Plan=48,51,8
3.2 Tiltrotor Engine System=56,59,1
3.2.1 Introduction=56,59,2
3.2.2 Requirements=57,60,13
3.2.3 Max. Available vs Required Torque=69,72,1
3.2.4 Engine Selection=70,73,7
3.3 Engine Accessaries=77,80,1
3.3.1 Engine Oil Heat Exchanger=77,80,13
3.3.2 Starter-generator=90,93,2
3.4 Intake & Exhaust System=92,95,1
3.4.1 CRW Duct System Design=92,95,8
3.4.2 CRW Intake Design=100,103,15
3.4.3 FOD Protection Device=115,118,9
3.4.4 Tiltrotor Intake Design=124,127,15
3.4.5 Tiltrotor Exhaust Design=139,142,19
3.5 Fuel System=158,161,1
3.5.1 Requirements=158,161,2
3.5.2 Layout Design=160,163,6
Chapter 4 Degree of Fulfillment and Contribution=166,169,1
4.1 Fulfillment=166,169,2
4.2 Contribution=168,171,1
4.2.1 Tipjet Propulsion System Development=168,171,1
4.2.2 Tiltrotor Propulsion System Development=168,171,2
Chapter 5 Plan for Applications of the Present Results=170,173,1
5.1 Future Application Plans=170,173,1
5.1.1 Requirement for the Additional Research=170,173,1
5.1.2 Applications on the other Research=170,173,1
5.2 Commercialization=170,173,1
5.2.1 Commercialization Plans=170,173,1
Chapter 6 Oversea Technology Information=171,174,1
Chapter 7 Reference Documents=172,175,2
Application Plans=174,177,1
[Annex 1]=175,178,5
[Annex 2]=180,183,5
Fig. 1.1.1 Tipjet rotor CRW drawing=21,24,1
Fig. 1.1.2 Schematics of tipjet rotor CRW propulsion system=22,25,1
Fig. 1.1.3 Gas schemes for tipjet rotor=23,26,1
Fig. 1.1.4 Butterfly valve schematics=28,31,1
Fig. 1.1.5 Flow direction of exhaust gas as to flight mode=29,32,1
Fig. 1.1.6 Plug nozzle=30,33,1
Fig. 1.1.7 Typical variable nozzle=31,34,1
Fig. 1.3.1 Schematics of turbojet engine performance analysis=37,40,1
Fig. 1.3.2 Schematics of turbofan engine performance analysis=37,40,1
Fig. 1.4.1 Schematics of SUAV propulsion system=38,41,1
Fig. 1.4.2 Flowchart of inner duct analysis=39,42,1
Fig. 1.4.3 Parts for the curved duct loss coefficient application=40,43,1
Fig. 1.4.4 Analysis results of loss coefficient sensitivity=41,44,1
Fig. 1.4.5 Analysis of engine operating character at install=42,45,1
Fig. 1.4.5 Sensitivity analysis of propulsion system to main factors=43,46,1
Fig. 1.4.6 Main influence factor on propulsion system=43,46,1
Fig. 1.4.7 Profile analysis of initial duct=44,47,1
Fig. 1.4.8 Propulsion system performance analysis of case1 profile to operating condition=45,48,1
Fig. 1.4.9 Propulsion system performance analysis to blade duct area variation(Case2,3)=46,49,1
Fig. 1.4.10 Propulsion system performance analysis as to the nozzle area variation(Case4,5)=47,50,1
Fig. 1.4.11 Propulsion system performance analysis as to the RPM(Case6,7)=47,50,1
Fig. 1.5.1 Forces around the tipjet rotor=49,52,1
Fig. 1.5.2 Excessive power measuring mechanism=51,54,1
Fig. 1.5.3 Tipjet power measuring mechanism=51,54,1
Fig. 1.5.4 Aerodynamic measuring mechanism=52,55,1
Fig. 1.5.5 Test facility P&ID for SUAV propulsion system=53,56,1
Fig. 1.5.6 Test room layout for SUAV propulsion system=53,56,1
Fig. 1.5.7 Test facility layout for SUAV propulsion system=54,57,1
Fig. 2.1.1 Eagle eye inner layout=56,59,1
Fig. 2.1.2 Propulsion system internal interface layout=57,60,1
Fig. 2.2.1 Engine operating envelop=58,61,1
Fig. 2.2.2 Candidates for SUAV program=62,65,1
Fig. 2.2.3 PWC engine installation demo=65,68,1
Fig. 2.2.4 RR250 engine installation demo=65,68,1
Fig. 2.4.1 Uninstalled engine performance=75,78,1
Fig. 2.4.2 Engine installed performance=75,78,1
Fig. 2.4.3 Engine performance deviation=76,79,1
Fig. 3.1.1 Layout of general engine oil=78,81,1
Fig. 3.1.2 PWC Oil cooling requirement diagram=79,82,1
Fig. 3.1.3 Rolls-Royce oil cooling requirement diagram=80,83,1
Fig. 3.1.4 Honeywell engine oil cooling requirements curve=81,84,1
Fig. 3.1.5 P/N:B0498 or P/N 23118=84,87,1
Fig. 3.1.6 P/N:53139=84,87,1
Fig. 3.1.7 P/N:53139 installation layout=85,88,1
Fig. 3.1.8 P/N:37.013.20.000=86,89,1
Fig. 3.1.9 P/N:37.038.23.000=86,89,1
Fig. 3.1.10 P/N:37.038.23.000 installation layout=87,90,1
Fig. 3.1.11 P/N:37.019.23.000=87,90,1
Fig. 3.1.12 P/N:37.019.23.000 Installation Layout=88,91,1
Fig. 3.1.13 P/N:220105=88,91,1
Fig. 3.1.14 P/N:220105 installation layout=89,92,1
Fig. 3.1.15 Summary of Oil Heat Exchanger=89,92,1
Fig. 4.1.1 Schematic diagram of propulsion duct system=92,95,1
Fig. 4.1.2 Schematic diagram of tipjet driven=94,97,1
Fig. 4.1.3 Designed propulsion duct system=94,97,1
Fig. 4.1.4 Basic pressure loss coefficient and various bending duct=95,98,1
Fig. 4.1.5 Streamline and pressure(a;c;e),velocity contour(b;d;f) of various type bending duct=97,100,1
Fig. 4.1.6 Total pressure contour in the bending & dividing duct=97,100,1
Fig. 4.1.7 Schematic diagram of duct system=98,101,1
Fig. 4.1.8 Comparison of 1-D analysis and 3-D CFD result=98,101,1
Fig. 4.1.9 Contour of various parameter in the duct system=99,102,1
Fig. 4.2.1 Examples of straight through inlets=100,103,1
Fig. 4.2.2 Podded nacelle inlet=101,104,1
Fig. 4.2.3 Various type of engine intake=101,104,1
Fig. 4.2.4 Subsonic bifurcated inlet=102,105,1
Fig. 4.2.5 Intake duct in an airstream=102,105,1
Fig. 4.2.6 Typical pressure recovery of helicopter intakes=103,106,1
Fig. 4.2.7 PWC 206C engine (side intake)=103,106,1
Fig. 4.2.8 Sideways-facing intake=104,107,1
Fig. 4.2.9 Plenum chamber intake=104,107,1
Fig. 4.2.10 Nature of flow retardation=105,108,1
Fig. 4.2.11 Inlet shape=106,109,1
Fig. 4.2.12 S-type inlet duct model=106,109,1
Fig. 4.2.13 Streamline in the hovering condition=106,109,1
Fig. 4.2.14 Streamline around inclined intake=107,110,1
Fig. 4.2.15 Total pressure distribution at five sections=107,110,1
Fig. 4.2.16 Illustration of total pressure and distortion coefficient=108,111,1
Fig. 4.2.17 Total pressure distribution=109,112,1
Fig. 4.2.18 NACA submerged intake=110,113,1
Fig. 4.2.19 Sketch of submerged-duct entrance=110,113,1
Fig. 4.2.20 NACA submerged intake of MD Explorer helicopter=111,114,1
Fig. 4.2.21 Submerged intake installation on a model of a fighter airplane=112,115,1
Fig. 4.2.22 Schematic drawing general arrangement of fighter airplane model with NACA submerged intake installed=112,115,1
Fig. 4.2.23 Coordinate of the standard curved diverging ramp configurations=113,116,1
Fig. 4.2.24 The variation of entrance ram-recovery with inlet-velocity ratio=113,116,1
Fig. 4.2.25 The variation of ram-recovery ratio measured after diffusion=114,117,1
Fig. 4.2.26 The variation of total pressure loss=114,117,1
Fig. 4.3.1 PWC 207D=116,119,1
Fig. 4.3.2 Particle size distribution for various type of sand=116,119,1
Fig. 4.3.3 Various helicopter installed a debris screen=116,119,1
Fig. 4.3.4 Variation of pressure-drop coefficient with solidity=117,120,1
Fig. 4.3.5 Integral particle separator incorporated with T700 engine=118,121,1
Fig. 4.3.6 AC Coarse efficiency vs pressure loss=118,121,1
Fig. 4.3.7 Bypass duct schematic drawing=119,122,1
Fig. 4.3.8 IPS model incorporated with TR-S2=119,122,1
Fig. 4.3.9 Principle drawing of Centrisep=119,122,1
Fig. 4.3.10 Centrisep installed in (a) CH-47;(b) SB 427=120,123,1
Fig. 4.3.11 Intake of Puma helicopter=120,123,1
Fig. 4.3.12 Schematic drawing of intake system installed the Centrisep=121,124,1
Fig. 4.3.13 Eurocopter installing the Aerofilter=122,125,1
Fig. 4.4.1 Candidate turboshaft engine=124,127,1
Fig. 4.4.2 Schematic drawing of intake system=125,128,1
Fig. 4.4.3 Engine power loss related to the total pressure recovery=125,128,1
Fig. 4.4.4 Cross-section view of plenum chamber=126,129,1
Fig. 4.4.5 Front view of inlet system=126,129,1
Fig. 4.4.6 Cross-section area in the intake duct=127,130,1
Fig. 4.4.7 PWC206C cutaway drawing=127,130,1
Fig. 4.4.8 Pressure recovery at the design point=128,131,1
Fig. 4.4.9 Inlet 3D drawing:(a)(b) side view;(c) top view=129,132,1
Fig. 4.4.10 Design drawing of inlet system=129,132,1
Fig. 4.4.11 Intake model installed in the fuselage=129,132,1
Fig. 4.4.12 Grid and boundary conditions=130,133,1
Fig. 4.4.13 Pressure contour (a,c) and velocity distribution (b,d) at (a-b) hovering=132,135,1
Fig. 4.4.14 Monitering station=132,135,1
Fig. 4.4.15 Total pressure loss in the intake system=133,136,1
Fig. 4.4.16 Total pressure distribution and streamlines at several flight conditions:(a) Hovering;(b) M=0.1;(c) M=0.2;(d) M=0.3=133,136,1
Fig. 4.4.17 Total pressure loss related to the inlet face area=134,137,1
Fig. 4.4.18 Total pressure loss in the intake system=135,138,1
Fig. 4.4.19 Streamline distribution in the case of side wind(15㎧)=136,139,1
Fig. 4.4.20 Total pressure distribution at the compressor inlet=137,140,1
Fig. 4.4.21 Total pressure loss in the intake system with wind direction=138,141,1
Fig. 4.4.22 Streamline distribution in the case of back wind(15㎧)=138,141,1
Fig. 4.5.1 Conceptual design of exhaust system=139,142,1
Fig. 4.5.2 Schematic drawing of SB427 exhaust system=140,143,1
Fig. 4.5.3 Conceptual design of exhaust system=140,143,1
Fig. 4.5.4 Drawing of exhaust system=141,144,1
Fig. 4.5.6 Designed parameter of exhaust system=141,144,1
Fig. 4.5.5 Examples of helicopter exhaust system=142,145,1
Fig. 4.5.7 Catia model of exhaust system=143,146,1
Fig. 4.5.8 Exhaust system installed in the fuselage=143,146,1
Fig. 4.5.9 Installation drawing of exhaust system=144,147,1
Fig. 4.5.10 Grid of exhaust system=145,148,1
Fig. 4.5.11 Mach number contour in the hovering condition=145,148,1
Fig. 4.5.12 Temperature(a-d) and velocity contour(e-h) in the various flight condition=146,149,1
Fig. 4.5.13 Temperature distribution on the rear fuselage surface:(a) hovering flight;(b) loiter flight;(c) cruise flight;(d) maximum cruise flight=147,150,1
Fig. 4.5.14 Loss coefficient,Kb*=148,151,1
Fig. 4.5.15 Reynolds number correction factors=148,151,1
Fig. 4.5.16 Outlet tangent correction=149,152,1
Fig. 4.5.17 Total pressure loss according to the flight velocity=149,152,1
Fig. 4.5.18 Grid for exhaust system analysis=151,154,1
Fig. 4.5.19 Streamline in the max. cruise condition=152,155,1
Fig. 4.5.20 Temperature(a-d) and velocity contour(e-h) in the various flight condition=153,156,1
Fig. 4.5.21 Temperature distribution on the rear fuselage surface=154,157,1
Fig. 4.5.22 Temperature(a-d) and velocity contour(e-h) according to the discharging rate of engine bay cooling air=155,158,1
Fig. 4.5.23 Temperature distribution on the rear fuselage surface according to the discharging rate of engine bay cooling air=156,159,1
Fig. 4.5.24 Total pressure loss related to the flight velocity at (a) sea level;(b) 3㎞ altitude=156,159,1
Fig. 4.5.25 Velocity and temperature distribution in the case of side wind (15㎧)=157,160,1
Fig. 5.1.1 Aviation fuel specific gravity=159,162,1
Fig. 5.2.1 Fuel tank layout concept=161,164,1
Fig. 5.2.2 Fuel pump=162,165,1
Fig. 5.2.3 Jet pump=162,165,1
Fig. 5.2.4 Stop valve=162,165,1
Fig. 5.2.5 Fuel filter=162,165,1
Fig. 5.2.6 Water seperator=162,165,1
Fig. 5.2.7 Fuel supply and transfer layout=163,166,1
Fig. 5.2.8 Fuel supply and discharge system layout=164,167,1
Fig. 5.2.9 Fuel vent system=164,167,1
Fig. 5.2.10 Fuel measurement and control system=165,168,1
*표시는 필수 입력사항입니다.
| 전화번호 |
|---|
| 기사명 | 저자명 | 페이지 | 원문 | 기사목차 |
|---|
| 번호 | 발행일자 | 권호명 | 제본정보 | 자료실 | 원문 | 신청 페이지 |
|---|
도서위치안내: / 서가번호:

우편복사 목록담기를 완료하였습니다.
*표시는 필수 입력사항입니다.
저장 되었습니다.
