
 대표어
권호기사보기
| 기사명 | 저자명 | 페이지 | 원문 | 기사목차 |
|---|
결과 내 검색
동의어 포함
목차
표제지=0,1,1
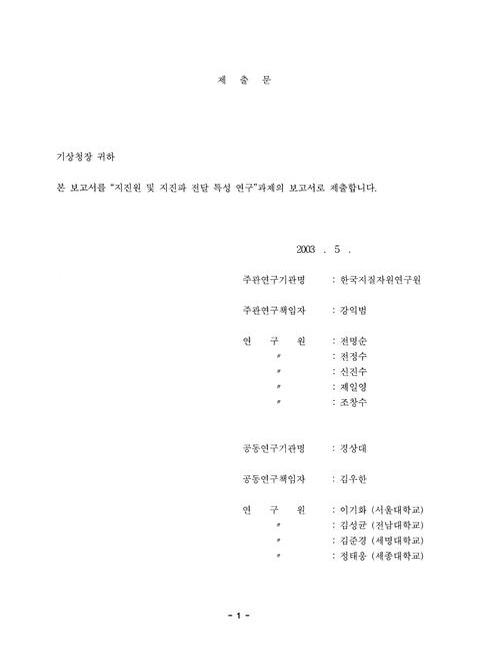
제출문=1,2,1
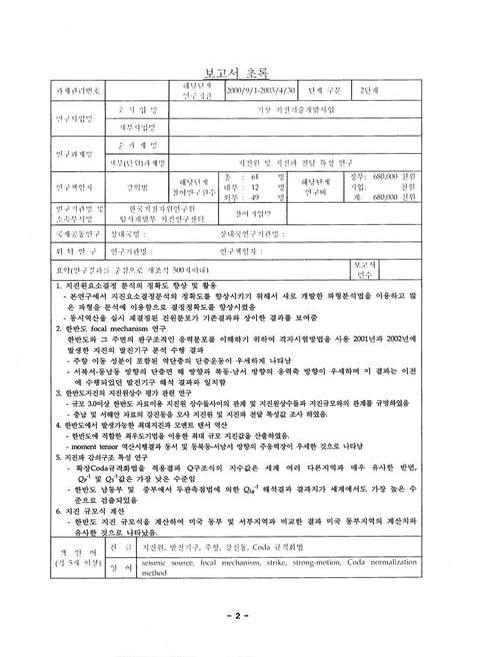
보고서 초록/강익범=2,3,1
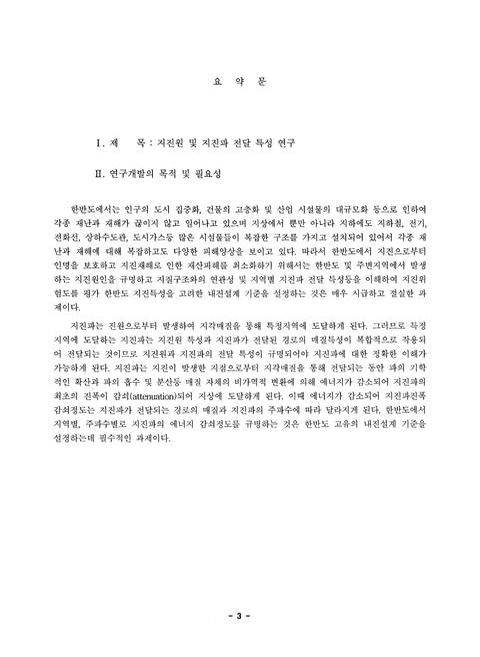
요약문=3,4,5
SUMMARY=8,9,7
CONTENTS=15,16,1
목차=16,17,1
List of Tables=17,18,2
List of Figures=19,20,4
제1장 서론=23,24,1
제2장 국내외 기술개발 현황=24,25,2
제3장 기술개발 수행내용 및 결과=26,27,1
제1절 지진요소 결정 정확도 향상 program 개발 및 진원위치 재결정(2002년 12월 10일 철원지진에 관한 연구)=26,27,15
제2절 한반도 지진발생 메카니즘 규명=41,42,12
제3절 한반도에서 발생가능한 최대지진=53,54,8
제4절 한반도 발생지진의 지진원상수=61,62,11
제5절 한반도 고유의 지진원 평가 관련연구 및 지진 모멘트 텐서 연구=72,73,5
제6절 한반도 지진파 감쇠 특성연구=77,78,43
제7절 한반도 동남부에서 역산을 통한 지진원요소 재분석=120,121,11
제8절 ScS파를 이용한 coda wave 분석=131,132,3
제9절 한반도 지진 재해도 작성을 위한 한반도 지진 규모 계산식에 관한 연구=134,135,5
제10절 결론 및 토의=139,140,2
제4장 기술개발목표 달성도 및 대외 기여도=141,142,2
제5장 기술개발결과의 활용계획=143,144,1
연구결과 활용계획서=144,145,13
영문목차
[title page etc.]=0,1,15
CONTENTS=15,16,8
Chapter 1. Introduction=23,24,1
Chapter 2. Status of domestic and international study of this field=24,25,2
Chapter 3. Contents and Results of the study=26,27,1
Section 1. Development of program for improvement on determination of precise location and origin time and its application to relocation=26,27,15
Section 2. The research on focal mechanism in Korea=41,42,12
Section 3. Estimation of probable maximum magnitude of earthquake in Korea=53,54,8
Section 4. Estimation of seismic source parameters in Korea=61,62,11
Section 5. Inversion process for seismic source parameters and progagation constants and moment tensor inversion=72,73,5
Section 6. The research on attenuation(Q) factor in Korea=77,78,43
Section 7. Reanalysis of location and origin time through inversion process in southeastern Korea=120,121,11
Section 8. A classification of the coda based on the envelope characteristics before and after the ScS arrival=131,132,3
Section 9. Research on local magnitude scale in Korea=134,135,5
Section 10. Result and Discussion=139,140,2
Chapter 4. The degree of accomplishment to milestone and contribution=141,142,2
Chapter 5. Future plan for development and application of this study=143,144,14
Fig. 3-1-1. Crustal velocity structure used in this study=28,29,1
Fig. 3-1-2a. Phase analysis recorded at the PCH stations. From top to bottom,U-D,E-W,and N-S denote up-down,east-west. and north-south in the three component seismograms,and,R and D denote rectilinearity and directionarity functions. The dotted line represents the arrival time of the each phase.=29,30,1
Fig. 3-1-2b. Phase analysis recorded at BRD stations. From top to bottom,U-D,E-W,and N-S denote up-down,east-west,and north-south in the three component seismograms,and,R and D denote rectilinearity and directionarity functions. The dotted line represents the arrival time of the each phase=29,30,1
Fig. 3-1-3. Travel time of the Cheolwon earthquake. The open circle,open recTangle,and open Triangle represenT Pg,Pn,and PmP phases. The solid circle and solid triangle represent Sg and SmS phases.=33,34,1
Fig. 3-1-4. An example of transformation process of raw record into synthetic Wood-Anderson seismogram. A) Original velocity seismogram recorded on JC-V100 seismograph at PCH station,B) seismogram removed instrument response of JC-V100 seismograph,C) Displacement seismo-gram,D)Synthethic Wood-Anderson seismogram convolved with instrument response of Wood-Anderson seismograph.=37,38,1
Fig. 3-1-5. Fault plane solution for the December 10,2002 Cheolwon earthquake. The characters P and T represent the orientation of compressional and dilatational stress axis.=38,39,1
Fig. 3-2-1. 격자 시험 방법에 의한 발진기구 계산 순서도=44,45,1
Fig. 3-2-2. 2001년에 발생한 21개 지진의 발진기구 계산 결과. ● 기호는 진앙위치를 나타낸다. 발진기구해에서 작은 ●와 ○는 각각 응력축과 인장축 방향을 지시한다.=47,48,1
Fig. 3-2-3. 2002년에 발생한 23개 지진의 발진기구 계산 결과. ● 기호는 진앙위치를 나타낸다. 발진기구해에서 작은 ●와 ○는 각각 응력축과 인장축 방향을 지시한다.=48,49,1
Fig. 3-2-4. 분석된 발진기구 단층면 해 분포를 나타내는 양방향 장미 분포도.=51,52,1
Fig. 3-2-5. 분석된 발진기구 응력축 방향 분포를 나타내는 양방향 장미 분포도=51,52,1
Fig. 3-3-1. An illustration of input data to be extended to 1he case of mi.xed data containing extremes and complete part of catalogues(after Kijko and Sollevoll,1992).=56,57,1
Fig. 3-3-2. Return period as a function of the magnitude.=59,60,1
Fig. 3-4-1. Spatial distribution of the earthquakes used in this study.=63,64,1
Fig. 3-4-2. (a) The relationship between seismic moment and stress drop estimated in this study. (b) Plot of local magnitude versus stress drop estimated in this study.=66,67,1
Fig. 3-4-3. The synthetic retationship between source parameters estimated in this study. Constant stress drop lines come from a theoretical relation discussed in this study.=67,68,1
Fig. 3-5-1. Focal mechanism solutions of the Kyokryolbiyol-do 1998 earthquake for different crust models.=76,77,1
Fig. 3-6-1. 지진대에서 기록된 bandpass-filtered 진동기록과 direct S-waves의 시간창에 대한 예제.=81,82,1
Fig. 3-6-2. DKJ 관측점에서의 P파 Coda 규격화값 (+) 과 그 최소자승값 (아래직선),S파 Coda 규격화값 (○) 과 그 최소자승값 (위 직선).=82,83,1
Fig. 3-6-3. QP-1(이미지참조)(오른쪽) 와 QS-1(이미지참조)(왼쪽) 값.=83,84,1
Fig. 3-6-4. MKL 관측점에서의 P파 Coda 규격화값 (+) 과 그 최소자승값 (아래직선),S파 Coda 규격화값 (○) 과 그 최소자승값 (위 직선).=85,86,1
Fig. 3-6-5. KMH 관측점의 5초 시간창에서 구한 P파의 신호,Coda 및 잡음 스펙트롬.=86,87,1
Fig. 3-6-6. RSTM에 쓰인 관측점 (■),진앙 (○) 및 양산단층계 (선). 동해의 회색(수심이 1000m 이상인 곳),좌상의 삽입도 (RSTM의 관측점짝).=88,89,1
Fig. 3-6-7. Table 3-6-1의 36짝의 (이미지참조)(f) 값=90,91,1
Fig. 3-6-8. Fig. 3-6-7의 평균 (이미지참조)(f)값 (직선:가중치를 고려한 최소자승값).=91,92,1
Fig. 3-6-9. 중부지방에 대한 RSTM의 관측점 (△),16 지진의 진앙(○),관측점을 잇는 직선 (RSTM의 짝).=92,93,1
Fig. 3-6-10. Table 3-6-6. 18짝에서 도출된 (이미지참조)(f)값과 최소자승값.=94,95,1
Fig. 3-6-11. 중부지방 Coda 규격화법 연구에 쓰인 관측점.=97,98,1
Fig. 3-6-12. fc=3 ㎐ 의 Coda 포락선.=98,99,1
Fig. 3-6-13. 각 관측점 TJN (▲),KMC (●),SNU (△),및 YGB (○)에서의 주파수별 Coda 규격화된 Lg 값. 직선은 4관측점 모두를 이용한 최소자승값.=98,99,1
Fig. 3-6-14. Fig. 3-6-3의 결과와 세계각지에서의 연구결과 비교. A;프랑스 Arette (Modiano와 Hatzfeld,1982),D;캘리포니아의 우물값 (Abercrombie,1995),J;일본 간토지방 (Yoshimoto 등,1993),O;북미대륙 순상지 (Taylor 등,1986),F;프랑스 (Campillo와 Plantet,1991),N;일본 나가노(Yoshimoto 등,1998),B;Baltic 순상지(Kvamme와 Havskov,1989),C 및 E;남캘리포니아와 뉴욕주 지방(Frankel 등,1990).Ks,Kd,K1,및K2는 남쿠릴제도의 깊이 5-55㎞,55-85㎞,5-25㎞,및 25-55㎞의 측정값(Fedotov와 Boldyrev. 1969)=101,102,1
Fig. 3-6-15. QP-1(이미지참조)/QS-1(이미지참조) 비교 (Sato와 Fehler,1998).;김 등(1999;2000)의 위,아래 직선은 각각 하부 및 상부지각 값. S;산안드레아스 단층 (Bakun 등,1976),K;남쿠릴제도 (Fedotov와 Boldyrev,1969). J;일본 간토지방 (Yoshimoto 등,1993),O;북미대륙 순상지(Taylor 등,1986),B;발틱순상지(Kvamme와 Havskov,1989),N;일본 나가노(Yoshimoto 등,1998)=101,102,1
Fig. 3-6-16. 본 연구결과와 타지역 QLg-1(이미지참조)값 비교. ○표의 C 및 N 은 각각 California와 뉴욕주 지방 (Frankel 등,1990). 주파수 의존형의 값은 지진 활동정도에 따라 지진활성지역 (1-5 의 굵은선),중간지역 (6-10 의 가는선),비활성지역 (11-15의 쇄선) 의 3지역으로 나뉜다=104,105,1
Fig. 3-6-17. Q-1(이미지참조)값 비교. C;Canada 순상지 (Chun 등,1987). ○표의 S,N 및 쇄선의 S,N은 각각 Lg 및 S파의 남California,뉴욕주값 (Frankel 등,1990). B;발틱순상지 S값 (Kvamme와 Havskov,1989). 기타 값은 Sato와 Fehler (1998)의 S값 편집.=105,106,1
Fig. 3-6-18. 모호의 깊이 (Choi,1987).=106,107,1
Fig. 3-6-19. QLg-1(이미지참조)의 비교. ○표의 S,N은 각각 남California,뉴욕주값 (Prankel et at.,1990). respectively. 주파수 의존형의 값은 지진활동정도에 따라 지진활성지역 (굵은선),중간지역 (가는선),비활성지역 (쇄선)의 3지역으로 나뉜다. M;멕시코 섭입지대값(Dominguez et al.,1997),A;미국 Adirondack 산맥(Shi et al.,1996)=108,109,1
Fig. 3-7-1. 국내 지진관측소 분포도.=122,123,1
Fig. 3-7-2. 연구지역에서 발생한 지진의 진앙분포 및 종,횡 단면상의 진원 깊이 투영도(depth:㎞).=123,124,1
Fig. 3-7-3. 선행 연구자들의 속도구조모델(가는실선)들과 그로부터 선정된 초기 모델(굵은 점선).=125,126,1
Fig. 3-7-4. Fig. 3-7-3의 초기모델을 기준으로 ±0.5㎞/sec 범위내에서 random number 생성에위해 산출된 30개의 서로 다른 초기모델.=126,127,1
Fig. 3-7-5. 다양한 초기모델로부터 계산된 30개의 1차원속도구조.=127,128,1
Fig. 3-7-6. 역산결과 산출된 속도구조를 초기모델로 사용하여 계산된 진앙위치 분포도 및 종,횡단면 진원위치 투영도 (depth:㎞).=128,129,1
Fig. 3-8-1. Classification of coda envelopes from the difference in Qc-1(이미지참조) and amplitudes before and after the ScS arrival. If the offset value is more than 4㏈,we classified the envelope as O;in the case the fractional difference in QC-1(이미지참조)<30%,we classify it as S,otherwise B.=132,133,1
Fig. 3-8-2. The collected RMS envelope traces of regional earthquakes for selected periods and focal depths,where the epicentral distances are less than 2,200㎞ from each station. (a) and (b) show shallow (shallower than 50㎞) and deep focus earthquakes(deeper than 150㎞),respectively. Each solid curve corresponds to the time window for estimating QC-1(이미지참조). Numerals over each solid curve and the rightmost numbers of panels represent QC-1 values and the number of events used for the estimation,respectively.=133,134,1
jpg
Fig. 3-2-4. 분석된 발진기구 단층면 해 분포를 나타내는 양방향 장미 분포도.=51,52,1
Fig. 3-2-5. 분석된 발진기구 응력축 방향 분포를 나타내는 양방향 장미 분포도=51,52,1
Fig. 3-7-1. 국내 지진관측소 분포도.=122,123,1
Fig. 3-7-2. 연구지역에서 발생한 지진의 진앙분포 및 종,횡 단면상의 진원 깊이 투영도(depth:㎞).=123,124,1
Fig. 3-7-3. 선행 연구자들의 속도구조모델(가는실선)들과 그로부터 선정된 초기 모델(굵은 점선).=125,126,1
Fig. 3-7-6. 역산결과 산출된 속도구조를 초기모델로 사용하여 계산된 진앙위치 분포도 및 종,횡단면 진원위치 투영도 (depth:㎞).=128,129,1
*표시는 필수 입력사항입니다.
| 전화번호 |
|---|
| 기사명 | 저자명 | 페이지 | 원문 | 기사목차 |
|---|
| 번호 | 발행일자 | 권호명 | 제본정보 | 자료실 | 원문 | 신청 페이지 |
|---|
도서위치안내: / 서가번호:

우편복사 목록담기를 완료하였습니다.
*표시는 필수 입력사항입니다.
저장 되었습니다.
