
 대표어
대표어




권호기사보기
| 기사명 | 저자명 | 페이지 | 원문 | 기사목차 |
|---|
결과 내 검색
동의어 포함
목차
[표제지 등]=0,1,2
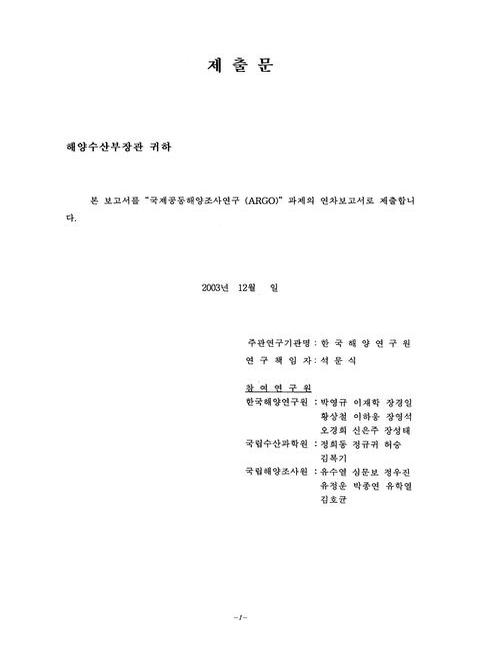
제출문=1,3,2
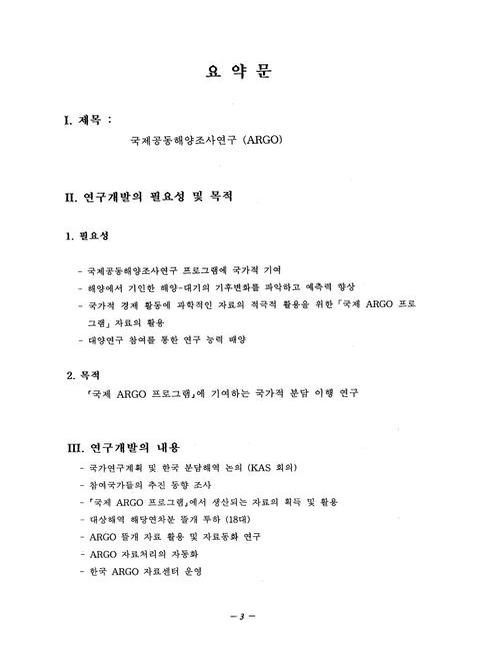
요약문=3,5,8
목차=11,13,4
그림목차=15,17,4
표목차=19,21,4
제1장 서론=23,25,1
제1절 연구 목적=23,25,2
제2절 연구 개요=25,27,1
1. 연구 목표 및 내용=25,27,1
2. 추진전략 및 방법=26,28,1
제2장 국내외 기술개발 현황=27,29,1
제1절 ARGO 뜰개 기술 분석=27,29,1
1. Float의 결함=27,29,2
제2절 한국 Argo 소위원회 활동=29,31,1
1. 당해연도 활동=29,31,1
제3절 국제 동향=30,32,3
제3장 연구개발 수행 내용 및 결과=33,35,2
제1절 동해 (울릉분지)=35,37,1
1. 투하=35,37,1
2. 동해의 중층순환=36,38,5
제2절 남극해=41,43,1
1. Drake Passage=41,43,5
2. 호주 남단 해역=46,48,2
3. 남극해의 특성=47,49,3
제3절 뜰개 자료 처리=50,52,1
1. 자료의 수신 및 처리와 배포=50,52,3
제4절 국제 ARGO 프로그램의 자료수집=53,55,3
제5절 Argo뜰 개 관측자료의 비교검증을 위한 해양조사=56,58,1
1. CTD 장착센서의 검교정=56,58,2
2. 현장관측자료의 후처리 과정=57,59,1
3. Argo 뜰개 자동관측자료와 CTD 현장관측자료의 비교검증=58,60,1
4. 현장조사=59,61,2
5. Argo 뜰개 자동관측자료와 CTD 현장관측자료의 비교검증 결과=60,62,6
제6절 한국 Argo 정보센터의 기반구축=66,68,2
1. 국제 Argo 자료관리 그룹과의 협력 수행=67,69,13
2. 실시간 Argo 자료센터와의 연계 시스템 구축=79,81,3
3. 해외어장 수온정보 제공 기반 구축=81,83,4
제4장 연구개발 목표 달성표 및 대외 기여도=85,87,2
제5장 연구개발 결과의 활용 계획=87,89,1
제1절 기대효과 및 활용 범위=87,89,2
제6장 참고 문헌=89,91,4
부록=93,95,2
뜰개궤적 T-S Diagram 수온ㆍ염분의 수직분포=95,97,128
학술대회 발표논문=223,225,14
뜰개자료처리 프로그램=237,239,8
CSIRO 보도자료=245,247,6
한국해양연구원과 CSIRO간의 양해각서=251,253,6
그림2-1. 2003년 현재 전세계 대양에 투하된 ARGO Floats 분포도=30,32,1
그림3-1. 2003년 한국해양연구원에서 동해에 투하한 뜰개=35,37,1
그림3-2. 한국해양연구원에서 동해에 투하한 APEX 뜰개와 PALACE, Prover의 궤적=36,38,1
그림3-3. 각 뜰개의 궤적자료를 이용하여 계산된 유속과 유향=38,40,1
그림3-4. 각 격자내의 자료수, 빨간색 막대그래프는 각 격자내의 자료가 3개 이상인 것을 뜻함=38,40,1
그림3-5. 각 격자내의 속도장=39,41,1
그림3-6. 계류된 해류계로부터 계산된 평균심층류=40,42,1
그림3-7. Drake Passage에 투하된 뜰개 위치=41,43,1
그림3-8. 제조사측에서 제공한 상자를 이용한 Prover의 투하 방법=42,44,1
그림3-9. Prover 나무상자의 위험, I=43,45,1
그림3-10. Prover 나무상자의 위험, II=43,45,1
그림3-11. Prover 안테나의 상처=44,46,1
그림3-12. 고무를 이용하여 상처를 메움=44,46,1
그림3-13. 고무를 이용하여 상처를 메운 후의 상태=44,46,1
그림3-14. 자기융착 테잎으로 감싸 흠집부위 고정=45,47,1
그림3-15. 절연테잎으로 흠집 부위 고정=45,47,1
그림3-16. 열 수축 관으로 처리부위를 밀봉=45,47,1
그림3-17. 수리 완료=45,47,1
그림3-18. 호주 남단에 투하된 뜰개 위치=46,48,1
그림3-19. 미국 쇄빙선의 Polar Star의 항해계획=47,49,1
그림3-20. 남극해에 투하된 뜰개의 궤적=48,50,1
그림3-21. 뜰개 27478의 수온, 염분 프로파일=49,51,1
그림3-22. 뜰개 27479의 수온, 염분 프로파일=49,51,1
그림3-23. 전세계에서 집적된 뜰개 자료의 흐름=50,52,1
그림3-24. Email과 FTP로 수신된 뜰개자료의 처리과정=51,53,1
그림3-25. Prover 자료처리 프로그램=52,54,1
그림3-26. Coriolis 홈페이지=53,55,1
그림3-27. US-GODAE 홈페이지=53,55,1
그림3-28. Coriolis의 Argo 자료 서비스 사이트=54,56,1
그림3-29. USGODAE의 브라우저를 이용한 Argo 자료획득 사이트=54,56,1
그림3-30. DACs 홈페이지:US AOML, Canadian MEDS, Japanese JMA, EU Coriolis=55,57,1
그림3-31. 2003년 5월 30일 기준으로 30일 이전까지 ARGO 뜰개의 분포도 - CTD 검교정 관측번호: 04252(027), 04664(027), 04666(027), 04684(027), 24682(042), 24682(042)=59,61,1
그림3-32. CTD와 Argo (04252번기 27번째) 관측자료의 전층 및 저층 프로파일 비교그래프=60,62,1
그림3-33. CTD와 Argo (04664번기 27번째) 관측자료의 전층 및 저층 프로파일 비교그래프=61,63,1
그림3-34. CTD와 Argo (04666번기 27번째) 관측자료의 전층 및 저층 프로파일 비교그래프=62,64,1
그림3-35. CTD와 Argo (04684번기 27번째) 관측자료의 전층 및 저층 프로파일 비교그래프=63,65,1
그림3-36. AIC 홈페이지(http://argo.jcommops.org/)에서 제공하고 있는 월별 Argo 분포도=72,74,1
그림3-37. AIC 홈페이지의 미구축 상태=76,78,1
그림3-38. 국제 Argo 자료관리 체계=80,82,1
그림3-39. 실시간 Argo 자료를 FTP를 통해 수신=81,83,1
그림3-40. 어장의 수온정보를 실시간으로 제공하기 위한 시스템 구축=82,84,1
그림3-41. 대상해역의 수평분포도=83,85,1
그림3-42. 대상해역의 수직분포도=83,85,1
영문목차
[title page etc.]=0,1,8
Summary=7,9,6
Contents=13,15,4
List Of Figures=17,19,4
List Of Tables=21,23,2
Chapter I. Introduction=23,25,1
Section 1. Objectives Of Study=23,25,2
Section 2. Overview Of Study=25,27,1
1. Objectives And Outline Of Study=25,27,1
2. Method=26,28,1
Chapter II. Status Of Domestic And Oversea Technological Developments=27,29,1
Section 1. Technical Analysis Of ARGO Float=27,29,1
1. Defect Of Float=27,29,2
Section 2. Korea Argo Committee=29,31,1
1. Activities (2003)=29,31,1
Section 3. Activities Of Overseas Countries=30,32,3
Chapter III. Contents And Results Of The Study=33,35,2
Section 1. East Sea (Ulleung Basin)=35,37,1
1. Deployment=35,37,1
2. Intermediate Level Circulation In The East Sea=36,38,5
Section 2. Southern Oceans=41,43,1
1. Drake Passage=41,43,5
2. Southern Ocean In Australia=46,48,1
3. Characteristic Of The Southern Ocean=47,49,3
Section 3. Data Processing=50,52,1
1. Data Receive, Management And Delivery=50,52,3
Section 4. Data Collection Of International ARGO Program=53,55,3
Section 5. Oceanographic Research For Comparative Qualification On The Automatically Acquired Data Using Argo Float (NORI)=56,58,1
1. Verification Of CTD System=56,58,2
2. Data Processing Of CTD Data=57,59,1
3. Comparative Verification=58,60,1
4. Field Observation Using CTD System=59,61,2
5. Result Of Comparative Verification Of Argo Float Data And CTD Data=60,62,6
Section 6. Construction Of A Base Of Korea ARGO Information Center (NFRDI)=66,68,2
1. Collaboration With The International ARGO Data Management Group=67,69,13
2. Development A Data Management System Connected To The Real Time ARGO Data Center=79,81,3
3. Development Of A System Providing Sea Water Temperature Of Fishing Grounds=81,83,4
Chapter IV. Achievement And External Contribution Of The Study=85,87,2
Chapter V. Application Plan Of The Results=87,89,1
1. Expectation And Application=87,89,2
Chapter VI. References=89,91,4
Appendix=93,95,2
Trajectories, T-S Diagram And T And S Profiles=95,97,128
Paper For A Science Meeting=223,225,14
Float Data Processing Programs=237,239,8
Reports Data Of CSIRO=245,247,6
MOU Between KORDI And CSIRO=251,253,6
Fig.2-1. ARGO Float Deployment Site By The End Of 2003=30,32,1
Fig.3-1. 2003 ARGO Floats Deployment Sites In The East Sea=35,37,1
Fig.3-2. Trajectories Of All APEX, Provors And PALACE Floats Deployed In The East Sea By KORDI=36,38,1
Fig.3-3. A Spaghetti Diagram Using All The Trajectory Data=38,40,1
Fig.3-4. Number Of Data Point In Each Bin. A Bin With More Than 3 Data Points Are Made With A Red Stick=38,40,1
Fig.3-5. Velocity Vector In Each Bin=39,41,1
Fig.3-6. Mean Deep Current From Current Meter Mooring(Teague Et Al. 2003)=40,42,1
Fig.3-7. Deployment Sites In The Drake Passage=41,43,1
Fig.3-8. Deployment Prover Using The Crate Supplied By The Manufacturer=42,44,1
Fig.3-9. Damage In Prover Crate, I=43,45,1
Fig.3-10. Damage In Prover Crate, II=43,45,1
Fig.3-11. Scratch On The Antenna Of Prover=44,46,1
Fig.3-12. Fill The Scratch With Rubber=44,46,1
Fig.3-13. After Filling The Scratch With Rubber=44,46,1
Fig.3-14. Cover The Area With Self Adhesive Tape=45,47,1
Fig.3-15. Cover The Area With A Tape=45,47,1
Fig.3-16. Cover The Area With A Heat Shrinking Tube=45,47,1
Fig.3-17. Finish=45,47,1
Fig.3-18. Deployment Sites In The Southern Oceans=46,48,1
Fig.3-19. Cruise Plan Of The Polar Star, An Ice Breaker Operated By The US Coast Guard=47,49,1
Fig.3-20. Trajectories Of The Floats Deployed In The Southern Ocean=48,50,1
Fig.3-21. (A) Temperature And (B) Salinity Profiles Measured By Float 27478=49,51,1
Fig.3-22. (A) Temperature And (B) Salinity Profiles Measured By Float 27479=49,51,1
Fig.3-23. Data Flow From Float To Global Archives=50,52,1
Fig.3-24. Data Processing Received Float Data From Email Or FTP=51,53,1
Fig.3-25. Data Processing Program For Prover=52,54,1
Fig.3-26. Coriolis Homepage=53,55,1
Fig.3-27. US-GODAE Homepage=53,55,1
Fig.3-28. Coriolis Argo Data Service=54,56,1
Fig.3-29. USGODAE Argo Data Browser=54,56,1
Fig.3-30. Dacs Sites:US AOML, Canadian MEDS, Japanese JMA, EU Coriolis=55,57,1
Fig.3-31. Distribution Map Of The Argo Floats For 30 Days Before May 30 2003 - CTD Was Casted At The Argo Floats:04252(027), 04664(027), 04666(027), 04684(027), 24682(042), 24682(042)=59,61,1
Fig.3-32. Comparison Of The Whole Profiles And The Utmost Layer Acquired By CTD And Argo Float (04252, 27th Profile)=60,62,1
Fig.3-33. Comparison Of The Whole Profiles And The Utmost Layer Acquired By CTD And Argo Float (04664, 27th Profile)=61,63,1
Fig.3-34. Comparison Of The Whole Profiles And The Utmost Layer Acquired By CTD And Argo Float (04666, 27th Profile)=62,64,1
Fig.3-35. Comparison Of The Whole Profiles And The Utmost Layer Acquired By CTD And Argo Float (04684, 27th Profile)=63,65,1
Fig.3-36. Argo Network(Nov. 2003)=72,74,1
Fig.3-37. The Information Of Korea Real Time At AIC Website=76,78,1
Fig.3-38. A Visual Summary Of The Data Flow From Float To Global Archives=80,82,1
Fig.3-39. Receiving Argo RT Data Data Using FTP=81,83,1
Fig.3-40. Real Time Fisheries Resources Information On The Distant-Water=82,84,1
Fig.3-41. Horizontal Distribution=83,85,1
Fig.3-42. Vertical Distribution=83,85,1
jpg
Fig.2-1. ARGO Float Deployment Site By The End Of 2003=30,32,1
Fig.3-3. A Spaghetti Diagram Using All The Trajectory Data=38,40,1
Fig.3-4. Number Of Data Point In Each Bin. A Bin With More Than 3 Data Points Are Made With A Red Stick=38,40,1
Fig.3-19. Cruise Plan Of The Polar Star, An Ice Breaker Operated By The US Coast Guard=47,49,1
Fig.3-21. (A) Temperature And (B) Salinity Profiles Measured By Float 27478=49,51,1
Fig.3-22. (A) Temperature And (B) Salinity Profiles Measured By Float 27479=49,51,1
Fig.3-41. Horizontal Distribution=83,85,1
Fig.3-42. Vertical Distribution=83,85,1
Intermediate Depth Circulation In The Southwestern Part Of The East Sea From ARGO Floats=225,227,1
Argo Float 에 의한 동해 남서부 해역의 난수성 와류의 특성=229,229,1
Intermediate Level Circulation In The Southwestern Part Of The Japan/East Sea=232,234,1
Introduction=232,234,1
Goal=232,234,1
Method=233,235,1
Errors=233,235,1
Chang Et Al 2002=233,235,1
| 등록번호 | 청구기호 | 권별정보 | 자료실 | 이용여부 |
|---|---|---|---|---|
| 0001078787 | 551.46 ㅎ174ㄱ | v.2 | 서울관 서고(열람신청 후 1층 대출대) | 이용가능 |
*표시는 필수 입력사항입니다.
| 전화번호 |
|---|
| 기사명 | 저자명 | 페이지 | 원문 | 기사목차 |
|---|
| 번호 | 발행일자 | 권호명 | 제본정보 | 자료실 | 원문 | 신청 페이지 |
|---|
도서위치안내: / 서가번호:

우편복사 목록담기를 완료하였습니다.
*표시는 필수 입력사항입니다.
저장 되었습니다.
