

 대표어



권호기사보기
| 기사명 | 저자명 | 페이지 | 원문 | 기사목차 |
|---|
결과 내 검색
동의어 포함
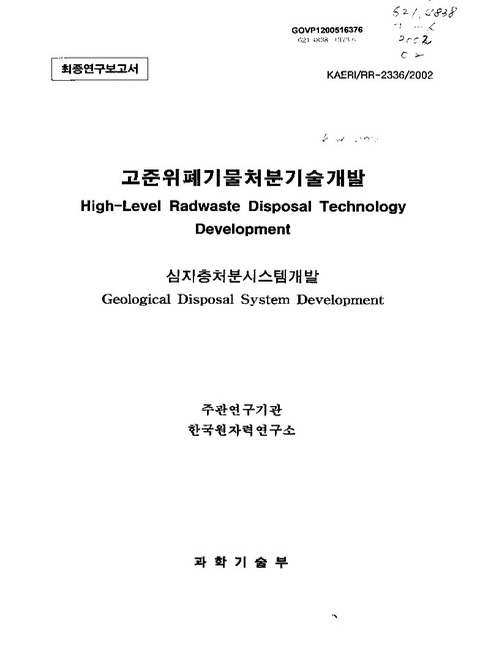
[표제지 등]
제출문
요약문
목차
제1장 서론 73
제2장 처분시스템 개발 77
제1절 서론 77
제2절 고준위방사성폐기물의 특성 80
1. 배경 80
2. 고준위폐기물의 붕규산유리고화체 특성분석 81
3. 붕규산유리고화체의 장기침출거동 99
4. 사용후핵연료의 침출거동 105
5. 산화수별 플루토늄의 분리 116
6. 결론 122
제3절 고준위폐기물 처분용기 124
1. 개요 124
2. 열응력해석 125
3. Rock Movement에 대한 벤토나이트 완충재의 비선형 구조해석 151
4. 처분용기 핵임계 및 방사선차폐 해석 165
5. 처분용기의 후보재질별 예상 부식두께 194
6. 용기제작에 대한 기술성 분석 251
7. 결론 278
제4절 완충재의 공학적 특성 및 화학적 저지능 분석 279
1. 배경 279
2. 완충재료의 공학적 평가 자료 수집 및 생산 279
3. 완충재의 화학적 저지특성 분석 311
제5절 Near Field 해석 361
1. 서론 361
2. 처분 개념 및 처분장 모델 362
3. 처분장 터널 구조 안정성에 대한 민감도 분석 363
4. 처분공 내 처분용기 위치 결정 388
5. 3DEC 을 이용한 처분터널 및 처분공의 역학적 안정성 평가 408
6. 열-역학적 해석을 통한 Near-Field 민감도 분석 422
7. 처분 시스템 최적화 기법 고찰 447
8. 결론 451
서지정보 양식 965
제6절 열-수-역학적 거동 해석 456
1. 서론 456
2. 열·역학적 평가를 통한 처분용기 거치 및 지하 처분장 배열 방안 분석 458
3. 처분용기의 역학적 안전성 확보를 위한 완충재 두께 결정 479
4. 기준처분 시스템을 위한 공학적 종합 평가 493
5. 불연속 화강 암반 내에 위치한 방사성폐기물 처분장 및 인접지역에서의 열수리역학적 연성거동 연구 522
6. 결론 582
참고 문헌 588
부록 2.1. 처분시점을 달리하였을 경우의 방사능과 붕괴열량 변화 618
부록 2.2. 사용 후 핵연료 용액으로부터 Sr과 I의 정량 622
제3장 종합 성능 평가 625
제1절 배경 625
제2절 FEP/시나리오 연구 626
1. 서론 626
2. FEP 선정 평가 627
3. 시나리오 개발 693
4. 결론 713
제3절 MASCOT-K 신뢰성 증진 연구 714
1. 서론 714
2. 평가 대상 시나리오 717
3. K-시나리오 개념 모델 721
4. K-시나리오 평가 결과 분석 734
5. Q-시나리오 개념 모델 739
6. 결론 743
제4절 상세 모델링 개발: 유사 콜로이드와 확산 제한치 영향 규명 744
1. 서론 744
2. 지하 균열암반에서 콜로이드를 동반한 방사성 핵종 이동 방정식 745
3. 지하 균열암반에서 콜로이드를 동반한 방사성 핵종 이동 결과 752
4. 결론 760
제5절 생태계 영향 평가 761
1. 서론 761
2. 생태계 핵종 이동 모델링 현황 764
3. 생태계 영향 평가 803
4. 결론 811
제6절 전문가판단을 통한 입력 데이터 확보 813
1. 서론 813
2. 전문가판단 절차 813
3. 입력 파라미터의 확률분포함수 816
4. 전문가판단에 의한 핵종 용해도한계 도출 817
5. 전문가판단결과와 지화학 코드 및 열역학적 DB를 이용한 핵종 용해도한계 계산결과의 비교, 평가 827
6. 결론 835
제7절 종합 성능 평가 836
1. 서론 836
2. 고준위 폐기물 처분장에 대한 확률론적 성능평가의 한 방법론 837
3. 고준위 처분 시스템 입력 변수의 민감도 계산 및 확률론적 계산 방법론 856
4. 결론 895
참고문헌 897
부록 3.1. 생태계 내 핵종 이동 모델링 수식 907
부록 3.2. 피폭 평가 모델링 수식 912
제4장 품질 보증 체계 개발 918
제1절 서론 918
제2절 품질 보증 체계 개발 연혁 921
제3절 방사성 폐기물 처분 연구 품질 보증 체계 개발 925
1. 방사성 폐기물 처분 연구자료의 품질 보증 개념 925
2. 품질 보증 절차서 934
제4절 웹 기반 품질 보증 체계 개발 935
1. 배경 935
2. 워크 플로우 체계 개념 935
3. 워크 플로우 시스템을 적용한 품질 보증 시스템 940
4. 웹 기반 워크 플로우 품질 보증 절차서 개발 944
참고 문헌 958
제5장 결론 959
서지정보양식
그림 2.2.1. 붕규산유리 고화체 용기의 개략도 (단위 : mm) 85
그림 2.2.2. 시간에 따른 방사능의 변화량; (a) 연소도 45,000 MWD/MTU, (b) 연소도 55,000 MWD/MTU) 87
그림 2.2.3. 시간에 따른 붕괴열의 변화량; (a) 연소도 45,000 MWD/MTU, (b) 연소도 55,000 MWD/MTU) 88
그림 2.2.4. 침출기간에 따른 침출액의 pH 변화 100
그림 2.2.5. 침출기간에 따라 분쇄된 고화체 시편들로부터 유출된 (a) 붕소의 침출률과 (b) 붕소의 누적침출함량 101
그림 2.2.6. 침출시간에 따라 고화체로부터 유출된 붕소, 몰리브덴과 세슘의 침출률 비교 101
그림 2.2.7. 5년 침출 후 벤토나이트의 A-glass 시편의 XRD 스펙트럼 103
그림 2.2.8. 침출후 시편의 XRD 스펙트럼 104
그림 2.2.9. 고화체들의 누적무게 감소의 비교 104
그림 2.2.10. K-glass의 원판형 시편으로부터 유출된 붕소량과 무게 감소량의 비교 105
그림 2.2.11. 침출전과 555일 침출후 사용후핵연료의 표면변화 107
그림 2.2.12. 침출기간에 따라 사용후핵연료로부터 누출된 세슘의 침출률과 침출된 총량 110
그림 2.2.13. 침출기간에 따라 사용후핵연료로부터 누출된 gross-α 핵종의 방사능과 누적총량 111
그림 2.2.14. 사용후핵연료로부터 용출되어 벤토나이트 블록내로 확산된 세슘과 gross-α 핵종의 방사능 분포 112
그림 2.2.15. PWR 사용후핵연료로부터 증류수로 누출된 세슘과 스트론튬의 재고량 115
그림 2.2.16. 사용후핵연료 분말로부터 0.1M HCl 용약으로 누출된 세슘의 분율 115
그림 2.2.17. PuO₂²+와 PuO₂+를 제조하기 위한 전기셀 모형도(이미지참조) 119
그림 2.2.18. 플로토늄 분리를 위한 two-column 방법의 흐름도 120
그림 2.2.19. IC/ICP-MS 방법으로 얻어진 Eu³+, Th⁴+ NpO₂+, UO₂²+의 chromatogram 121
그림 2.3.1. The canister geometry (unit: cm) 126
그림 2.3.2. The structural analysis process of the canister 127
그림 2.3.3. Constraint conditions for boundary and external force 129
그림 2.3.4. Solid model of the canister for PWR fuel 130
그림 2.3.5. Finite element mesh of the canister for PWR fuel 132
그림 2.3.6. Boundary and load conditions for case 1 133
그림 2.3.7. Boundary and load conditions for case 2 133
그림 2.3.8. Boundary and load conditions for Heat source 1 134
그림 2.3.9. Decay heat of spent PWR and CANDU fuels and the approximation formula for decay heat estimation 135
그림 2.3.10. The maximum von Mises stress in the cast iron insert versus the canister diameter (PWR type canister, filled basket, Case 2 load condition) 138
그림 2.3.11. The maximum von Mises stress in the cast iron insert versus temperature (PWR type canister, empty basket, D=122 cm) 141
그림 2.3.12. The maximum deflection in the cast iron insert versus temperature (PWR type canister, empty basket, D=122 cm) 141
그림 2.3.13. Temperature distribution inside canister (PWR canister, filled basket, Tcenter = 167℃, T。=93℃, D=122cm)(이미지참조) 142
그림 2.3.14. Temperature distribution inside canister (PWR canister, empty basket, D=122cm ; Ti =93.3℃ T。=93℃)(이미지참조) 143
그림 2.3.15. Temperature distribution inside canister (PWR canister, filled basket, D=122cm,heat generation rate: 5,062.9[Watt/㎥], T。=93℃)(이미지참조) 144
그림 2.3.16. Stress contour of canister structure (overall) (PWR canister, filled basket, constant temperature, Case 1, D=122cm) 145
그림 2.3.17. Stress contour of canister structure (inside) (PWR canister, filled basket, constant temperature, Case 1, D=122cm) 146
그림 2.3.18. Deformed shape of canister (PWR canister, filled basket, constant temperature, Case 1, D=122cm) 147
그림 2.3.19. Stress contour, deformed shape of canister structure (overall) (PWR canister, empty basket, no thermal load, Case 1, D=122cm) 148
그림 2.3.20. Stress contour of canister structure(inside) (PWR canister empty basket, no thermal load, Case 1, D=122cm) 149
그림 2.3.21. Stress contour, deformed shape of canister structure (overall) (PWR canister, filled basket, no thermal load, Case 2) 150
그림 2.3.22. The canister and buffer geometry 152
그림 2.3.23. Constraint conditions for boundary and external force 154
그림 2.3.24. Solid model of buffer and canister(PWR type) 154
그림 2.3.25. FE model of canister and buffer structure 155
그림 2.3.26. Rock movement and boundary condition 156
그림 2.3.27. Symmetric condition 156
그림 2.3.28. Deformation shape of whole structure 158
그림 2.3.29. Resultant displacement of buffer and canister 159
그림 2.3.30. Resultant displacement of canister 159
그림 2.3.31. Contour of von-Mises stress (whole part) 159
그림 2.3.32. Contour of von-Mises stress (bentonite) 160
그림 2.3.33. Contour of von-Mises stress (copper) 160
그림 2.3.34. Contour of von-Mises stress (steel) 160
그림 2.3.35. Contour of von-Mises stress (section view) 161
그림 2.3.36. Contour of max. shear stress (whole part) 161
그림 2.3.37. Contour of equivalent plastic strain (whole part) 161
그림 2.3.38. Selected node location 162
그림 2.3.39. Graph of von-Mises stress at selected node 162
그림 2.3.40. Graph of max. shear stress at selected node 163
그림 2.3.41. Graph of equivalent plastic strain at selected node 163
그림 2.3.42. Effective yield stress at bentonite buffer node(5796, 5813, 5814) 164
그림 2.3.43. Effective yield stress at bentonite buffer node(6043, 7573) 164
그림 2.3.44. CSAS6 모듈의 구성 167
그림 2.3.45. SAS2H 모듈의 구성 168
그림 2.3.46. MCNP/ORIGEN 계산 절차 169
그림 2.3.47. PWR 사용후핵연료 저장체의 구조 175
그림 2.3.48. CANDU 사용후핵연료 저장체의 구조 176
그림 2.3.49. PWR 핵연료의 정상상태에서 연소도에 따른 핵임계도 계산결과 176
그림 2.3.50. PWR 핵연료의 정상상태에서 냉각기간에 따른 핵임계도 계산결과 177
그림 2.3.51. CANDU 사용후핵연료의 정상상태와 가상사고조건 I에서 연소도에 따른 핵임계도 계산결과 177
그림 2.3.52. PWR 핵연료에서 최대감속조건을 갖는 수분농도 178
그림 2.3.53. CANDU 핵연료에서 최대감속조건을 갖는 수분농도 179
그림 2.3.54. 가상사고조건 I에서 연소도에 따른 핵임계도 계산결과 179
그림 2.3.55. 가상사고조건 I에서 냉각시간에 따른 핵임계도 계산결과 180
그림 2.3.56. 가상사고조건 II에서의 핵임계도 계산결과 182
그림 2.3.58. Bentonite SAMPLE-A에서 함수율에 따른 최적 감속조건 184
그림 2.3.59. Bentonite SAMPLE-B에서 함수율에 따른 최적 감속조건 185
그림 2.3.60. Bentonite SAMPLE-C에서 함수율에 따른 최적 감속조건 185
그림 2.3.61. Bentonite SAMPLE-D에서 함수율에 따른 최적 감속조건 186
그림 2.3.62. Bentonite 종류별 함수율에 따른 최적 감속조건 비교 186
그림 2.3.63. Reflector 두께에 따른 k-inf 188
그림 2.3.64. 연소도에 따른 사고조건 III에서의 k-eff 189
그림 2.3.65. 저장체 외부에서 냉각시간에 따른 총 방사선량률 190
그림 2.3.66. 저장체 표면에서 냉각시간에 따른 감마의 방사선량률 190
그림 2.3.67. 사용후저장용기의 MCNP 모델링 191
그림 2.3.68. 저장용기 외부에서의 DOSE 결과 192
그림 2.3.69. 두 계산모듈에서의 DOSE 계산결과 비교 192
그림 2.3.70. 처분공의 각 지점에서의 시간에 따른 온도분포 197
그림 2.3.71. 그림 2.3.70의 최고온도에 도달한 시점에서 처분공의 깊이방향에 따른 온도분포 198
그림 2.3.72. 시간에 따른 처분공내 산소량 및 온도의 변화 200
그림 2.3.73. SRB와 35SO4--를 구리판에서 증식시킨 후 S-35에 의한 방사선의 분포도 203
그림 2.3.74. 15개월 동안 서로 다른 온도에 노출된 3가지 포자형성 박테리아의 생존분포 205
그림 2.3.75. Cu/S/C/H₂O(이미지참조)계에서 Eh-pH 그래프 211
그림 2.3.76. 산소를 포함한 염소용약에서 압축 완충재와 접한 구리용기의 부식 메커니즘 214
그림 2.3.77. 25C, pH=8의 일반 지하수에서 구리의 산화환원 그래프 215
그림 2.3.78. 압축 완충재에서 부식된 구리조각으로부터 측정된 구리의 농도 216
그림 2.3.79. 초기 pH의 함수로서 염소용액에 녹은 구리의 계산된 평형값 216
그림 2.3.80. 시간에 따른 구리 부식률의 추정값 223
그림 2.3.81. 물의 pH와 산소의 농도에 따른 탄소강의 부식률 변화 224
그림 2.3.82. 처분공내 완충재의 두께 241
그림 2.3.83. 직접 및 간접 압출공정 253
그림 2.3.84. Workpiece and tooling configurations for radial forging 253
그림 2.3.85. Radial forging of tube over a mandrel 253
그림 2.3.86. 구리튜브의 압출성형공정 중 forging and punching 개략도 262
그림 2.3.87. 구리튜브의 piercing and drawing 공정개략도 262
그림 2.3.88. Spray deposition of tubular products 263
그림 2.3.89. 개략적인 처분용기의 두 가지 제작공정도 270
그림 2.3.90. 처분용기의 개략도 271
그림 2.3.91. 티탄합금 처분용기의 개략도 272
그림 2.3.92. 처분용기의 개략적인 제작공정도 277
그림 2.4.1. 건조밀도에 따른 압축벤토나이트의 열전도도도 변화 299
그림 2.4.2. 모래 함량에 따른 벤토나이트-모래 혼합물의 열전도도 변화(Kyungju 벤토나이트 및 MX-80 벤토나이트) 299
그림 2.4.3. 건조밀도에 따른 압축벤토나이트의 비열의 변화 300
그림 2.4.4. 건조밀도에 따른 압축벤토나이트의 일축압축강도 변화 300
그림 2.4.5. 모래함량 변화에 따른 벤토나이트의 일축압축강도 변화(건조밀도: 1.8Mg/㎥ 함수비 : 14wt.%) 301
그림 2.4.6. 건조밀도에 따른 압축벤토나이트의 탄성계수 변화 301
그림 2.4.7. 모래함량 변화에 따른 벤토나이트의 탄성계수 변화(건조밀도: 1.8Mg/㎥ 함수비 : 14wt.%) 302
그림 2.4.8. 건조밀도에 따른 압축벤토나이트의 Poisson 비 변화 302
그림 2.4.9. 압축벤토나이트의 건조밀도와 수리전도도 사이의 관계 303
그림 2.4.10. 건조밀도 1.6Mg/㎥인 벤토나이트-모래 혼합물에서 모래 함량에 따른 수리전도도 변화 303
그림 2.4.11. 건조밀도 1.8Mg/㎥인 벤토나이트-모래 혼합물에서 모래 함량에 따른 수리전도도 변화 304
그림 2.4.12. 건조밀도 1.4Mg/㎥인 경주 벤토나이트의 수리전도도에 미치는 온도의 영향 304
그림 2.4.13. 건조밀도 1.6Mg/㎥인 경주 벤토나이트의 수리전도도에 미치는 온도의 영향 305
그림 2.4.14. 건조밀도 1.8Mg/㎥인 경주 벤토나이트의 수리전도도에 미치는 온도의 영향 305
그림 2.4.15. 건조밀도 1.0Mg/㎥인 압축벤토나이트에서 투과액의 염도(salinity)변화에 따른 수리전도도 변화 306
그림 2.4.16. 건조밀도 1.4Mg/㎥인 압축벤토나이트에서 투과액의 염도(salinity)변화에 따른 수리전도도 변화 306
그림 2.4.17. 건조밀도 1.8Mg/㎥인 압축벤토나이트에서 투과액의 염도(salinity)변화에 따른 수리전도도 변화 307
그림 2.4.18. 고준위폐기물처분장의 완충재를 통한 방사성핵종의 유출 개념 307
그림 2.4.19. 고준위폐기물처분장 폐쇄 후 100년 경과 시 완충재의 반경 방향 두께에 따른 방사성핵종 총 유출률 308
그림 2.4.20. 고준위폐기물처분장 폐쇄 후 500년 경과 시 완충재의 반경 방향 두께에 따른 방사성핵종 총 유출률 309
그림 2.4.21. 고준위폐기물처분장 폐쇄 후 1000년 경과 시 완충재의 반경 방향 두께에 따른 방사성핵종 총 유출률 310
그림 2.4.22. 경주벤토나이트의 X-ray diffraction pattern 315
그림 2.4.23. 내부확산법에 사용된 실험장치 317
그림 2.4.24. 내부확산법에서의 핵종 확산 개념도 318
그림 2.4.25. 압축 벤토나이트플러그에서의 수분함량 분포(건조밀도=1400kg/㎥, ωs(이미지참조)= 포화상태에서의 수분함량) 319
그림 2.4.26. 압축벤토나이트 내 Tc의 농도분포 320
그림 2.4.27. 용액-대-고체 비가 pH에 미치는 영향 323
그림 2.4.28. 용액-대-고체 비가 Eh에 미치는 영향 324
그림 2.4.29. 용약-대-고체 비에 따른 Ni의 평형분배계수 변화 324
그림 2.4.30. 용약-대-고체 비에 따른 Tc의 평형분배계수 변화 325
그림 2.4.31. 용약-대-고체 비에 따른 U의 평형분배계수 변화 325
그림 2.4.32. 용약-대-고체 비에 따른 Am의 평형분배계수 변화 326
그림 2.4.33. 벤토나이트에서의 스트론튬의 겉보기확산계수 분포 357
그림 2.4.34. 벤토나이트에서의 요오드의 겉보기확산계수 분포 358
그림 2.4.35. 벤토나이트에서의 우라늄의 겉보기확산계수 분포 359
그림 2.5.1. 민감도 분석에 사용된 처분장의 개략도 364
그림 2.5.2. 모델의 메쉬 및 경계조건과 중요 측정점 364
그림 2.5.3. 변위 등고선 (표준 경우: t40b6e60) 367
그림 2.5.4. 최대 주응력 등고선 (표준 경우: t40b6e60) 367
그림 2.5.5. von-Mises 등고선 (표준 경우: t40b6e60) 368
그림 2.5.6. 탄성계수에 다른 변위의 변화 369
그림 2.5.7. 현지 응력비에 따른 von-Mises stress의 변화 371
그림 2.5.8. 현지 응력비에 따른 변위의 변화 371
그림 2.5.9. 불연속면 간격에 따른 변위의 변화 373
그림 2.5.10. 처분장 심도에 따른 von-Mises stress 의 변화 375
그림 2.5.11. 처분장 심도에 따른 변위의 변화 375
그림 2.5.12. 변위에 대한 파라미터의 주영향(세 측정위치) 377
그림 2.5.13. 변위에 대한 파라미터의 교호작용에 의한 영향 378
그림 2.5.14. 응력에 대한 파라미터의 주영향 379
그림 2.5.15. 응력에 대한 파라미터의 교호작용에 의한 영향 380
그림 2.5.16. 소성영역의 발달에 따른 4개 경우의 파괴 형태 381
그림 2.5.17. 소성영역의 발달에 대한 파라미터의 주영향 382
그림 2.5.18. 소성영역의 발달에 대한 파라미터 교호작용에 의한 영향 382
그림 2.5.19. 변위에 대한 설계 파라미터의 주영향 384
그림 2.5.20. 변위에 대한 설계인자와 응력비 및 심도의 교호작용에 의한 영향 384
그림 2.5.21. 응력에 대한 설계 파라미터의 주영향 385
그림 2.5.22. 응력에 대한 설계 파라미터와 현지응력비 및 심도의 교호작용에 의한 영향 386
그림 2.5.23. Recommended ground support for different tunnels for different rock mass quality 391
그림 2.5.24. Flow chart of the Thermal-Mechanical coupling 399
그림 2.5.25. FLAC3D 해석을 위한 처분공 부근의 모델 메쉬와 측정점 400
그림 2.5.26. 각 경우에 대한 모델 메쉬 402
그림 2.5.27. 처분용기 중심에서의 시간에 따른 온도 변화 403
그림 2.5.28. 처분공 설계변화에 따른 소성영역의 발생 (100년 후) 404
그림 2.5.29. 팽윤압이 처분용기 거치 200년 후 응력변화에 미치는 영향 405
그림 2.5.30. 뒷채움 시전이용기 온도에 미치는 영향 406
그림 2.5.31. 불연속 암반에 대한 3DEC모델링 예 409
그림 2.5.32. Hoek-Brown 파괴조건식을 이용한 암반의 안전계수 분표 410
그림 2.5.33. 처분터널의 크기 변화에 따른 변위변화 411
그림 2.5.34. 절리면의 수에 따른 변위변화 412
그림 2.5.35. 절리면 경사에 따른 변위변화 413
그림 2.5.36. 불연속면의 물성이 변위에 미치는 영향 414
그림 2.5.37. 암반의 물성에 따른 처분터널 주변에서의 역학적 안전계수 415
그림 2.5.38. 응력비에 따른 변위변화 416
그림 2.5.39. Fracture zone 의 위치 417
그림 2.5.40. Fracture zone 위치가 최대 변위에 미치는 영향 418
그림 2.5.41. Cases with different dip of the fracture zone 419
그림 2.5.42. Displacement plots for the case 419
그림 2.5.43. Influence of dip angle of fracture zone on maximum displacement 420
그림 2.5.44. Influence of dip angle of fracture zone on maximum stress 420
그림 2.5.45. Fracture zone 의 두께 변화에 따른 영향 421
그림 2.5.46. 처분후 200년이 경과한 시점에서의 처분용기에서의 주응력 분포 424
그림 2.5.47. 유성과 고성 부지의 물성을 이용한 경우의 변위분포 426
그림 2.5.48. 외곽셀에서의 변위 427
그림 2.5.49. 처분 후 200년이 경과한 시점에서의 소성영역 발생 분포 427
그림 2.5.50. Von-Mises stress change inside of rock wall at different cases, 50years after emplacement 429
그림 2.5.51. Box-plot of the temperature change 434
그림 2.5.52. Main effect of the parameters on temperature at Point 3 438
그림 2.5.53. Influence of the parameters on temperatures at the points, 50years after emplacement 439
그림 2.5.54. Interaction effect between the parameter A and the other parameters on temperature at the points, 50 years after emplacement 440
그림 2.5.55. Burn up 이 완충재의 온도분포에 미치는 영향 445
그림 2.5.56. 처분심도에 따른 온도 변화 446
그림 2.5.57. 냉각기간이 온도에 미치는 영향 447
그림 2.5.58. Visual Doc을 이용한 처분 굴착량 최적화 450
그림 2.6.1. 처분용기 개념도 459
그림 2.6.2. 수직 처분공형 처분장 모델 461
그림 2.6.3. Submodel을 이용한 열 해석 수행도 462
그림 2.6.4. 사용후핵연료 집합체 수치해석 구조 모델 465
그림 2.6.5. 처분장 모델에서 열원의 열전도도에 따른 처분용기 중심온도 변화 467
그림 2.6.6. 처분장 모델에서 열원의 열전도도에 따른 완충재 온도 변화 468
그림 2.6.7. x방향에 대한 온도 변화(완충재가 최고온도 일 때) 468
그림 2.6.8. 수치해석 구조 모델의 변화에 따른 온도 분포 변화 470
그림 2.6.9. 유효 열전도도 변화에 따른 핵연료 집합체의 온도 분포 472
그림 2.6.10. 처분장 인접지역 각 위치에서의 시간에 따른 온도 변화 473
그림 2.6.11. 처분용기내부 집합체를 수평방향으로 자른 경우의 온도 Contour 474
그림 2.6.12. 처분용기내부 집합체를 수직방향으로 자른 경우의 온도 Contour 475
그림 2.6.13. 완충재 두께 변화에 따른 완충재 표면 온도의 변화 478
그림 2.6.14. 완충재 두께 변화에 따른 집합체 중심온도의 변화 478
그림 2.6.15. 처분용기에 대한 con-mises 응력분포 483
그림 2.6.16. 완충재에서의 소성 변형 484
그림 2.6.17. 각 구성요소의 1차 주응력 변화 485
그림 2.6.18. x 방향 거리에 따른 1차 주응력 변화 486
그림 2.6.19. 전단 응력의 작용 488
그림 2.6.20. 0.025m 변위 일 때의 완충재 변형 490
그림 2.6.21. 외력에 의한 완충재의 소성 흐름 형성 491
그림 2.6.22. 처분용기의 misses 응력 분포 491
그림 2.6.23. 완충재 두께변화에 따라 처분용기가 받는 mises stress 492
그림 2.6.24. Drain인 경우와 undrain인 경우의 pore pressure 변화 500
그림 2.6.25. Drain인 경우와 undrain인 경우의 principal stress 변화 501
그림 2.6.26. TOUGH2와 JAS3D의 coupled code 개념도 504
그림 2.6.27. 벤토나이트에 대한 T-H 계산 입력, 유동모델 및 출력 505
그림 2.6.28. 벤토나이트에 대한 T-M 계산 입력, 유동모델 및 출력 506
그림 2.6.29. FEBEX 현장 실험 개략도 510
그림 2.6.30. 실험용 히터의 크기와 구조 510
그림 2.6.31. 기하학적 모델 및 유한요소 격자 512
그림 2.6.32. 시간 경과에 따른 완충재의 온도 변화 515
그림 2.6.33. 처분터널 각 부위에서의 시간에 대한 온도 변화(ci: 처분용기, bi:벤토나이트, ro:암반벽) 518
그림 2.6.34. 시간에 따른 pore pressure의 변화(undrain 및 drain 조건) 520
그림 2.6.35. 시간에 따른 1차 주응력의 변화(undrain 및 drain 조건) 521
그림 2.6.36. A cavern and a deposition hole with a canister 523
그림 2.6.37. A model for a repository 524
그림 2.6.38. Enlarged view of a repository model showing a tunnel and a deposition hole with a canister 525
그림 2.6.39a. Enlarged view of a repository models with 33˚dip fault 530
그림 2.6.39b. Enlarged view of a repository models with 45˚dip fault 530
그림 2.6.39c. Enlarged view of a repository models with 58˚dip fault 531
그림 2.6.40. The (a)vertical and (b)horizontal stress distributions on the 200m model at an initial stage 533
그림 2.6.41. The(a)temperature, (b)displacement, (c)normal stress, and (d)shear stress histories on the points in the vicinity of a cavern during the period of 500 years from waste emplacement 536
그림 2.6.42. The(a)temperature distribution on a 200m repository model and (b)its enlarged view after 500 years from waste emplacement 538
그림 2.6.43. A 200m model for a repository with joints 541
그림 2.6.44. Enlarged view of the model a for a repository 541
그림 2.6.45. Enlarged view of the model b for a repository 542
그림 2.6.46. Enlarged view of the model c for a repository 542
그림 2.6.47. Enlarged view of the model d for a repository 543
그림 2.6.48. Enlarged view of the model e for a repository 543
그림 2.6.49. Distribution of a vertical component of an insitu stress on a 500m depth repository model 544
그림 2.6.50. Distribution of a horizontal component of an insitu stress on a 500m depth repository model 544
그림 2.6.51. Enlarged view of the displacement distribution on a repository model after an instantaneous tunnel excavation 550
그림 2.6.52. Enlarged view of the principal stress distribution on a repository model after an instantaneous tunnel excavation 551
그림 2.6.53. Displacement distribution on a repository model after placing canisters and buffer filling 553
그림 2.6.54. Principal stress distribution on a repository model after placing canisters and buffer filling 554
그림 2.6.55. Displacement distribution on a repository model after 500 years from waste emplacement 555
그림 2.6.56. Principal stress distribution on a repository model after 500 years from waste emplacement 555
그림 2.6.57. Enlarged view of the temperature distribution around a repository after 500 years from waste emplacement 556
그림 2.6.58. Temperature history at various locations on the tunnel of a repository for the period of 500 years from waste emplacement 557
그림 2.6.59. Temperature history at various locations along the horizontal line connecting the canister center on a repository model for the period of 500 years from waste emplacement 557
그림 2.6.60. A vertical displacement history at a cavern crown during the period of 500 years from waste emplacement 558
그림 2.6.61. Vertical displacement histories at various locations around a cavern during the period of 500 years from waste emplacement 559
그림 2.6.62. A vertical displacement history at a cavern roof-wall intersection during the period of 500 years from waste emplacement 559
그림 2.6.63. A horizontal displacement history at a cavern roof-wall intersection during the period of 500 years from waste emplacement 560
그림 2.6.64. A shear stress history at a point of the coordinate of (4m,114.5m) during the period of 500 years from waste emplacement 560
그림 2.6.65. A normal stress history at a point of the coordinate of (4m,114.5m) during the period of 500 years from waste emplacement 561
그림 2.6.66. Hydraulic aperture variations along the line of 56˚dip joint passing through a tunnel roof-wall intersection after 500 years from waste emplacement 561
그림 2.6.67. Flow rate variations along the line of 56˚dip joint passing through a tunnel roof-wall intersection after 500 years from waste emplacement 562
그림 2.6.68. Hydraulic aperture variation along the line of a 56˚dip joint passing through a tunnel roof-wall intersection after an instantaneous excavation 566
그림 2.6.69. Normal displacement distribution along the of a 56˚dip joint passing through a tunnel roof-wall intersection after an instantaneous excavation 566
그림 2.6.70. Shear displacement distribution along the line of a 56˚dip joint passing through a tunnel roof-wall intersection after an instantaneous excavation 567
그림 2.6.71. Normal stress distribution along the line of a 56˚dip joint passing through a tunnel roof-wall intersection after an instantaneous excavation 567
그림 2.6.72. Hydraulic aperture variation along the line of a 56˚dip joint passing through a tunnel roof-wall intersection after placing canisters and buffer filling 568
그림 2.6.73. Normal displacement distribution along the line of a 56 dip joint passing through a tunnel roof-wall intersection after placing canisters and buffer filling 568
그림 2.6.74. Shear displacement distribution along the line of a 56˚dip joint passing through a tunnel roof-wall intersection after placing canisters and buffer filling 569
그림 2.6.75. Normal stress distribution along the line of a 56˚dip joint passing through a tunnel roof-wall intersection after placing canisters and buffer filling 569
그림 2.6.76. Hydraulic aperture variation along the line of a 56˚dip joint passing through a tunnel roof-wall intersection after 500 years from waste emplacement 570
그림 2.6.77. Normal displacement distribution along the line of a 56˚dip joint passing through a tunnel roof-wall intersection after 500 years from waste emplacement 570
그림 2.6.78. Shear displacement distribution along the line of a 56˚dip joint passing through a tunnel roof-wall intersection after 500 years from waste emplacement 571
그림 2.6.79. Normal stress distribution along the line of a 56˚dip joint passing through a tunnel roof-wall intersection after 500 years from waste emplacement 571
그림 2.6.80. Flow rate variations along the line of a 56˚dip joint passing through a tunnel roof-wall intersection after 500 years from waste emplacement 572
그림 2.6.81. Mean fluid velocity variations along the line of a 56˚dip joint passing through a tunnel roof-wall intersection after 500 years from waste emplacement 572
그림 2.6.82. Hydraulic aperture variation along the line of a 34˚dip joint passing through a tunnel crown after an instantaneous excavation 573
그림 2.6.83. Normal displacement distribution along the line of a 34˚dip joint passing through a tunnel crown after an instantaneous excavation 573
그림 2.6.84. Shear displacement distribution along the line of a 34˚dip joint passing through a tunnel crown after an instantaneous excavation 574
그림 2.6.85. Normal stress distribution along the line of a 34˚dip joint passing through a tunnel crown after an instantaneous excavation 574
그림 2.6.86. Hydraulic aperture variation along the line of a 34˚dip joint passing through a tunnel crown after placing canisters and buffer filling 575
그림 2.6.87. Normal displacement distribution along the line of a 34˚dip joint passing through a tunnel crown after placing canisters and buffer filling 575
그림 2.6.88. Shear displacement distribution along the line of a 34˚dip joint passing through a tunnel crown after placing canisters and buffer filling 576
그림 2.6.89. Normal stress distribution along the line of a 34˚dip joint passing through a tunnel crown after placing canisters and buffer filling 576
그림 2.6.90. Hydraulic aperture variation along the line of a 34˚dip joint passing through a tunnel crown after 500 years from waste emplacement 577
그림 2.6.91. Normal displacement distribution along the line of a 34˚dip joint passing through a tunnel crown after 500 years from waste emplacement 577
그림 2.6.92. Shear displacement distribution along the line of a 34˚dip joint passing through a tunnel crown after 500 years from waste emplacement 578
그림 2.6.93. Normal stress distribution along the line of a 34˚dip joint passing through a tunnel crown after 500 years from waste emplacement 578
그림 2.6.94. Flow rate variations along the line of a 34˚dip joint passing through a tunnel crown after 500 years from waste emplacement 579
그림 2.6.95. Mean fluid velocity variations along the line of a 34˚dip joint passing through a tunnel crown after 500 years from waste emplacement 579
그림 3.2.1. 상호 반응 행렬을 이용한 단위 시나리오 개발 631
그림 3.2.2. FEP 선별을 위한 4가지 주요 기준 639
그림 3.2.3. 발생 확률과 영향을 이용 FEP을 선별하기 위한 개념도 640
그림 3.2.4. 지하수 유동 부 시나리오 694
그림 3.2.5. 처분 용기 부식 부 시나리오 695
그림 3.2.6. 역학적 변화 현상 부 시나리오 696
그림 3.2.7. RED 행렬 요소간의 상호 반응을 통해 도출한 기준 시나리오 697
그림 3.2.8. 초기 파손 용기 시나리오 RES 698
그림 3.2.9. 기후변화 시나리오 RES 699
그림 3.2.10. 자연재해 시나리오 RES 700
그림 3.2.11. 스웨덴 성능평가 코드체계 706
그림 3.2.12. KAERI 성능평가 코드체계 706
그림 3.2.13. 스웨덴 핵종 이동 평가에서의 모델과 입력 데이터 707
그림 3.2.14. FEAS FEP/시나리오 시스템 711
그림 3.2.15. FEAS 내 FEP 상세 설명 화면 712
그림 3.3.1. 해석해에 기초한 독립적인 코드와의 비교 평가를 통한 MASCOT-K 갭 모듈 건전성 검증 결과 716
그림 3.3.2. 해석해에 기초한 독립적인 코드와의 비교 평가를 통한 MASCOT-K 조화 유출 모듈 건전성 검증 결과 716
그림 3.3.3. 갭 핵종들의 사용후 핵연료 내 분포도 718
그림 3.3.4. AMBER 구획 모델로 도시된 Q-시나리오 상의 방사성 핵종 이동경로 721
그림 3.3.5. K-시나리오 평가를 위한 MASCOT-K 서브 모듈 구성도 722
그림 3.3.6. 갭 유출 현상 개념도 722
그림 3.3.7. 차원 조화 유출 모델 개념도 725
그림 3.3.8. MASCOT-K를 사용한 K- 시나리오에 대한 연간 개인 선량 732
그림 3.3.9. AMBER를 사용한 K- 시나리오에 대한 연간 개인 선량 733
그림 3.3.10. STMAN/PICNIC를 사용한 K- 시나리오에 대한 연간 개인 선량 733
그림 3.3.11. 갭 유출 결과 (확산성 : 혼합 셀, I-129) 735
그림 3.3.12. 갭 유출 결과 (확산성 : 혼합 셀, Tc-99) 735
그림 3.3.13. 연료 유출 현상 모델 차이로 인한 두 코드간 유출률 변화 736
그림 3.3.14. 갭 부피의 영향 737
그림 3.3.15. STMAN/PICNIC로부터의 선량 결과 (Pe=10) 738
그림 3.3.16. MASCOT-K를 이용한 Q-시나리오 평가 결과 742
그림 3.3.17. AMBER를 이용한 Q-시나리오 평가 결과 742
그림 3.3.18. STMAN/PICNIC를 이용한 Q-시나리오 평가 결과 742
그림 3.4.1. Colloid-facilitated radionuclide transport system in a fractured porous medium 745
그림 3.4.2. Validation result of semi-analytical solution of Eq, (4-24) (n=2, Knc = 0.0, t = 10,000 yr)(이미지참조) 753
그림 3.4.3. Validation result of semi-analytical solution of Eq, (4-24) (n=3, Knc = 0.0, t = 20,000 yr)(이미지참조) 753
그림 3.4.4. Effect of pseudo-colloid formation constant(Knc) in decay chain of Am241→Np237 (t=10,000yr)(이미지참조) 754
그림 3.4.5. Effect of pseudo-colloid formation constant(Knc) in decay chain of U234→Th230→Ra226 (t=20,000yr)(이미지참조) 754
그림 3.4.6. Effect of filtration coefficient in decay chain of Am241→Np237 (Knc =100.0, t=10,000yr)(이미지참조) 755
그림 3.4.7. Effect of filtration coefficient in decay chain of U234→Th230→Ra226 (Knc =100.0, t=20,000yr)(이미지참조) 756
그림 3.4.8. Effect of limited matrix diffusion into an adjacent rock matrix in decay chain of Am241→Np237(Knc = 0 and 100.0 (㎥/kg), Rp = 105, ∧n,=0.0 (1/m), t =10,000 yr)(이미지참조) 758
그림 3.4.9. Effect of available thickness of a permeable rock matrix in decay chain of Am241→Np237(Knc = 0 and 100.0 (㎥/kg), Rp = 105, ∧n,=0.0 (1/m), t=10,000 yr)(이미지참조) 759
그림 3.5.1. 국내 기준 생태계에 대한 RES 행렬 762
그림 3.5.2. 기준 생태계의 구획별 상호 반응 도시도 763
그림 3.5.3. 기준 생태계 설정 접근 방법 765
그림 3.5.4. 처분장에서 생태계로 이동하는 방사성 핵종 유동 개념도(기준 생태계) 766
그림 3.5.5. 생태계 모델을 위한 상호 반응 행렬 776
그림 3.5.6. 기준 생태계 평가를 위한 핵종 이동 개념 모델 778
그림 3.5.7. 기준 생태계 평가를 위한 피폭 경로 779
그림 3.5.8. 구획간 물질 수지를 이용한 수학 모델링 개념 779
그림 3.5.9. 스웨덴 생태계 평가에서 고려하는 개인에 대한 피폭 경로 784
그림 3.5.10. 오염된 토양과 물로부터 곡물을 통한 피폭 경로 785
그림 3.5.11. 우유와 고기를 통해 인간에게 미치는 피폭 경로 786
그림 3.5.12. 수산물을 통해 일어나는 피폭 경로 787
그림 3.5.13. 관계 모델(Irrigation model)을 위한 구획 788
그림 3.5.14. 강 모델을 위한 구획 설명 791
그림 3.5.15. 해양 모델을 위한 구획 설명 795
그림 3.5.16. 농경지 모델을 위한 구획 설명 797
그림 3.5.17. 늪지 모델에 대한 구획 설명 800
그림 3.5.18. 기준 생태계 평가를 위한 구획 개념 807
그림 3.5.19. AMBER 모델 내 구획 개념도 808
그림 3.5.20. 기존 생태계의 노출 경로(Exposure Pathway) 808
그림 3.5.21. 토양층 내에 축적된 핵종량 809
그림 3.5.22. 농경집단에 대한 핵종별 연간 피폭량 809
그림 3.5.23. 3개 집단에 대한 연간 피폭 선량 810
그림 3.5.24. 우물물 음용시 연간 피폭선량에 다한 개별 핵종별 공원도 810
그림 3.5.25. 연간 피폭 선량에 대한 각 방사성 붕괴 사슬별 영향 810
그림 3.6.1. MASCOT-K에서 사용되는 확률밀도함수 816
그림 3.6.2. 전문가판단 도출 KAERI양식 821
그림 3.6.3. 테크네튬에 대한 전문가 7인의 판단결과 823
그림 3.6.4. 주요 핵종의 용해도한계에 대한 확률분포 824
그림 3.6.5. 니켈의 누적확률분포 핏팅 결과와 확률밀도함수 824
그림 3.6.6. 테크네튬의 누적확률분포 핏팅 결과와 확률밀도함수 825
그림 3.6.7. 아메리슘의 누적확률분포 핏팅 결과와 확률밀도함수 825
그림 3.6.8. 우라늄의 누적확률분포 핏팅 결과와 확률밀도함수 826
그림 3.6.9. 넵투늄의 누적확률분포 핏팅 결과와 확률밀도함수 826
그림 3.6.10. 플루토늄의 누적확률분포 핏팅 결과와 확률밀도함수 827
그림 3.6.11. 니켈에 대한 전문가판단 결과와 코드 계산결과의 비교 832
그림 3.6.12. 테크네튬에 대한 전문가판단 결과와 코드 계산결과의 비교 832
그림 3.6.13. 아메리슘에 대한 전문가판단 결과와 코드 계산결과의 비교 833
그림 3.6.14. 우라늄에 대한 전문가판단 결과와 코드 계산결과의 비교 833
그림 3.6.15. 넵투늄에 대한 전문가판단 결과와 코드 계산결과의 비교 834
그림 3.6.16. 플루토늄에 대한 전문가판단 결과와 코드 계산결과의 비교 834
그림 3.7.1. 40CFR191 Subpart B에 기술된 EPA규제치 경계선 (점선)과 관련 CCDF 841
그림 3.7.2. 결과ce(이미지참조)를 나타내기 위해 추정된 CCDF 843
그림 3.7.3. PA를 통하여 전파되는 시나리오를 추계적 불확실성과 그 결과에 대한 CCDF 845
그림 3.7.4. 부정확한 입력자료에 대한 분포 함수의 예로서 0.00, 0.05, 0.10, 0.25, 0.50, 0.75, 0.90, 0.95, 그리고 1.00의 quantile을 추정하여 얻은 것 846
그림 3.7.5. 부정확한 입력자료를 샘플링하여 얻은 CCDF의 예 848
그림 3.7.6. 평균값과 percentile을 이용하여 CCDF를 요약한 그림 849
그림 3.7.7. 처분 시스템내 핵종 이동거리 분포 (Triangular distribution)에 따른 최고 총 피폭 선량(Peak total dose)결과의 CCDF 850
그림 3.7.8. 추정된 분포함수의 예 852
그림 3.7.9. 산란 그래프의 한 예 854
그림 3.7.10. 평가 대상 시스템 개념도 859
그림 3.7.11. 처분 터널과 처분공 859
그림 3.7.12. 처분 시스템 개념 860
그림 3.7.13. 사용후 핵연료 캐니스터 860
그림 3.7.14. 캡유출 주요 핵종에 대한 결정론적 계산 결과 867
그림 3.7.15. MASCOT-K계산을 위한 선원항 및 지하매질 모델의 흐름도 868
그림 3.7.16. 갭유출 주요 핵종에 대하여 주요 입력 자료 분포로부터의 표본 추출 개수에 대한 영향을 신뢰도 95%구간 상하한으로 표시한 파과 곡선(a: sampling # = 50, d: sampling # = 1000) 869
그림 3.7.17. 갭유출 주요 핵종에 대하여 주요 입력자료의 분포를 모두 고려한 경우의 확률론적 계산에 따른 CCDF 871
그림 3.7.18. 뒷채움재 두께와 뒷채움재 내 확산계수의 변화에 따른 결과 872
그림 3.7.19. 뒷채움재 내 확산계수의 변화에 따른 결과 873
그림 3.7.20. 뒷채움재 두께와 뒷채움재 내 확산계수의 변화에 따른 결과 874
그림 3.7.21. 갭유출 모델에서 고려되고 있는 제 2매질, 즉 뒷채움재와 인접한 모델상의 제 2매질의 공극률의 변화에 따른 결과 874
그림 3.7.22. 갭유출 모델에서 뒷채움재와 함께 고려되고 있는 제1매질, 즉 인접한 모델상의 암반에 대한 공극률과 함께 인접한 실제 균열 암반 조직 내 공극률의 동반 변화에 따른 결과 876
그림 3.7.23. 뒷채움재 내에서 핵종의 지연계수 변화에 따른 결과 877
그림 3.7.24. 뒷채움재 내에서 핵종의 지연계수 변화와 인접 제2매질의 공극률 변화에 따른 결과 878
그림 3.7.25. 균열암반 매질 내에서 핵종 이동 거리 변화에 따른 결과 878
그림 3.7.26. 균열암반 매질 내에서 지하수 유동 속도 변화에 따른 결과 879
그림 3.7.27. 균열암반 매질 내에서 분산계수 변화에 따른 결과 881
그림 3.7.28. 균열암반 매질 내에서 핵종 이동 거리와 지하수 유동 속도 변화에 따른 결과 882
그림 3.7.29. 균열암반 매질 내에서 핵종 이동거리와 지하수 유동 속도 및 분산 계수 변화에 따른 결과 883
그림 3.7.30. 균열암반 매질 내에서 균열폭 변화에 따른 결과 883
그림 2.7.31. 균열암반 매질 내에서 균열폭과 지하수 유동 속도 변화에 따른 결과 885
그림 3.7.32. 균열암반 매질 내에서 매트릭스 확산 상수 변화에 따른 결과(129I(이미지참조)에 대해서만 고려한 결과임) 886
그림 3.7.33. 다공성암반 매질 내에서 핵종 이동 거리 변화에 따른 결과 886
그림 3.7.34. 다공성암반 매질 내에서 지하수 유동 속도 변화에 따른 결과 887
그림 3.7.35. 다공성암반 매질 내에서 분산 계수 변화에 따른 결과 887
그림 3.7.36. 다공성암반 매질 내에서 핵종 이동 거리와 지하수 유동 속도 변화에 따른 결과 888
그림 3.7.37. 다공성암반 매질 내에서 핵종 이동 거리와 지하수 유동 속도 및 분산 계수 변화에 따른 결과 889
그림 3.7.38. 다공성암반 매질 내에서 공극률 변화에 따른 결과 889
그림 3.7.39. 주요 입력변수의 변화를 모두 고려한 경우에 대한 14C(이미지참조)에 의한 연간 최대 피폭 선량률에 관한 CCDF 890
그림 3.7.40. 주요 입력변수의 변화를 모두 고려한 경우에 대한 135Cs(이미지참조)에 의한 연간 최대 피폭 선량률에 관한 CCDF 891
그림 3.7.41. 주요 입력변수의 변화를 모두 고려한 경우에 대한 129I(이미지참조)에 의한 연간 최대 피폭 선량률에 관한 CCDF 892
그림 3.7.42. 주요 입력변수의 변화를 모두 고려한 경우에 대한 79Se(이미지참조)에 의한 연간 최대 피폭 선량률에 관한 CCDF 893
그림 3.7.43. 주요 입력변수의 변화를 모두 고려한 경우에 대한 99Tc(이미지참조)에 의한 연간 최대 피폭 선량률에 관한 CCDF 894
그림 4.2.1. 고준위 방사성폐기물 처분 연구에서 업무 5 단계 분류도 921
그림 4.2.2/4.4.2. 미국 10CFR50 Appendix B에서 제시한 원자력 924
그림 4.3.1. 10CFR50 부록 B에 제시된 품질 보증 원칙 재검토 925
그림 4.3.2. 처분 연구에 맞게 수정된 품질 보증 원칙 926
그림 4.3.3. 10CFR50 부록 B에 수록된 기관 관련 원칙들의 수정 사항 926
그림 4.3.4. 조직 관련 QAP 개발을 위한 개념도 927
그림 4.3.5. 구매 관련 QAP 개발을 위한 개념도 927
그림 4.3.6. 연구 절차 및 문서 관리 관련 QAP 개발을 위한 개념도 928
그림 4.3.7. 기기 및 샘플 콘트롤 관련 QAP 개발을 위한 개념도 928
그림 4.3.8. 소프트웨어, 과학적 조사, 결과 분석 관련 QAP 개발을 위한 개념도 928
그림 4.3.9. 수정 업무, 기록 보관, 검토 관련 QAP 개발을 위한 개념도 929
그림 4.3.10. 처분 연구 주요 항목인 데이터 수집, 평가, 인허가 업무간의 상관도 929
그림 4.3.11. 데이터 수집 연구에서 요구되는 품질 보증 개념 930
그림 4.3.12. 평가 연구에서 요구되는 품질 보증 개념 930
그림 4.3.13. 인허가 관련 연구에서 요구되는 품질 보증 개념 930
그림 4.3.14. T2R3와 품질 보증 요소들 간의 상호 관계 932
그림 4.3.15. 입력 자료 생산 관련 업무 Flow-chart 933
그림 4.4.1. 워크 플로우 시스템의 진화 단계 936
그림 4.4.2. 워크 플로우 표준 모델 938
그림 4.4.3. 워크 플로우 표준 모델의 인터페이스 4(WfMC, 2001) 939
그림 4.4.4. 웹 기반 품질 보증 업무 절차 개념도 940
그림 4.4.5. 품질 보증 절차서 작성 과정 도식도 942
그림 4.4.6. 웹 기반 품질 보증 시스템 전체 구성도 943
그림 4.4.7a. PDF 형식으로 작성된 QAP 945
그림 4.4.7b. 웹 형식으로 작성된 품질 보증 절차서 946
그림 4.4.8. 품질 보증 시스템 초기 화면 947
그림 4.4.9. 로그인 후 시스템 내부 접속 화면 947
그림 4.4.10. Worklist 및 Message 관련 화면 I 948
그림 4.4.11. Worklist 및 Message 관련 화면 II 949
그림 4.4.12. 새로운 프로젝트 생성화면 및 프로젝트 list 화면 949
그림 4.4.13. 개발된 QAP Form 목록 950
그림 4.4.14. 웹 기반 품질 보증 절차서 양식 (QAP 2-1 Qualification and Training) 951
그림 4.4.15. 웹기반 품질 보증 절차서 양식 951
그림 4.4.16. 외부 검교정 용 Form 중 교정 요청 관련 절차서 (QAP12-1) 952
그림 4.4.17. 업무/QA 내외부 Audit용 절차서 (QAP16-1) 952
그림 4.4.18. 소프트웨어 개발 유지 및 활용 절차서 (QAP19-1) 952
그림 4.4.19. 자산 이동 현황 파악용 절차서 (QAP20-01a) 953
그림 4.4.20. ABAQUS 프로그램 수행 결과물 기록서 화면 953
그림 4.4.21. 폼의 전달 과정 953
그림 4.4.22. Connectflow 실행 기록서 954
그림 4.4.23. MASCOT-K 실행 기록서 954
그림 4.4.24. 3DEC 실행 기록서 954
그림 4.4.25. FLAC3D 실행 기록서 955
그림 4.4.26. UDEC 실행 기록서 955
그림 4.4.27. 사용자 및 승인자 서명 예시도 955
그림 4.4.28. Glossary 및 품질 보증 업무관련 조직도 956
그림 4.4.29. 사용자 등록 957
[title page etc.]
Summary
Contents
Chapter 1. Introduction 73
Chapter 2. Disposal system development 77
Section 1. Introduction 77
Section 2. Characteristics of high-level radioactive wastes 80
Section 3. Disposal container for HLW disposal 124
Section 4. Evaluation of the engineering properties and radionuclide retardation properties of buffer 279
Section 5. Near field analysis 361
Section 6. Coupled thermal-hydrological-mechanical behaviour study of an underground high level nuclear waste repository 456
References 588
Appendix 2.1. Variation of radioactivity and decay heat with different disposal times 618
Appendix 2.2. Measurement of Sr and I from spent fuel 622
Chapter 3. Total system performance assessment 625
Section 1. Background 625
Section 2. FEP and Scenario development 626
Section 3. Study for enhancing confidence in MASCOT-K 714
Section 4. Development of detailed modeling : study effect of pseudo-colloid and diffusion limit 744
Section 5. Biosphere effect assesment 761
Section 6. Data extraction by utilizing expert elicitation methodology 813
Section 7. Total system performance assessment 836
References 897
Appendix 3.1. Mathematic modeling on radionuclide migration in biosphere 907
Appendix 3.2. Mathematic modeling on assesment for rediological exposure 912
Chapter 4. Web-based QA(Quality Assurance) program development 918
Section 1. Background 918
Section 2. Workflow system concept development 921
Section 3. QA system applied by workflow system 925
Section 4. Web-based workflow QA procedure development 935
References 958
Chapter 5. Conclusion 959
| 등록번호 | 청구기호 | 권별정보 | 자료실 | 이용여부 |
|---|---|---|---|---|
| 0001078894 | 621.4838 ㄱ373ㅅ | 2002 | 서울관 서고(열람신청 후 1층 대출대) | 이용중 |
| 0001080903 | 621.4838 ㄱ373ㅅ | 2002 | 서울관 서고(열람신청 후 1층 대출대) | 이용중 |
*표시는 필수 입력사항입니다.
| 전화번호 |
|---|
| 기사명 | 저자명 | 페이지 | 원문 | 기사목차 |
|---|
| 번호 | 발행일자 | 권호명 | 제본정보 | 자료실 | 원문 | 신청 페이지 |
|---|
도서위치안내: / 서가번호:

우편복사 목록담기를 완료하였습니다.
*표시는 필수 입력사항입니다.
저장 되었습니다.
