
 대표어
대표어


권호기사보기
| 기사명 | 저자명 | 페이지 | 원문 | 기사목차 |
|---|
결과 내 검색
동의어 포함
목차
[표제지 등]=0,1,2
제출문=0,3,1
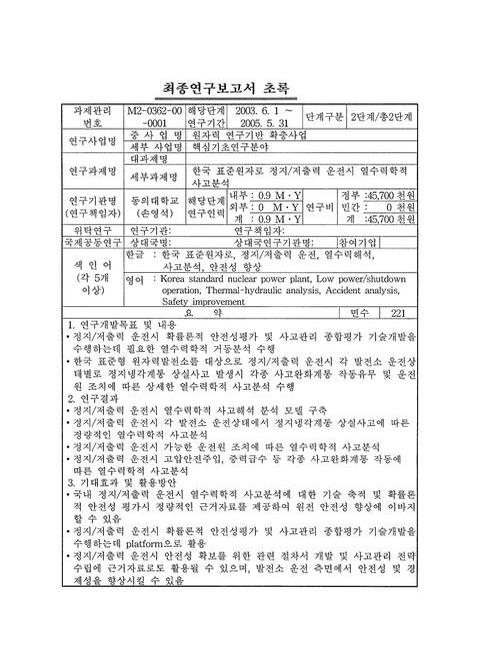
최종연구보고서 초록=0,4,1
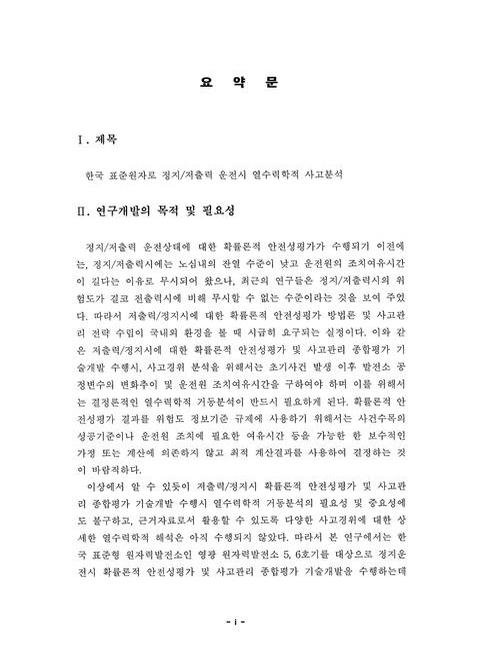
요약문=i,5,4
Summary=v,9,5
Contents=x,14,2
목차=xii,16,2
표목차=xiv,18,2
그림목차=xvi,20,8
제1장 연구개발 과제의 개요=1,28,1
제1절 연구개발의 필요성=1,28,3
제2절 연구개발의 목적 및 범위=3,30,2
제2장 국내ㆍ외 기술개발 현황=5,32,3
제3장 연구개발 수행내용 및 결과=8,35,1
제1절 열수력학적 사고해석 분석모델=8,35,1
1. 발전소 운전상태 분류=8,35,4
2. 해석 코드=12,39,2
3. 모의계산 방법=13,40,1
가. 한국 표준원자로 모델링=13,40,2
나. 정상상태 계산=14,41,2
다. 과도상태 계산=15,42,2
라. 열수력변수 정의=16,43,3
4. 해석코드의 비교 검증=19,46,10
제2절 발전소 운전상태에 따른 열수력학적 사고분석=29,56,1
1. 전기 POS 계산결과=29,56,1
가. POS3 계산결과=29,56,12
나. POS4A 계산결과=41,68,12
다. POS4B 계산결과=53,80,9
라. POS5 계산결과=62,89,11
마. POS6 계산결과=73,100,9
2. 후기 POS 계산결과=82,109,1
가. POS10 계산결과=82,109,9
나. POS11 계산결과=91,118,11
다. POS12A 계산결과=102,129,9
라. POS12B 계산결과=111,138,11
마. POS13 계산결과=122,149,10
제3절 사고완화 조치에 따른 열수력학적 사고분석=132,159,1
1. 운전원 조치에 따른 열수력학적 사고분석=132,159,2
가. POS3 계산결과=133,160,12
나. POS4A 계산결과=145,172,12
2. 고압안전주입 작동에 따른 열수력학적 사고분석=157,184,1
가. POS4B 계산결과=157,184,12
나. POS5 계산결과=169,196,12
3. 중력급수 작동에 따른 열수력학적 사고분석=181,208,1
가. POS4B 계산결과=181,208,13
나. POS5 계산결과=194,221,12
제4절 요약 및 결론=206,233,8
제4장 연구개발 목표 달성도 및 관련 분야에의 기여도=214,241,1
제1절 연구개발 목표 달성도=214,241,2
제2절 관련 분야에의 기여도=216,243,1
제5장 연구개발 결과의 활용계획=217,244,2
제6장 연구개발 과정에서 수집한 해외 과학기술정보=219,246,1
제1절 수집한 해외 과학기술정보=219,246,1
제2절 참고문헌=219,246,3
Fig. 3.1-1. Characteristics Of POS And Duration Time=11,38,1
Fig. 3.1-2. MARS Nodalization For Modeling Of YGN 5, 6=18,45,1
Fig. 3.1-3. Core Top Pressure (POS2-PSV)=21,48,1
Fig. 3.1-4. Collapsed Liquid Level At The Reactor Core (POS2-PSV)=21,48,1
Fig. 3.1-5. Mass Flow Rate Through PSV (POS2-PSV)=22,49,1
Fig. 3.1-6. Void Fraction At The Hot Leg (POS2-PSV)=22,49,1
Fig. 3.1-7. Void Fraction At The Top Of Reactor Core (POS2-PSV)=23,50,1
Fig. 3.1-8. Fuel Cladding Temperature At The Reactor Core Top (POS2-PSV)=23,50,1
Fig. 3.2-1. Core Top And SG A Secondary Pressure (POS3)=34,61,1
Fig. 3.2-2. Core Top Liquid Temperature (POS3)=35,62,1
Fig. 3.2-3. Hot And Cold Leg A Void Fraction (POS3)=35,62,1
Fig. 3.2-4. Void Fraction At The Reactor Core Bottom, Middle, And Top (POS3)=36,63,1
Fig. 3.2-5. Hot And Cold Leg A Mass Flow Rate (POS3)=36,63,1
Fig. 3.2-6. Total Heat Transfer From Fuel, SG A And B U-Tubes (POS3)=37,64,1
Fig. 3.2-7. SG A Collapsed Liauid Level (POS3)=37,64,1
Fig. 3.2-8. Normalized Pressurizer Collapsed Liquid Level (POS3)=38,65,1
Fig. 3.2-9. Reactor Core Collapsed Liquid Level (POS3)=38,65,1
Fig. 3.2-10. Fuel Cladding Temp. At The Reactor Core Bottom, Middle, And Top (POS3)=39,66,1
Fig. 3.2-11. Core Top And SG A Secondary Pressure (POS4A)=46,73,1
Fig. 3.2-12. Core Top Liquid Temperature (POS4A)=47,74,1
Fig. 3.2-13. Hot And Cold Leg A Void Fraction (POS4A)=47,74,1
Fig. 3.2-14. Void Fraction At The Reactor Core Bottom, Middle, And Top (POS4A)=48,75,1
Fig. 3.2-15. Hot And Cold Leg A Mass Flow Rate (POS4A)=48,75,1
Fig. 3.2-16. Mass Flow Rate Through Pressurizer Head Vent (POS4A)=49,76,1
Fig. 3.2-17. Total Heat Transfer From Fuel, SG A And B U-Tubes (POS4A)=49,76,1
Fig. 3.2-18. SG A Collapsed Liquid Level (POS4A)=50,77,1
Fig. 3.2-19. Normalized Pressurizer Collapsed Liquid Level (POS4A)=50,77,1
Fig. 3.2-20. Reactor Core Collapsed Liquid Level (POS4A)=51,78,1
Fig. 3.2-21. Fuel Cladding Temp. At The Reactor Core Bottom, Middle, And Top (POS4A)=51,78,1
Fig. 3.2-22. Core Top And SG A Secondary Pressure (POS4B)=56,83,1
Fig. 3.2-23. Core Top Liquid Temperature (POS4B)=57,84,1
Fig. 3.2-24. Hot And Cold Leg A Void Fraction (POS4B)=57,84,1
Fig. 3.2-25. Void Fraction At The Reactor Core Bottom, Middle, And Top (POS4B)=58,85,1
Fig. 3.2-26. Hot And Cold Leg A Mass Flow Rate (POS4B)=58,85,1
Fig. 3.2-27. Mass Flow Rate Through Pressurizer Manway (POS4B)=59,86,1
Fig. 3.2-28. Normalired Pressurizer Collapsed Liquid Level (POS4B)=59,86,1
Fig. 3.2-29. Reactor Core Collapsed Liquid Level (POS4B)=60,87,1
Fig. 3.2-30. Fuel Cladding Temp. At The Reactor Core Bottom, Middle, And Top (POS4B)=60,87,1
Fig. 3.2-31. Core Top And SG A Secondary Pressure (POS5)=67,94,1
Fig. 3.2-32. Core Top Liquid Temperature (POS5)=67,94,1
Fig. 3.2-33. Hot And Cold Leg A Liquid Temperature (POS5)=68,95,1
Fig. 3.2-34. Hot And Cold Leg A Void Fraction (POS5)=68,95,1
Fig. 3.2-35. Void Fraction At The Reactor Core Bottom, Middle, And Top (POS5)=69,96,1
Fig. 3.2-36. Hot And Cold Leg A Mass Flow Rate (POS5)=69,96,1
Fig. 3.2-37. Mass Flow Rate Through Pressurizer Manway (POS5)=70,97,1
Fig. 3.2-38. Mass Flow Rate Through SG A & B Inlet Plenum Manways (POS5)=70,97,1
Fig. 3.2-39. Reactor Core Collapsed Liquid Level (POS5)=71,98,1
Fig. 3.2-40. Fuel Cladding Temp. At The Reactor Core Bottom, Middle, And Top (POS5)=71,98,1
Fig. 3.2-41. Core Top Pressure (POS6)=76,103,1
Fig. 3.2-42. Core Top Liquid Temperature (POS6)=77,104,1
Fig. 3.2-43. Hot And Cold Leg A Void Fraction (POS6)=77,104,1
Fig. 3.2-44. Void Fraction At The Reactor Core Bottom, Middle, And Top (POS6)=78,105,1
Fig. 3.2-45. Hot And Cold Leg A Mass Flow Rate (POS6)=78,105,1
Fig. 3.2-46. Mass Flow Rate Through Pressurizer Manway (POS6)=79,106,1
Fig. 3.2-47. Mass Flow Rate Through ICI Tube (POS6)=79,106,1
Fig. 3.2-48. Reactor Core Collapsed Liquid Level (POS6)=80,107,1
Fig. 3.2-49. Fuel Cladding Temp. At The Reactor Core Bottom, Middle, And Top (POS6)=80,107,1
Fig. 3.2-50. Core Top Pressure (POS10)=85,112,1
Fig. 3.2-51. Core Top Liquid Temperature (POS10)=85,112,1
Fig. 3.2-52. Hot And Cold Leg A Void Fraction (POS10)=86,113,1
Fig. 3.2-53. Void Fraction At The Reactor Core Bottom, Middle, And Top (POS10)=86,113,1
Fig. 3.2-54. Hot And Cold Leg A Mass Flow Rate (POS10)=87,114,1
Fig. 3.2-55. Mass Flow Rate Through Pressurizer Manway (POS10)=87,114,1
Fig. 3.2-56. Mass Flow Rate Through ICI Tube (POS10)=88,115,1
Fig. 3.2-57. Reactor Core Collapsed Liquid Level (POS10)=88,115,1
Fig. 3.2-58. Fuel Cladding Temp. At The Reactor Core Bottom, Middle, And Top (POS10)=89,116,1
Fig. 3.2-59. Core Top And SG A Secondary Pressure (POS11)=95,122,1
Fig. 3.2-60. Core Top Liquid Temperature (POS11)=96,123,1
Fig. 3.2-61. Hot And Cold Leg A Liquid Temperature (POS11)=96,123,1
Fig. 3.2-62. Hot And Cold Leg A Void Fraction (POS11)=97,124,1
Fig. 3.2-63. Void Fraction At The Reactor Core Bottom, Middle, And Top (POS11)=97,124,1
Fig. 3.2-64. Hot And Cold Leg A Mass Flow Rate (POS11)=98,125,1
Fig. 3.2-65. Mass Flow Rate Through Pressurizer Manway (POS11)=98,125,1
Fig. 3.2-66. Mass Flow Rate Through SG A & B Inlet Plenum Manways (POS11)=99,126,1
Fig. 3.2-67. Reactor Core Collapsed Liquid Level (POS11)=99,126,1
Fig. 3.2-68. Fuel Cladding Temp. At The Reactor Core Bottom, Middle, And Top (POS11)=100,127,1
Fig. 3.2-69. Core Top And SG A Secondary Pressure (POS12A)=105,132,1
Fig. 3.2-70. Core Top Liquid Temperature (POS12A)=106,133,1
Fig. 3.2-71. Hot And Cold Leg A Void Fraction (POS12A)=106,133,1
Fig. 3.2-72. Void Fraction At The Reactor Core Bottom, Middle, And Top (POS12A)=107,134,1
Fig. 3.2-73. Hot And Cold Leg A Mass Flow Rate (POS12A)=107,134,1
Fig. 3.2-74. Mass Flow Rate Through Pressurizer Manway (POS12A)=108,135,1
Fig. 3.2-75. Normalized Pressurizer Collapsed Liquid Level (POS12A)=108,135,1
Fig. 3.2-76. Reactor Core Collapsed Liquid Level (POS12A)=109,136,1
Fig. 3.2-77. Fuel Claddinb Temp. At The Reactor Core Bottom, Middle, And Top (POS12A)=109,136,1
Fig. 3.2-78. Core Top And SG A Secondary Pressure (POS12B)=115,142,1
Fig. 3.2-79. Core Top Liquid Temperature (POS12B)=116,143,1
Fig. 3.2-80. Hot And Cold Leg A Void Fraction (POS12B)=116,143,1
Fig. 3.2-81. Void Fraction At The Reactor Core Bottom, Middle, And Top (POS12B)=117,144,1
Fig. 3.2-82. Hot And Cold Leg A Mass Flow Rate (POS12B)=117,144,1
Flg. 3.2-83. Mass Flow Rate Through Pressurizer Head Vent (POS12B)=118,145,1
Fig. 3.2-84. Total Heat Transfer From Fuel, SG A And B U-Tubes (POS12B)=118,145,1
Fig. 3.2-85. Normalized Pressurizer Collapsed Liquid Level (POS12B)=119,146,1
Fig. 3.2-86. Reactor Core Collapsed Liquid Level (POS12B)=119,146,1
Fig. 3.2-87. Fuel Cladding Temp. At The Reactor Core Bottom, Middle, And Top (POS12B)=120,147,1
Fig. 3.2-88. Core Top And SG A Secondary Pressure (POS13)=126,153,1
Fig. 3.2-89. Core Top Liquid Temperature (POS13)=126,153,1
Fig. 3.2-90. Hot And Cold Leg A Void Fraction (POS13)=127,154,1
Fig. 3.2-91. Void Fraction At The Reactor Core Bottom, Middle, And Top (POS13)=127,154,1
Fig. 3.2-92. Hot And Cold Leg A Mass Flow Rate (POS13)=128,155,1
Fig. 3.2-93. Total Heat Transfer From Fuel, SG A And B U-Tubes (POS13)=128,155,1
Fig. 3.2-94. SG A Collapsed Liquid Level (POS13)=129,156,1
Fig. 3.2-95. Normalized Pressurizer Collapsed Liquid Level (POS13)=129,156,1
Fig. 3.2-96. Reactor Core Collapsed Liquid Level (POS13)=130,157,1
Fig. 3.2-97. Fuel Cladding Temp. At The Reactor Core Bottom, Middle, And Top (POS13)=130,157,1
Fig. 3.3-1. Core Top And SG A Secondary Pressure (POS3-AFW)=137,164,1
Fig. 3.3-2. Core Top Liquid Temperature (POS3-AFW)=138,165,1
Fig. 3.3-3. Hot And Cold Leg A Void Fraction (POS3-AFW)=138,165,1
Fig. 3.3-4. Void Fraction At The Reactor Core Bottom, Middle, And Top (POS3-AFW)=139,166,1
Fig. 3.3-5. Hot And Cold Leg A Mass Flow Rate (POS3-AFW)=139,166,1
Fig. 3.3-6. Mass Flow Rate Through ADV At SG A (POS3-AFW)=140,167,1
Fig. 3.3-7. Auxiliary Feed Water Mass Flow Rate To SG A (POS3-AFW)=140,167,1
Fig. 3.3-8. Total Heat Transfer From Fuel, SG A And B U-Tubes (POS3-AFW)=141,168,1
Fig. 3.3-9. SG A Collapsed Liquid Level (POS3-AFW)=141,168,1
Fig. 3.3-10. Normalized Pressurizer Collapsed Liquid Level (POS3-AFW)=142,169,1
Fig. 3.3-11. Reactor Core Collapsed Liquid Level (POS3-AFW)=142,169,1
Fig. 3.3-12. Fuel Cladding Temp. At The Reactor Core Bottom, Middle, And Top (POS3-AFW)=143,170,1
Fig. 3.3-13. Core Top And SG A Secondary Pressure (POS4A-AFW)=149,176,1
Fig. 3.3-14. Core Top Liquid Temperature (POS4A-AFW)=150,177,1
Fig. 3.3-15. Hot And Cold Leg A Void Fraction (POS4A-AFW)=150,177,1
Fig. 3.3-16. Void Fraction At The Reactor Core Bottom, Middle, And Top (POS4A-AFW)=151,178,1
Fig. 3.3-17. Hot And Cold Leg A Mass Flow Rate (POS4A-AFW)=151,178,1
Fig. 3.3-18. Mass Flow Rate Through ADV At SG A (POS4A-AFW)=152,179,1
Fig. 3.3-19. Auxiliary Feed Water Mass Flow Rate To SG A (POS4A-AFW)=152,179,1
Fig. 3.3-20. Total Heat Transfer From Fuel, SG A And B U-Tubes (POSfa-AFW)=153,180,1
Fig. 3.3-21. SG A Collapsed Liquid Level (POS4A-AFW)=153,180,1
Fig. 3.3-22. Normalized Pressurizer Collapsed Liquid Level (POS4A-AFW)=154,181,1
Fig. 3.3-23. Reactor Core Collapsed Liquid Level (POS4A-AFW)=154,181,1
Fig. 3.3-24. Fuel Cladding Temp. At The Reactor Core Bottom, Middle, And Top (POS4A-AFW)=155,182,1
Fig. 3.3-25. Core Top And SG A Secondary Pressure (POS4B-HPSI)=163,190,1
Fig. 3.3-26. Core Top Liquid Temperature (POS4B-HPSI)=163,190,1
Fig. 3.3-27. Hot And Cold Leg A Void Fraction (POS4B-HPSI)=164,191,1
Fig. 3.3-28. Void Fraction At The Reactor Core Bottom, Middle, And Top (POS4B-HPSI)=164,191,1
Fig. 3.3-29. Hot And Cold Leg A Mass Flow Rate (POS4B-HPSI)=165,192,1
Fig. 3.3-30. HPSI Mass Flow Rate To Cold Leg 1 At Loop A (POS4B-HPSI)=165,192,1
Fig. 3.3-31. Mass Flow Rate Through Pressurizer Manway (POS4B-HPSI)=166,193,1
Fig. 3.3-32. Normalized Pressurizer Collapsed Liquid Level (POS4B-HPSI)=166,193,1
Fig. 3.3-33. Reactor Core Collapsed Liquid Level (POS4B-HPSI)=167,194,1
Fig. 3.3-34. Fuel Cladding Temp. At The Reactor Core Bottom, Middle, And Top (POS4B-HPSI)=167,194,1
Fig. 3.3-35. Core Top And SG A Secondary Pressure (POS5-HPSI)=174,201,1
Fig. 3.3-36. Core Top Liquid Temperature (POS5-HPSI)=175,202,1
Fig. 3.3-37. Hot And Cold Leg A Void Fraction (POS5-HPSI)=175,202,1
Fig. 3.3-38. Void Fraction At The Reactor Core Bottom, Middle, And Top (POS5-HPSI)=176,203,1
Fig. 3.3-39. Hot And Cold Leg A Mass Flow Rate (POS5-HPSI)=176,203,1
Fig. 3.3-40. HPSI Mass Flow Rate To Cold Leg 1 At Loop A (POS5-HPSI)=177,204,1
Fig. 3.3-41. Mass Flow Rate Through SG A&B Inlet Plenum Manway (POS5-HPSI)=177,204,1
Fig. 3.3-42. Normalized Pressurizer Collapsed Liquid Level (POS5-HPSI)=178,205,1
Fig. 3.3-43. Reactor Core Collapsed Liquid Level (POS5-HPSI)=178,205,1
Fig. 3.3-44. Fuel Cladding Temp. At The Reactor Core Bottom, Middle, And Top (POS5-HPSI)=179,206,1
Fig. 3.3-45. Core Top And SG A Secondary Pressure (POS4B-GF)=187,214,1
Fig. 3.3-46. Core Top Liquid Temperature (POS4B-GF)=188,215,1
Fig. 3.3-47. Hot And Cold Leg A Liquid Temperature (POS4B-GF)=188,215,1
Fig. 3.3-48. Hot And Cold Leg A Void Fraction (POS4B-GF)=189,216,1
Fig. 3.3-49. Void Fraction At The Reactor Core Bottom, Middle, And Top (POS4B-GF)=189,216,1
Fig. 3.3-50. Hot And Cold Leg A Mass Flow Rate (POS4B-GF)=190,217,1
Fig. 3.3-51. Gravity Feed Mass Flow Rate To Cold Legs At Loop A And B (POS4B-GF)=190,217,1
Fig. 3.3-52. Mass Flow Rate Through Pressurizer Manway (POS4B-GF)=191,218,1
Fig. 3.3-53. Normalized Pressurizer Collapsed Liquid Level (POS4B-GF)=191,218,1
Fig. 3.3-54. Reactor Core Collapsed Liquid Level (POS4B-GF)=192,219,1
Fig. 3.3-55. Fuel Cladding Temp. At The Reactor Core Bottom, Middle, And Top (POS4B-GF)=192,219,1
Fig. 3.3-56. Core Top And SG A Secondary Pressure (POS5-GF)=199,226,1
Fig. 3.3-57. Core Top Liquid Temperature (POS5-GF)=200,227,1
Fig. 3.3-58. Hot And Cold Lee A Liquid Temperature (POS5-GF)=200,227,1
Fig. 3.3-59. Hot And Cold Leg A Void Fraction (POS5-GF)=201,228,1
Fig. 3.3-60. Void Fraction At The Reactor Core Bottom, Middle, And Top (POS5-GF)=201,228,1
Fig. 3.3-61. Hot And Cold Leg A Mass Flow Rate (POS5-GF)=202,229,1
Fig. 3.3-62. Gravity Feed Mass Flow Rate To Cold Legs At Loop A And B (POS5-GF)=202,229,1
Fig. 3.3-63. Mass Flow Rate Through SG A&B Inlet Plenum Manway (POS5-GF)=203,230,1
Fig. 3.3-64. Normalized Pressurizer Collapsed Liquid Level (POS5-GF)=203,230,1
Fig. 3.3-65. Reactor Core Collapsed Liquid Level (POS5-GF)=204,231,1
Fig. 3.3-66. Fuel Cladding Temp. At The Reactor Core Bottom, Middle, And Top (POS5-GF)=204,231,1
Fig. 3.4-1. Maximum RCS Pressure And Temperature Of Each POS=212,239,1
Fig. 3.4-2. Core Boiling And Damage Time Of Each POS=212,239,1
*표시는 필수 입력사항입니다.
| 전화번호 |
|---|
| 기사명 | 저자명 | 페이지 | 원문 | 기사목차 |
|---|
| 번호 | 발행일자 | 권호명 | 제본정보 | 자료실 | 원문 | 신청 페이지 |
|---|
도서위치안내: / 서가번호:

우편복사 목록담기를 완료하였습니다.
*표시는 필수 입력사항입니다.
저장 되었습니다.
