
 대표어


권호기사보기
| 기사명 | 저자명 | 페이지 | 원문 | 기사목차 |
|---|
결과 내 검색
동의어 포함
목차
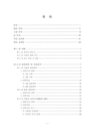
[표제지 등]=0,1,2
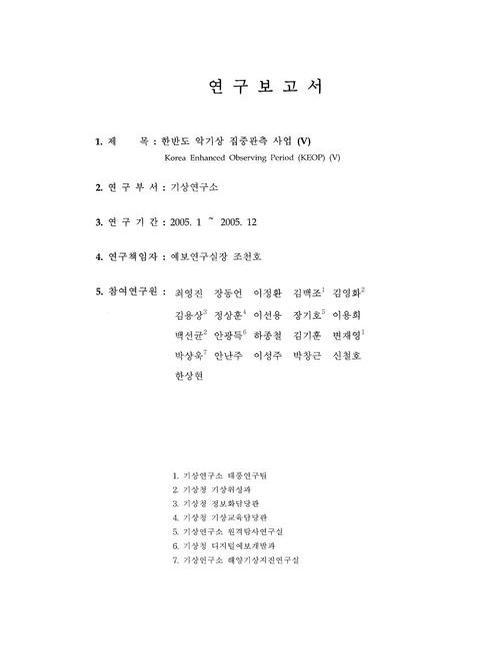
연구보고서=0,3,1
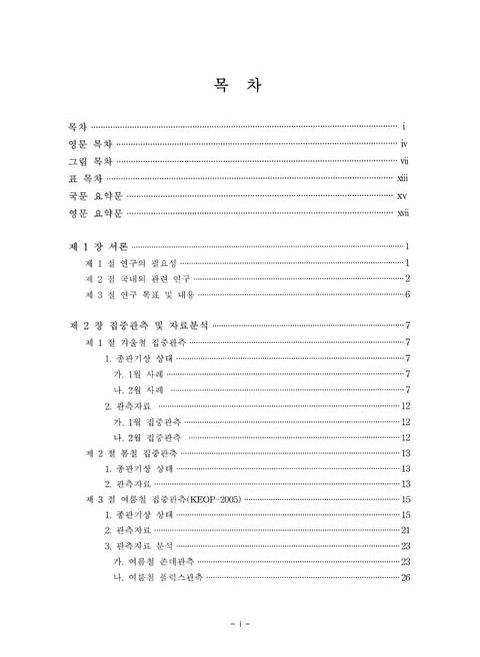
목차=i,4,3
Contents=iv,7,3
List of Figures=vii,10,6
List of Tables=xiii,16,2
요약문=xv,18,2
Summary=xvii,20,3
제1장 서론=1,23,1
제1절 연구의 필요성=1,23,2
제2절 국내외 관련 연구=2,24,5
제3절 연구 목표 및 내용=6,28,1
제2장 집중관측 및 자료분석=7,29,1
제1절 겨울철 집중관측=7,29,1
1. 종관기상 상태=7,29,1
가. 1월 사례=7,29,1
나. 2월 사례=7,29,5
2. 관측자료=12,34,1
가. 1월 집중관측=12,34,1
나. 2월 집중관측=12,34,2
제2절 봄철 집중관측=13,35,1
1. 종관기상 상태=13,35,1
2. 관측자료=13,35,3
제3절 여름철 집중관측(KEOP-2005)=15,37,1
1. 종관기상 상태=15,37,6
2. 관측자료=21,43,3
3. 관측자료 분석=23,45,1
가. 여름철 존데관측=23,45,4
나. 여름철 플럭스관측=26,48,1
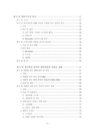
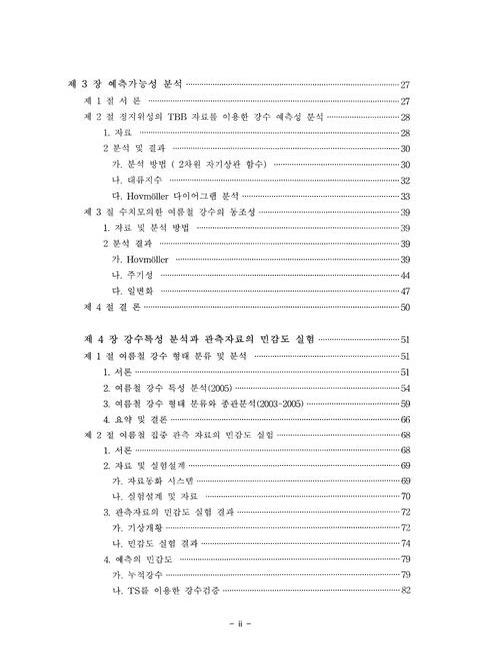
제3장 예측가능성 분석=27,49,1
제1절 서론=27,49,1
제2절 정지위성의 TBB 자료를 이용한 강수 예측성 분석=28,50,1
1. 자료=28,50,3
2. 분석 및 결과=30,52,1
가. 분석 방법 (2차원 자기상관 함수)=30,52,3
나. 대류지수=32,54,2
다. Hovmoller 다이어그램 분석(이미지 참조)=33,55,6
제3절 수치모의한 여름철 강수의 동조성=39,61,1
1. 자료 및 분석 방법=39,61,1
2. 분석 결과=39,61,1
가. Hovmoller(이미지 참조)=39,61,6
나. 주기성=44,66,4
다. 일변화=47,69,3
제4절 결론=50,72,1
제4장 강수특성분석과 관측 자료의 민감도 실험=51,73,1
제1절 여름철 강수 형태 분류 및 분석=51,73,1
1. 서론=51,73,3
2. 여름철 강수 특성 분석(2005)=54,76,5
3. 여름철 강수 형태 분류와 종관분석(2003-2005)=59,81,7
4. 요약 및 결론=66,88,2
제2절 여름철 집중 관측 자료의 민감도 실험=68,90,1
1. 서론=68,90,2
2. 자료 및 실험설계=69,91,1
가. 자료동화 시스템=69,91,2
나. 실험설계 및 자료=70,92,3
3. 관측자료의 민감도 실험 결과=72,94,1
가. 기상개황=72,94,3
나. 민감도 실험결과=74,96,6
4. 예측의 민감도=79,101,1
가. 누적강수=79,101,3
나. TS를 이용한 강수검증=82,104,2
다. RMSE를 이용한 검증=83,105,4
5. 요약 및 결론=86,108,2
제5장 장수 돌풍 사례 분석=88,110,1
제1절 서론=88,110,2
제2절 배경장 분석=90,112,12
제3절 국지 관측 분석=101,123,1
1. 군산 NEXRAD 레이더 관측 및 분석=102,124,2
2. 장수 지점의 AWS 시계열 분석=103,125,2
3. 군산 윈드프로파일러 분석=105,127,2
제4절 대류세포의 구조 분석=106,128,1
1. 바람과 반사도의 3차원 구조=106,128,3
2. 레이더 자료를 사용하지 않았을 경우와의 차이 분석=108,130,5
제5절 요약 및 결론=113,135,1
제6장 요약 및 향후 계획=114,136,3
참고문헌=117,139,10
부록=127,149,1
1. 여름철 집중관측(KEOP-2005) 기간의 지상일기도=128,150,18
2. 학술용역과제 결과 보고서 : 가. 장마전선의 접근에 따른 한반도 남서지역 플럭스 집중관측=146,168,1
목차=147,169,1
1. 용역 개요=148,170,1
1.1. 용역명=148,170,1
1.2. 관측 개요=148,170,1
2. 플럭스 관측=148,170,1
2.1. 관측 기간=148,170,1
2.2. 관측 지점=148,170,1
2.3. 관측 장비=148,170,3
2.4. 자료 처리=150,172,3
2.5. 관측방법과 관측요소=152,174,1
3. 관측 기간 기상 상태=153,175,1
4. 관측 결과=154,176,1
4.1. 플럭스 관측 결과=154,176,20
5. 요약=174,196,2
3. KEOP DB 시스템 개발 완료보고서=176,198,1
목차=177,199,1
1. 개발개요=178,200,1
1.1. 개발의 목적=178,200,1
1.2. 개발 배경=178,200,1
1.3. 시스템의 특징=178,200,1
2. 개발 범위=179,201,1
2.1. 개발 절차와 업무 범위=180,202,1
2.2. 시스템 개발 내용=181,203,1
3. 기존 KEOP 홈페이지 시스템 개요=182,204,1
3.1. UI=182,204,1
3.2. 시스템 특징=182,204,1
4. 관련 기술 검토=183,205,1
4.1. Web 모델별 구조=183,205,3
4.2. Web 관련 기술=186,208,1
4.3. Web Client/Server 구조=186,208,1
5. 새 KEOP 홈페이지 시스템 구조=187,209,1
5.1. 시스템 구성도=187,209,2
5.2. 시스템 구성요소=189,211,2
5.3. DB ERD=191,213,1
5.4. DB 구성=192,214,2
5.5. 새 KEOP 홈페이지의 메뉴 구성도=194,216,1
5.6. 새 KEOP 홈페이지의 UI=195,217,1
6. 프로그램 설명=196,218,1
6.1. ftp 프로그램 설명 및 순서도=196,218,2
6.2. Data 변환 및 DB 입력 프로그램 설명=197,219,1
7. 개발 추진 일정=198,220,1
8. 투입 인력=199,221,1
9. 문의처=199,221,1
Fig. 2.1.1. Surface Weather Charts And Satellite Images (a)0000UTC, (b)0600UTC, And (c)1200UTC 21 January 2005=8,30,1
Fig. 2.1.2. Time Series Of Temperature, Wind Speed, Wind Direction, Precipitation, Relative Humidity, And Pressure At Haenam AWS Site 21 January 2005=9,31,1
Fig. 2.1.3. Surface Weather Charts From 31 January To 3 February 2005=9,31,1
Fig. 2.1.4. 500hPa Weather Charts From 31 January To 3 February 2005=10,32,1
Fig. 2.1.5. Snowfall From 31 January To 3 February 2005=11,33,1
Fig. 2.1.6. Maximum Altitude Of Autosonde Observation Of Each Time From 0400UTC 21 To 1900UTC 3 February 2005=12,34,1
Fig. 2.1.7. Maximum Altitude Of Autosonde Observation Of Each Time From 0500UTC 31 January To 0200UTC January 2005=13,35,1
Fig. 2.2.1. Surface Weather Charts From 2 May 2005 To 3 May 2005=14,36,1
Fig. 2.2.2. Maximum Altitude Of Autosonde Observation Of Each Time From 0500UTC 31 January To 0200UTC January 2005=15,37,1
Fig. 2.3.1. Keop-2005 Observational Network=16,38,1
Fig. 2.3.2. Surface (Left), 500hPa (Middle), And 200hPa(Right) Weather Charts At The Beginning Time Of Changma (From 1200UTC 24 Jun 2005 To 0000UTC 26 June 2005)=17,39,1
Fig. 2.3.3. Surface Weather Charts And Satellite Images (a)0000UTC 28 June, (b) 0000UTC 1 July, And (c) 0900UTC 28 July 2005=18,40,1
Fig. 2.3.4. Radar Imageries(Left Panels) And Precipitation Per Day(Right Panels) At (a)0000UTC 28 June, (b) 0000UTC 1 July, And (c) 0900UTC 28 July 2005=19,41,1
Fig. 2.3.5. Surface(Upper Panels), 500hPa(Middle Panels), And 200hPa(Lower Panels) At The Ending Time Of Changma(From 17 July 2005 To 28 July 2005)=20,42,1
Fig. 2.3.6. Maximum Altitude Of Each Observation Site Of Each Time From 19 June To 18 July 2005=22,44,1
Fig. 2.3.7. The Vertical Distribution Of (a) Equivalent Potential Temperature, (b)U- Component Of Wind, And (c)V-Component Of Wind. Vertical bars(d) Represents Precipitation During Summertime In 2005=24,46,1
Fig. 2.3.8. Time Series Of (a)Net Radiation, (b)Sensible Heat Flux, (c)Latent Heat Flux, And (d) Soil Water Contents During Summertime In 2005=25,47,1
Fig. 3.2.1. Domain For The Hovmoller Calculation (Thick Line: 20°~40°N, 105°~135°E)(이미지 참조)=29,51,1
Fig. 3.2.2. A Schematic Illustration Of The Negative Cosine-Rectangular Weighting Function That Was Rotated Until The Autocorrelation Coefficient Was Maximized=30,52,1
Fig. 3.2.3. The Convective Index Derived From GOES-9 Brightness Temperature (Upper Pane) And The Total Amount Of Precipitation Rate (mm/h) At 11 Sites Located In The Southwest Of Korea (Lower Panel)=32,54,1
Fig. 3.2.4. Hovmoller Diagram Of Convective Index (CI) Derived From GOES-9 Brightness Temperature For (a) Winter, (b) Spring, (c) Summer And (d) Fall, Where The Period Of Winter Is Represented Two Months(이미지 참조)=33,55,1
Fig. 3.2.5. Hovmoller(Left) And Streak(Right) Diagram For Changma Period (2004.6.24 - 2004. 7. 17)(이미지 참조)=34,56,1
Fig. 3.2.6. The Scatter Plot Of Span And Duration Of All Identified Cloud Streaks For The Period Of (a) Changma And (b) Summer=36,58,1
Fig. 3.2.7. The Scatter Plot Of Span(Left Two Panels) And Duration(Right Tow Panels) That Compared With Propagation For The Period Of Changma(Upper Two Panels) And Sumrner(Under Two Panels)=37,59,1
Fig. 3.3.1. Hovmoller (Longitude-Time : Time In UTC) Diagram Of Convective Index Which Is Defined As A Difference Of Water Vapor Channel (IR3) Brightness Temperature And Infrared Channel (IR1) For The Period Of 25 June And 12 July 2005(이미지참조)=40,62,1
Fig. 3.3.2. Latitude-Time Plots (Time In UTC) Of Convective Index For The Periods Of 25 June-12 July 2005=41,63,2
Fig. 3.3.3. (a) Hovmoller Diagram Of Rianfall From WRF Model For The Period Of 25 June And 12 July 2005.(이미지 참조)=42,64,1
Fig. 3.3.4. Same Fig. 3. 1. 9, But For WRF Rainfall Forecast. Daily Rainfall Is Composed With 7-12- Hour Forecasts=44,66,1
Fig. 3.3.5. Power Spectrum Of The Convective Index Averaged Over 5 Longitudinal Bands At (a) 105-110°E, (b) 110-115°E, (c) 115-120°E, (d) 120-125°E, (E) 125-130°E, (F) 130-135°E For 25 June-12 July 2005=45,67,1
Fig. 3.3.6. Same As Fig. 3.3.5, But For WRF Rainfall Forecasts=46,68,1
Fig. 3.3.7. (a) Time-Longitude Convective Index Diagram For 25 June-12 July 2005=48,70,1
Fig. 3.3.8. (a) Time-Latitude Convective Index Diagram For 25 June-12 July 2005=49,71,1
Fig. 4.1.1. Stacked Doppler Spectra From Manus Island 915-MHS Wind Profiler For 0058:50 UTC 29 July 1992=52,74,1
Fig. 4.1.2. Logical Flow Diagram Of Rain Classification Algorithm (From Williams et al., 1995)=54,76,1
Fig. 4.1.3. Frequency Distribution Of Doppler Spectral Moments For Precipitating Clouds Classified As Stratiform Clouds During The Summertime(June-August)=57,79,1
Fig. 4.1.4. Same As Fig. 4.1.3 Except For Precipitating Clouds Classified As Mixed Stratiform/Convective Clouds=57,79,1
Fig. 4.1.5. Same As Fig. 4.1.3 Except For Precipitating Clouds Classified As Deep Convective Clouds=58,80,1
Fig. 4.1.6. Same As Fig. 4.1.3 Except For Precipitating Clouds Classified As Shallow Convective Clouds=58,80,1
Fig. 4.1.7. Occurrence Frequency Of Each Rain Type In Precipitating Cloud System Observed During Summer Season In (a)2003, (b)2004, And (c)2005 At Haenam Site=60,82,1
Fig. 4.1.8. Percentage Of Precipitation Categories During Changma Period=61,83,1
Fig. 4.1.9. Horizontal Distribution Of Total Amount Precipitation(mm) During Changma Period In 2003 (a) And 2004 (b) Using GPCP 1° X 1 ° Daily Data=62,84,1
Fig. 4.1.10. Horizontal Distribution Of 850hPa Vorticity And Moisture Flux Averaged During Changma Period In 2003 (a), 2004 (b), And 2005 (c)=64,86,1
Fig. 4.1.11. Vertical Cross Section Of Averaged Equivalent Potential Temperature And Streamline During Changma Period Along 127°E In 2003(a), 128°E In 2004 (b), And 128°E In 2005 Between 20°N And 55°N=65,87,1
Fig. 4.2.1. The Schematic Diagram Of (a) WRF/KLAPS 6-hr Assimilation Cycle And (b) Cold Start System=70,92,1
Fig. 4.2.2. The Domain For Numerical Experiments And KEOP-2005 Observational Sites(이미지 참조)=71,93,1
Fig. 4.2.3. The Surface Weather Charts(Left). MTSAT Enhanced IR Imageries (Middle), And Radar Imageries (Right) At 1800UTC 8 July 2004 And In 12 Hours(CASE I)=73,95,1
Fig. 4.2.4. Same As Fig. 4.2.2 Except For 1800UTC 10 July 2004(Case II)=73,95,1
Fig. 4.2.5. Same As Fig. 4.2.2 Except For 1800UTC 11 July 2004(Case III)=74,96,1
Fig. 4.2.6. Horizontal Difference Map Of 850hPa Temperature ((a),(b)), 700hPa Water Vapor Mixing Ratio ((c),(d)), And Geopotential Height ((e),(f)) With Wind Of SND II From CNT For 1800UTC 8 July 2005=76,98,1
Fig. 4.2.7. Same As Fig. 4.2.6 Except For 1800UTC 11 July 2005=77,99,1
Fig. 4.2.8. Horizontal Difference Map Of 850hPa Temperature ((a),(b)), 700hPa Water Vapor Mixing Ratio ((c),(d)), And Geopotential Height (e),(f)) With Wind Of SND I From CNT For 1800UTC 10 July 2005=78,100,1
Fig. 4.2.9. Simulated((a)CNT, (b)SND II), Difference Of Snd II From CNT(c), And Observed(d) 12-Hours Accumulated Rainfall Amount At 1800UTC 8 July 2005=80,102,1
Fig. 4.2.10. Same As Fig. 4.2.9 Except Fot 1800UTC 11 July 2005=80,102,1
Fig. 4.2.11. Simulated((a)CNT, (b)SND I ), Difference Of SND I From CNT(c), And Observed(d) 12-Hours Accumulated Rainfall Amount At 1800UTC 8 July 2005=81,103,1
Fig. 4.2.12. Threat Score Of Cnt(Opened Circle), SND I (Filled Circle), And SND II (Filled Triangle) Relative To Cooperative AWS Stations For Various Thresholds Of 12-hourly Accumulated Precipitation (Inch) At 1800UTC 10 July 2005=83,105,1
Fig. 4.2.13. Terrain With Radiosonde Sites. Dashed Circles Are Representing Verification Areas=84,106,1
Fig. 4.2.14. RMSE In CNT(Dark Gray) And SND I(Black) : 8500hPa Temperature(Upper), 500hPa V-Component Wind Speed(Middle), MSLP(Bottom). X-Axis Of Chart Is Representing Forecast Time=85,107,1
Fig. 4.2.15. Same As Fig. 4.2.14 Except For 850hPa Temperature=86,108,1
Fig. 5.2.1. Surface Charts And IR Images Of GOES 9 From 0000UTC To 1800UTC On July 1, 2005=91,113,1
Fig. 5.2.2. The Panels In Column (a) Include Equivalent Potential Temperature(EPT) On 850hPa Surface With Wind Vectors Of The Same Pressure Level=94,116,2
Fig. 5.2.3. Comparison Of The Analyzed Field At 0000UTC On July 1,2005 And The 1 Hour Forecasted Field From This Time=97,119,1
Fig. 5.2.4. The Evolution Of The Changma Front From 0000UTC To 1800UTC On July 1, 2005. The Explanation Of The Figure Is The Same As That Of The Fig.5.2.3=98,120,2
Fig. 5.3.1. The Domain And Topography Of The Analysis Area. The Filled Circle Indicates The Center Of The Domain As Well As The Gunsan NEXRAD Site=101,123,1
Fig. 5.3.2. The Remapped Reflectivity Factor On 925hPa Level From 1400UTC To 1800UTC On July 1,2005 In 30 Minutes Interval=102,124,2
Fig. 5.3.3. The AWS Time Series Of Jangsu Observatory From 0000KST To 1200KST On July 2, 2005=104,126,1
Fig. 5.3.4. The Wind Profiler Observation From Gunsan Site. The Period Is From 0000KST To 0800KST On July 2, 2005=105,127,1
Fig. 5.4.1. The 12 Minutes Forecast From The Initial Time At 1700UTC On July 1, 2005. In (a), The 925hPa Radar Reflectivity Factor And Circulation Wind Vectors Are Displayed=107,129,1
Fig. 5.4.2. Three Dimensional Display Of The Convective Cell At The Same Time Of The (e) Of The Fig. 5.4.1, But The View Point Is The North-East Side Of The Convective Cell While That Of The (e) Of The Fig. 5.4.1 Is South=108,130,1
Fig. 5.4.3. The One Minute Forecast From 1700UTC On July 1, 2005=109,131,1
Fig. 5.4.4. Storm Relative Helicity At The One Minutes Forecast From 1700UTC=110,132,2
Fig. 5.4.5. The 40 Minutes Forecast From 1700UTC On July 1, 2005. Others Are The Same As Those Of The Fig. 5.4.3=111,133,1
*표시는 필수 입력사항입니다.
| 전화번호 |
|---|
| 기사명 | 저자명 | 페이지 | 원문 | 기사목차 |
|---|
| 번호 | 발행일자 | 권호명 | 제본정보 | 자료실 | 원문 | 신청 페이지 |
|---|
도서위치안내: / 서가번호:

우편복사 목록담기를 완료하였습니다.
*표시는 필수 입력사항입니다.
저장 되었습니다.
