
 대표어
대표어
권호기사보기
| 기사명 | 저자명 | 페이지 | 원문 | 기사목차 |
|---|
결과 내 검색
동의어 포함
목차
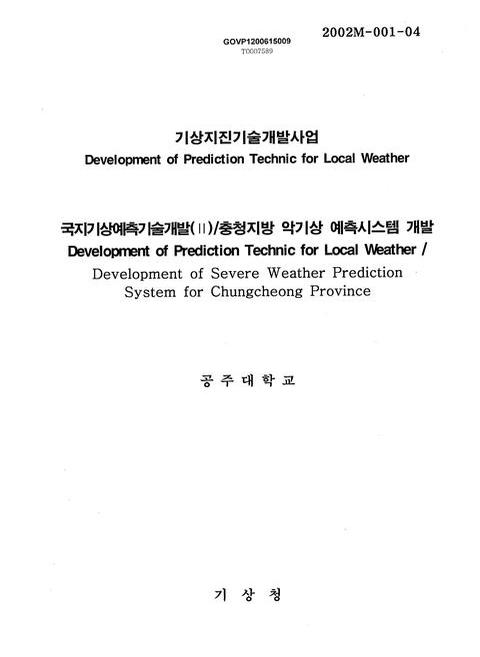
[표제지]=0,1,1
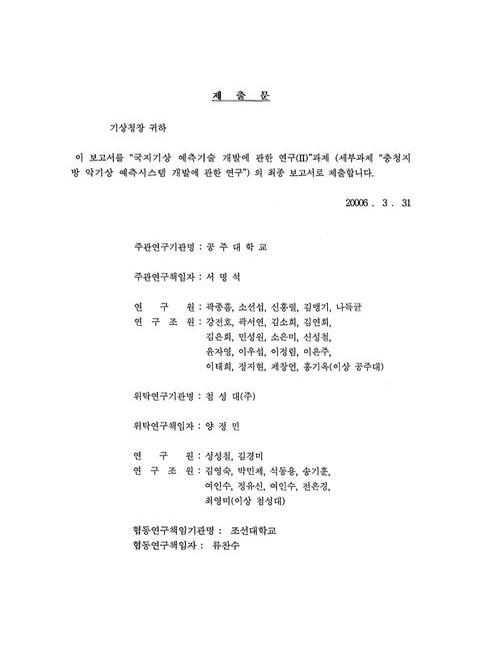
제출문=0,2,1
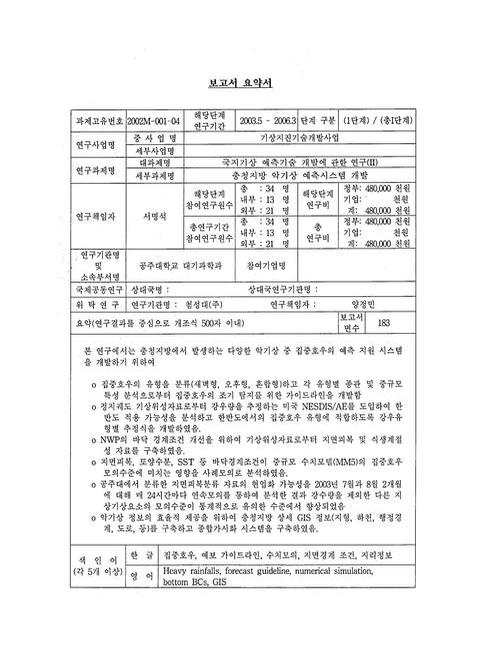
보고서 요약서=0,3,1
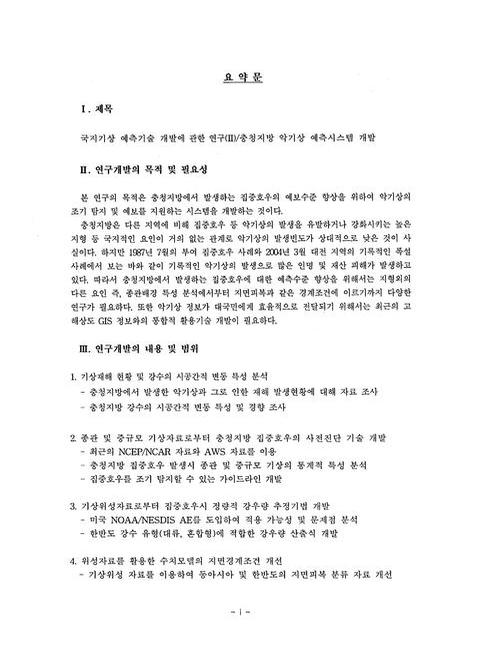
요약문=i,4,4
Summary=v,8,5
Contents=x,13,3
목차=xiii,16,3
List Of Figures=xvi,19,7
List Of Tables=xxiii,26,2
제1장 연구개발과제의 개요=1,28,1
제1절 연구개발의 필요성=1,28,2
제2절 연구개발의 내용 및 범위=2,29,3
제2장 국내외 기술개발 현황=5,32,8
제3장 연구개발 수행 내용 및 결과=13,40,1
제1절 재해 현황 및 강수의 변동 특성=13,40,1
1. 충청지방 기상재해 현황=13,40,4
2. 강수의 변동 경향=16,43,6
3. 강수의 일 변동=21,48,1
가. 서론=22,49,2
나. 자료 및 연구방법=23,50,4
다. 연구결과=26,53,13
라. 토의 및 결론=38,65,3
제2절 집중호우 사전진단 기술 개발=41,68,1
1. 서론=41,68,2
2. 자료 및 연구 방법=42,69,3
3. 집중호우 시 강수량 일변화의 특성=45,72,3
4. 집중호우의 유형별 합성 분석=47,74,1
가. 종관규모=47,74,4
나. 국지규모=50,77,5
5. 집중호우 유형의 사전탐지=55,82,25
6. 결론=80,107,4
제3절 위성 자료를 이용한 정량적 강우량 추정=84,111,1
1. 서론=84,111,2
2. 자료 및 연구방법=85,112,5
3. 연구 결과=90,117,1
가. NOAA/NESDIS AE의 한반도 적용 타당성 검토=90,117,4
나. 강우유형의 분류=93,120,8
다. 강우량 추정식 개발=101,128,1
라. 유형별 강우량 추정식의 적용 및 평가=102,129,3
4. 요약 및 결론=105,132,1
제4절 기상위성 자료를 이용한 모델의 지면경계조건 개선=106,133,1
1. 서론=106,133,2
2. USGS 지면피복의 문제=108,135,2
3. 한반도 지면피복 분류=110,137,1
가. MODIS 자료의 전처리=110,137,3
나. 군집분류=112,139,3
다. 지면피복 분류 및 정의=114,141,2
라. 분류결과 검증=115,142,6
마. USGS 지면피복과의 비교=120,147,3
4. 소결론=122,149,2
제5절 지면경계조건에 대한 민감도 연구 및 현업화 가능성 분석=124,151,1
1. 서론=124,151,2
2. 자료 및 연구방법=125,152,1
가. 자료=125,152,1
나. 연구방법=125,152,4
다. 충청지방의 집중호우 사례=128,155,3
3. 모의 결과 및 토의=131,158,1
가. 지면피복의 변화가 강수모의에 미치는 영향=131,158,8
나. 토양수분이 단기예보에 미치는 영향=138,165,9
다. 해수면온도의 시ㆍ공간적 분해능이 단기예보에 미치는 영향=146,173,2
라. 지면피복 변화의 현업 가능성 평가=147,174,6
4. 소결론=152,179,5
제6절 충청지방 상세 GIS DB 구축 및 통합 가시화시스템 개발=157,184,1
1. 서론=157,184,1
2. 충청지방 GIS DB 구축=158,185,1
가. 지형정보 DB 구축=159,186,3
나. 경계정보 DB 구축=162,189,2
3. 악기상정보 활용기술개발=164,191,1
가. GIS 정보 및 기상정보 중첩시 고려사항=165,192,2
나. 기상요소의 표출=167,194,2
다. 원격탐사자료의 표출=169,196,2
라. 기상 GIS 시스템=170,197,4
마. 사례분석 홈페이지 구축=173,200,1
4. GIS/기상정보 활용기법 조사=174,201,1
가. 국내/외 참고 사이트 및 문서=174,201,3
제4장 목표달성도 및 관련분야에의 기여도=177,204,6
제5장 연구개발결과의 활용계획=183,210,2
참고문헌=185,212,9
Fig. 2-1-1. Damages And Fatalities Caused By Weather Related Hazards Over The Republic Of Korea During 1994-2003: (a) Total Sum Of Damages(Unit:A Million Korean Won)=6,33,1
Fig. 3-1-1. Spatial Distribution Of Historical Heavy Snowfalls Occurred In Chungcheong Province On March 5, 2004=13,40,1
Fig. 3-1-2. Total Days Of Heavy Rainfalls For Observation Sites Located In Chungcheong Province During 30 Years(1973~2002)=15,42,1
Fig. 3-1-3. Annual Average Rainfall Amounts(㎜) And Their Standard Deviation For The Recent 30 Years=17,44,1
Fig. 3-1-4. Tendency(Left) And Significance Level(Right) Of The Heavy Rainfall Amounts, Rainfall Days, And Intensity=18,45,1
Fig. 3-1-5. Spatial Distribution Of The Ratio(%) Of The Rainy Season Rainfalls(Left) And Heavy Rainfalls(Right) To Annual Precipitation=19,46,1
Fig. 3-1-6. Spatial Distribution Of The Ratio(%) Of Monthly Heavy Rainfalls To Annual Heavy Rainfalls=20,47,1
Fig. 3-1-7. Same As In Fig. 3-1-4 Except For Heavy Rainfalls=21,48,1
Fig. 3-1-8. The Geographic Distribution Of The 60 Meteorological Observation Stations In South Korea=24,51,1
Fig. 3-1-9. Anomalies Of The Rainy Season(June, July, August, And September;Hereafter(JJAS)) Precipitation From 30-Years Average In South Korea From 1973 To 2002. Thick Lines Show A ±1.0 SD=25,52,1
Fig. 3-1-10. Diurnal Variation Of 30-Year Averaged Hourly Precipitation Amount For The Each Month. 3-h Moving Average Is Applied To Remove The Small Variations=26,53,1
Fig. 3-1-11. Same As In Fig. 3 Except For Precipitation Intensity=27,54,1
Fig. 3-1-12. Diurnal Variation Of Hourly Precipitation Amount(a), Frequency(b), And Intensity(c) According To The Precipitation Regime(Wet, Average, And Dry) Of Rainy Season=28,55,2
Fig. 3-1-13. Diurnal Variation Of 30-Year Averaged Hourly Precipitation Intensity And Frequency For The Heavy Rainfall Events(≥80 ㎜/day). 3-h Moving Average Is Applied To Remove The Small Variations=29,56,1
Fig. 3-1-14. Spatial Distribution Of Normalized Diurnal Cycles(NDP) Of The Hourly Precipitation During Rainy Season(JJAS) For The Selected Local Standard Times=31,58,1
Fig. 3-1-15. Same As In Fig. 7 Except For Precipitation Frequency=32,59,1
Fig. 3-1-16. Same As In Fig. 7 Except For Each Month And 3-Hour Interval=33,60,2
Fig. 3-1-17. Diurnal Variations Of Normalized Diurnal Cycles(NDP) Of Hourly Precipitation For The Representative Station According To The Clustering Results=36,63,1
Fig. 3-1-18. Spatial Distribution Of Precipitation Types Based On The Diurnal Variation Pattern Of Hourly Precipitation. The Number Indicates Precipitation Type And Shading Represents Topography=36,63,1
Fig. 3-1-19. Relationship Between Early Morning Peak And Environments. (a):Relation Between Precipitation Amount And Topography, (b):Relation Between Precipitation Intensity And Topography=38,65,1
Fig. 3-2-1. The Geographic Distribution Of The 11 Surface(ㆍ) And 2 Aerological Observation Stations(+) In Chungcheong Region Of South Korea=44,71,1
Fig. 3-2-2. Diurnal Variation Of Hourly Precipitation(㎜, Upper) And Mean Precipitation For The 18Cases Of Heavy Rainfall(㎜, Bottom)=45,72,1
Fig. 3-2-3. Diurnal Variation Of Hourly Precipitation(㎜, Upper) And Mean Precipitation For The Dawn Type Of Heavy Rainfall(㎜, Bottom)=46,73,1
Fig. 3-2-4. Same As Fig.3-2-3. Except For Afternoon Type=47,74,1
Fig. 3-2-5. Spatial Distribution Of (a) Geopotential Height(Solid Line) And Temperature(Dotted Line) At 1000 hPa, (b) Wind(Vector), Geopotential Height(Solid Line)=49,76,1
Fig. 3-2-6. Same As Fig.3-2-5. Except For The Afternoon Type=50,77,1
Fig. 3-2-7. The Composite Of Vertical Distribution Using Upper Data (a) Temperature(Dot), Specific Humidity(Solid), (b) Depression Of The Dew Point(5℃ Bold Solid), Equivalent Potential Temperature(333K≤Shaded)=52,79,1
Fig. 3-2-8. The Composite Of Vertical Distribution Using Upper Data (a) Temperature(Dot), Specific Humidity(Solid), (b) Depression Of The Dew Point(5℃ Bold Solid), Equivalent Potential Temperature(333K≤Shaded)=53,80,1
Fig. 3-2-9. The Time Series Of Precipitation(Bar), Temperature(Solid Line), And Specific Humidity(Dotted Line) At Surface With The Center(day=0) At 12UTC For dawn Type=54,81,1
Fig. 3-2-10. Same As In Fig.3-2-9 Except For Case Of The Afternoon Type With The Center(day=0) At 00UTC=54,81,1
Fig. 3-2-11. The Spatial Difference Distribution For Geopotential Height(Solid Line For Positive Values And Dotted Line For Negative Values With The Interval Of 5 gpm) Between Dawn And Afternoon Types At 850 hPa=55,82,1
Fig. 3-2-12. Same As Fig.3-2-5. Except For The Case 4=58,85,1
Fig. 3-2-13. Same As Fig.3-2-5. Except For The Case 6=59,86,1
Fig. 3-2-14. Same As Fig.3-2-5. Except For The Case 9=60,87,1
Fig. 3-2-15. Same As Fig.3-2-5. Except For The Case 10=61,88,1
Fig. 3-2-16. Same As Fig.3-2-5. Except For The Case 7=62,89,1
Fig. 3-2-17. Same As Fig.3-2-5. Except For The Case 8=63,90,1
Fig. 3-2-18. Same As Fig.3-2-5. Except For The Case 13=64,91,1
Fig. 3-2-19. Same As Fig.3-2-5. Except For The Case 15=65,92,1
Fig. 3-2-20. Same As Fig.3-2-5. Except For The Case 16=66,93,1
Fig. 3-2-21. Vertical Distribution Using Upper Data (a) Temperature(Dot), Specific Humidity(Solid), (b) Depression Of The Dew Point(5℃ Bold Solid), Equivalent Potential Temperature(333K≤Shaded)=67,94,1
Fig. 3-2-22. Same As In Fig.3-2-21. Except For The Case 4 Of Heavy Rainfall=68,95,1
Fig. 3-2-23. Same As In Fig.3-2-21. Except For The Case 6 Of Heavy Rainfall=68,95,1
Fig. 3-2-24. Same As In Fig.3-2-21. Except For The Case 9 Of Heavy Rainfall=69,96,1
Fig. 3-2-25. Same As In Fig.3-2-21. Except For The Case 10 Of Heavy Rainfall=69,96,1
Fig. 3-2-26. Same As In Fig.3-2-21. Except For The Case 7 Of Heavy Rainfall=70,97,1
Fig. 3-2-27. Same As In Fig.3-2-21. Except For The Case 8 Of Heavy Rainfall=70,97,1
Fig. 3-2-28. Same As In Fig.3-2-21. Except For The Case 13 Of Heavy Rainfall=71,98,1
Fig. 3-2-29. Same As In Fig.3-2-21. Except For The Case 15 Of Heavy Rainfall=71,98,1
Fig. 3-2-30. Same As In Fig.3-2-21. Except For The Case 16 Of Heavy Rainfall=72,99,1
Fig. 3-2-31. The Time Series Of Precipitation(Bar), Temperature(Solid Line), And Specific Humidity(Dotted Line) At Surface With The Center(day=0) At 1200 UTC 10 July 1998(Case 2 In Table 3-2-1)=72,99,1
Fig. 3-2-32. Same As In Fig.3-2-31. Except For 1200 UTC 8 August 1998(Case 4)=73,100,1
Fig. 3-2-33. Same As In Fig.3-2-31. Except For 1200 UTC 15 August 1998 (Case 6)=73,100,1
Fig. 3-2-34. Same As In Fig.3-2-31. Except For 1200 UTC 22 July 2000(Case 9)=74,101,1
Fig. 3-2-35. Same As In Fig.3-2-31. Except For 1200 UTC 29 June 2001(Case 10)=74,101,1
Fig. 3-2-36. Same As In Fig.3-2-31. Except For 0000 UTC 16 June 1999(Case 7)=75,102,1
Fig. 3-2-37. Same As In Fig.3-2-31. Except For 0000 UTC 23 June 1999(Case 8)=75,102,1
Fig. 3-2-38. Same As In Fig.3-2-31. Except For 0000 UTC 22 July 2002(Case 13)=76,103,1
Fig. 3-2-39. Same As In Fig.3-2-31. Except For 0000 UTC 27 June 2003(Case 15)=76,103,1
Fig. 3-2-40. Same As In Fig.3-2-31. Except For 0000 UTC 9 July 2003(Case 16)=77,104,1
Fig. 3-2-41. The Conceptual Synoptic Pattern For Dawn Type Of Heavy Rainfall=80,107,1
Fig. 3-2-42. The Conceptual Synoptic Pattern For Afternoon Type Of Heavy Rainfall=81,108,1
Fig. 3-2-43. Flow-Chart For Prior Detection Of Heavy Rainfall Type=83,110,1
Fig. 3-3-1. Geographical Location Of Automatic Weather Station(AWS) Network In South Korea=87,114,1
Fig. 3-3-2. Flow Chart Of This Study.(CAE : Convective Type Auto Estimator, MAE : Mixed Type Auto Estimator)=87,114,1
Fig. 3-3-3. Hourly Rainfall Rate Estimated By The Power Law For The Given Cloud Top Temperature(CTT) From 260˚K To 180˚K=88,115,1
Fig. 3-3-4. General Flow Of Evaluation Processes Of The A-E Algorithm=89,116,1
Fig. 3-3-5. Block Diagram Of Algorithm For Estimating Rainfall According To The Rainfall Type=89,116,1
Fig. 3-3-6. Temporal Variation Of Correlation Coefficients(Solid Line), POD(Dotted Line), And FAR(Dashed Line) With The Observed Precipitation=92,119,1
Fig. 3-3-7. Scatter Plots Between CTT And AWS Observed Rainfall Rate For The Worst Cases (4, 7) And The Best Case(9, 12)=95,122,1
Fig. 3-3-8. Scatter Plots Between CTT And AWS Rainfall For The Case Of (a) Stratiform, (b) Convective, And (c) Mixed Rainfalls=97,124,1
Fig. 3-3-9. Distribution Of GOES Enhanced IR Imagery(Left Panel) And Hourly Accumulated Rainfall(Right Panel) (a) And (b) The Stratiform, (c) And (d) The Convective, And (e) And (f) The Mixed Rainfalls=98,125,1
Fig. 3-3-10. Temporal Variation Of (a) The Number Of Pixels Below 223k, (b) The Rain Intensity, (c) The Number Of AWS Over 20㎜/h, And (d) The Number Of AWS Over 0.5㎜ For Each Typical Rainfall Type=99,126,1
Fig. 3-3-11. Flowchart For The Classification Of The Rainfall Type=100,127,1
Fig. 3-3-12. Comparison Of Regression Curves For The Rainfall Rate Estimation=101,128,1
Fig. 3-3-13. Comparison Of a), GOES Enhanced IR Imagery b), Observed Rainfalls, c), Derived Rainfalls By AE And d), Derived Rainfalls By CAE=102,129,1
Fig. 3-3-14. Same As In Fig.3-3-13 Except For MAE=103,130,1
Fig. 3-3-15. Temporal Variation Of Simple Statistics According To The Rainfall Estimation Algorithm: (a), Convective And (b), Mixed Type=104,131,1
Fig. 3-4-1. USGS Land Cover Map Over Korean Peninsula=109,136,1
Fig. 3-4-2. Block Diagram For The Land Cover Classification=110,137,1
Fig. 3-4-3. Frequency Of NDVI For (a) Max., Min., Amp., And Ave., (b) Growing/Shedding Rate, And (c) Greenness Period=112,139,1
Fig. 3-4-4. Sample Image For The Post-Processing, (a) "Clust-5", (b) Temporal Variation Of Average NDVI With 2 Sigma, (c) Temporal Variation Of Average NDVI After Postprocessing=115,142,1
Fig. 3-4-5. Sample Image Of Ground-Truth Data-Base=117,144,1
Fig. 3-4-6. Land Cover Map Of Korean Peninsula Classified In This Study=118,145,1
Fig. 3-4-7. Temporal Variation Of Averaged NDVI According To The Land Cover Type=119,146,1
Fig. 3-4-8. Comparison Of Percentage For Each Land Cover Type Between KLCV And USGS Over South Korea=120,147,1
Fig. 3-4-9. Comparison Of Land Cover Type Between USGS And KLCV Map, (a) Gross Category That Assigned By Hansen(2000) And (b) Original Land Cover Type Category=122,149,1
Fig. 3-5-1. The Triple-Nested Model Domain Configuration In MM5 Simulation With 45(D01), 15(D02), And 5(D03) ㎞ Horizontal Resolutions=127,154,1
Fig. 3-5-2. Land Cover Maps Of Domain 3 For (a) CNTL, (b) MD06, (c) MD08, (d) MD15, And (e) KLCV Experiments=129,156,1
Fig. 3-5-3. Surface Weather Map And Satellite Imagery For The 3 Heavy Rainfall Cases Over Chungcheong Province. (a) And (b) For 12 UTC 27 June 2003=130,157,1
Fig. 3-5-4. The Spatial Distribution Of 12-Hour Accumulated Rainfall(㎜) From 00 UTC To 12 UTC 27 June 2003: (a) Observation And The Simulation With (b) CNTL, (c) MD06, (d) MD08, (e) MD15=132,159,1
Fig. 3-5-5. As In Fig.3-5-4, Except For 12 UTC 24 To 00 UTC 25 July 2003=133,160,1
Fig. 3-5-6. As In Fig.3-5-4, Except For 00 To 12 UTC 27 August 2003=134,161,1
Fig. 3-5-7. Time Series Of Domain Average Of Observed (Bar) And Simulated(Line) Hourly Rainfalls(㎜) Over MDL(Left) And STH (Right) For The Heavy Rainfall Case On (a) And (b) 27 June, (c) And (d) On 24 July=135,162,1
Fig. 3-5-8. Temporal Variations Of Area Averaged Hourly Precipitation(㎜)(Bar) And Surface Fluxes(Wm-2)(Line) Over The MDL(Left) And STH(Right) Areas From The Simulation Of Heavy Rainfall On 24 July 2003=137,164,1
Fig. 3-5-9. The Differences Of The Time Averaged PBL Moist Static Energy(×103 J ㎏-1) Between DRY(Left)/WET(Right) And CNTL From The Simulation On (a) And (b) 27 June 2003, (c) And (d) 24 July 2003=140,167,1
Fig. 3-5-10. As In Fig.3-5-9, Except For Daily Averaged Rain(㎜/day)=141,168,1
Fig. 3-5-11. Time Averaged 850 hPa Moisture Convergence(㎏ s-1) From The Simulation Of DRY(Left) And WET(Right) Experiments On (a) And (b) 27 June 2003, (c) And (d) 24 July 2003=143,170,1
Fig. 3-5-12. As In Fig.3-5-11, Except For Total Evaporation(㎜/day)=144,171,1
Fig. 3-5-13. As In Fig.3-5-11, Except For Moisture Recycling Ratio(%)=145,172,1
Fig. 3-5-14. Differences Of SST Between SST6(Left) Or SSTD(Right) And CNTL Experiments On (a) And (b) 27 June, (c) And (d) 24 July, (e) And (f) 27 August 2003, Respectively=148,175,1
Fig. 3-5-15. Surface Flux Difference(Left) Between SST6/SSTD And CNTL And Moist Static Energy For The Case On (a) And (b) 26 June, (c) And (d) 23 July, (e) And (f) 26 August 2003, Respectively=149,176,1
Fig. 3-5-16. As In Fig.3-5-4, 3-5-5, And 3-5-6 Except For The Simulation With SST6(Left) And SSTD(Righ) Experiments=150,177,1
Fig. 3-5-17. Two Month(July To August 2003) Averaged Bias And Mean Absolute Error(MAE) Of (a) And (b) Temperature At 2m, (c) And (d) Mixing Ratio At 2m=153,180,1
Fig. 3-5-18. CSI Score Of Light Rain(Left Pannel) And Strong(>10㎜) Rain Accumulated By 3 (Top), 6(Middle), And 12(Bottom) Hours=154,181,1
Fig. 3-6-1. 3" DEM Korea(Left) And Chungchung Province(Right)=159,186,1
Fig. 3-6-2. Topography, Satellite And Composition Of Daejeon=161,188,1
Fig. 3-6-3. Homepage(Left) And Meteorological GIS(Right)=164,191,1
Fig. 3-6-4. Meteorological GIS Sample=164,191,1
Fig. 3-6-5. GIS Layer Overlap=165,192,1
Fig. 3-6-6. AWS Temperature By Inverse Distance Weighting(Left) And Potential Temperature-Inverse Distance Weighting(Right)=167,194,1
Fig. 3-6-7. KMA RDAPS Temperature(Left) And Precipitation(Right) By Inverse Distance Weighting=167,194,1
Fig. 3-6-8. Display Sample Of Meteorological Informations=168,195,1
Fig. 3-6-9. Radar And Satellite Image=169,196,1
Fig. 3-6-10. Satellite(Top) And Radar(Bottom) Image=170,197,1
Fig. 3-6-11. Meteorological GIS(2003)=171,198,1
Fig. 3-6-12. Image Tile Sample=172,199,1
Fig. 3-6-13. Meteorological GIS(2005)=172,199,1
Fig. 3-6-14. Homepage=173,200,1
영문목차
[title page etc.]=0,1,3
Summary=i,4,4
Summary In English=v,8,5
Contents In English=x,13,3
Contents=xiii,16,3
List Of Figures=xvi,19,7
List Of Tables=xxiii,26,2
Chapter 1. Introduction=1,28,1
Section 1. Needs For R & D=1,28,2
Section 2. Contents And Scope Of R & D=2,29,3
Chapter 2. Status 5 International R & D=5,32,8
Chapter 3. Research Contents 5 Results=13,40,1
Section 1. Status Of Weather Disasters And Precipitation Characteristics=13,40,1
1. Status Of Weather Disasters=13,40,4
2. Trend Of Precipitation=16,43,6
3. Diurnal Variation Of Precipitation=21,48,1
a. Introduction=22,49,2
b. Data And Method=23,50,4
c. Results=26,53,13
d./c. Discussion And Conclusion=38,65,3
Section 2. Development Of Prediagnostic Technique Of Heavy Rainfalls=41,68,1
1. Introduction=41,68,2
2. Data And Method=42,69,3
3. Diurnal Variation Of Heavy Rainfalls=45,72,3
4. Composite Analysis For Each Type Of Heavy Rainfall=47,74,1
a. Synoptic Scale=47,74,4
b. Local Scale=50,77,5
5. Pre-Detecting Of Heavy Rainfall Type=55,82,25
6. Conclusion=80,107,4
Section 3. Quantitative Rainfall Estimation Using Satellite Data=84,111,1
1. Introduction=84,111,2
2. Data And Method=85,112,5
3. Results=90,117,1
a. NOAA/NESDIS AE=90,117,4
b. Classification Of Rainfall Types=93,120,8
c. Development Of Estimation Technique Based On The Rainfall Types=101,128,1
d. Evaluation Of Rainfall Estimation Technique=102,129,3
4. Summary and Conclusion=105,132,1
Section 4. Improvement Of Bottom BCs For NWP Models Using Satellite Data=106,133,1
1. Introduction=106,133,2
2. Status Of USGS Land Cover Map=108,135,2
3. Classification Of Land Cover Over Korean Peninsula=110,137,1
a. Preprocessing Of MODIS=110,137,3
b. Clustering Using ISOdata=112,139,3
c. Post Processing=114,141,2
d. Verification Of Land Cover Map=115,142,6
e. Comparison With USGS NDVI=120,147,3
4. Summary=122,149,2
Section 5. Impacts Of BCs On The Simulation Of Heavy Rainfalls=124,151,1
1. Introduction=124,151,2
2. Data And Methods=125,152,1
a. Data=125,152,1
b. Method=125,152,4
c. Cases Of Heavy Rainfall Over Chungcheong Province=128,155,3
3. Results And Discussion=131,158,1
a. Impacts Of Land Cover Changes On Tile Simulation Of Heavy Rainfall=131,158,8
b. Impacts Of Soil Moisture On The Simulation Of Heavy Rainfall=138,165,9
c. Impacts Of High Resolution Of SST On The Simulation Of Heavy Rainfall=146,173,2
d. Statistical Validation Of Land Cover Changes Impacts=147,174,6
4. Conclusion=152,179,5
Section 6. Development Of Detailed GIS DB And Integrated Visualization System=157,184,1
1. Introduction=157,184,1
2. Construction For GIS DB=158,185,1
a. Topological Information DB=159,186,3
b. Polygonal Information DB=162,189,2
3. Development Of Applied Technique For Severe Weather Information=164,191,1
a. Consideration Of Piling Meterological Information On GIS=165,192,2
b. Display Of Meteorological Elements=167,194,2
c. Display Of Remote Sensing Data=169,196,2
d. Meteorological GIS System=170,197,4
e. Construction Of Homepage=173,200,1
4. Investigation Of Applied Technique For GIS And Meteorological Information=174,201,1
a. Reference Site=174,201,3
Chapter 4. Achievements And Contributions=177,204,6
Chapter 5. Applications Plans=183,210,2
References=185,212,9
jpg
Fig. 3-1-1. Spatial Distribution Of Historical Heavy Snowfalls Occurred In Chungcheong Province On March 5, 2004=13,40,1
Fig. 3-1-2. Total Days Of Heavy Rainfalls For Observation Sites Located In Chungcheong Province During 30 Years(1973~2002)=15,42,1
Fig. 3-1-4. Tendency(Left) And Significance Level(Right) Of The Heavy Rainfall Amounts, Rainfall Days, And Intensity=18,45,1
Fig. 3-1-5. Spatial Distribution Of The Ratio(%) Of The Rainy Season Rainfalls(Left) And Heavy Rainfalls(Right) To Annual Precipitation=19,46,1
Fig. 3-1-6. Spatial Distribution Of The Ratio(%) Of Monthly Heavy Rainfalls To Annual Heavy Rainfalls=20,47,1
Fig. 3-1-7. Same As In Fig. 3-1-4 Except For Heavy Rainfalls=21,48,1
Fig. 3-2-2. Diurnal Variation Of Hourly Precipitation(㎜, Upper) And Mean Precipitation For The 18Cases Of Heavy Rainfall(㎜, Bottom)=45,72,1
Fig. 3-2-3. Diurnal Variation Of Hourly Precipitation(㎜, Upper) And Mean Precipitation For The Dawn Type Of Heavy Rainfall(㎜, Bottom)=46,73,1
Fig. 3-2-4. Same As Fig.3-2-3. Except For Afternoon Type=47,74,1
Fig. 3-2-9. The Time Series Of Precipitation(Bar), Temperature(Solid Line), And Specific Humidity(Dotted Line) At Surface With The Center(day=0) At 12UTC For dawn Type=54,81,1
Fig. 3-2-10. Same As In Fig.3-2-9 Except For Case Of The Afternoon Type With The Center(day=0) At 00UTC=54,81,1
Fig. 3-2-11. The Spatial Difference Distribution For Geopotential Height(Solid Line For Positive Values And Dotted Line For Negative Values With The Interval Of 5 gpm) Between Dawn And Afternoon Types At 850 hPa=55,82,1
Fig. 3-2-31. The Time Series Of Precipitation(Bar), Temperature(Solid Line), And Specific Humidity(Dotted Line) At Surface With The Center(day=0) At 1200 UTC 10 July 1998(Case 2 In Table 3-2-1)=72,99,1
Fig. 3-2-32. Same As In Fig.3-2-31. Except For 1200 UTC 8 August 1998(Case 4)=73,100,1
Fig. 3-2-33. Same As In Fig.3-2-31. Except For 1200 UTC 15 August 1998 (Case 6)=73,100,1
Fig. 3-2-34. Same As In Fig.3-2-31. Except For 1200 UTC 22 July 2000(Case 9)=74,101,1
Fig. 3-2-35. Same As In Fig.3-2-31. Except For 1200 UTC 29 June 2001(Case 10)=74,101,1
Fig. 3-2-36. Same As In Fig.3-2-31. Except For 0000 UTC 16 June 1999(Case 7)=75,102,1
Fig. 3-2-37. Same As In Fig.3-2-31. Except For 0000 UTC 23 June 1999(Case 8)=75,102,1
Fig. 3-2-38. Same As In Fig.3-2-31. Except For 0000 UTC 22 July 2002(Case 13)=76,103,1
Fig. 3-2-39. Same As In Fig.3-2-31. Except For 0000 UTC 27 June 2003(Case 15)=76,103,1
Fig. 3-2-40. Same As In Fig.3-2-31. Except For 0000 UTC 9 July 2003(Case 16)=77,104,1
Fig. 3-3-9. Distribution Of GOES Enhanced IR Imagery(Left Panel) And Hourly Accumulated Rainfall(Right Panel) (a) And (b) The Stratiform, (c) And (d) The Convective, And (e) And (f) The Mixed Rainfalls=98,125,1
Fig. 3-3-13. Comparison Of a), GOES Enhanced IR Imagery b), Observed Rainfalls, c), Derived Rainfalls By AE And d), Derived Rainfalls By CAE=102,129,1
Fig. 3-3-14. Same As In Fig.3-3-13 Except For MAE=103,130,1
Fig. 3-4-1. USGS Land Cover Map Over Korean Peninsula=109,136,1
Fig. 3-4-6. Land Cover Map Of Korean Peninsula Classified In This Study=118,145,1
Fig. 3-4-7. Temporal Variation Of Averaged NDVI According To The Land Cover Type=119,146,1
Fig. 3-5-2. Land Cover Maps Of Domain 3 For (a) CNTL, (b) MD06, (c) MD08, (d) MD15, And (e) KLCV Experiments. The Land Cover Index 10, 6, 8 And 15 Indicate A Savanna=129,156,1
Fig. 3-5-4. The Spatial Distribution Of 12-Hour Accumulated Rainfall(㎜) From 00 UTC To 12 UTC 27 June 2003=132,159,1
Fig. 3-5-5. As In Fig.3-5-4, Except For 12 UTC 24 To 00 UTC 25 July 2003=133,160,1
Fig. 3-5-6. As In Fig.3-5-4, Except For 00 To 12 UTC 27 August 2003=134,161,1
Fig. 3-5-7. Time Series Of Domain Average Of Observed (Bar) And Simulated(Line) Hourly Rainfalls(㎜) Over MDL(Left) And STH (Right) For The Heavy Rainfall Case On (a) And (b) 27 June=135,162,1
Fig. 3-5-8. Temporal Variations Of Area Averaged Hourly Precipitation(㎜)(Bar) And Surface Fluxes(Wm-2)(Line) Over The MDL(Left) And STH(Right) Areas From The Simulation Of Heavy Rainfall On 24 July 2003=137,164,1
Fig. 3-5-14. Differences Of SST Between SST6(Left) Or SSTD(Right) And CNTL Experiments On (a) And (b) 27 June, (c) And (d) 24 July, (e) And (f) 27 August 2003, Respectively=148,175,1
Fig. 3-5-16. As In Fig.3-5-4, 3-5-5, And 3-5-6 Except For The Simulation With SST6(Left) And SSTD(Righ) Experiments=150,177,1
*표시는 필수 입력사항입니다.
| 전화번호 |
|---|
| 기사명 | 저자명 | 페이지 | 원문 | 기사목차 |
|---|
| 번호 | 발행일자 | 권호명 | 제본정보 | 자료실 | 원문 | 신청 페이지 |
|---|
도서위치안내: / 서가번호:

우편복사 목록담기를 완료하였습니다.
*표시는 필수 입력사항입니다.
저장 되었습니다.
