
 대표어
대표어
권호기사보기
| 기사명 | 저자명 | 페이지 | 원문 | 기사목차 |
|---|
결과 내 검색
동의어 포함
목차
[표제지]=0,1,1
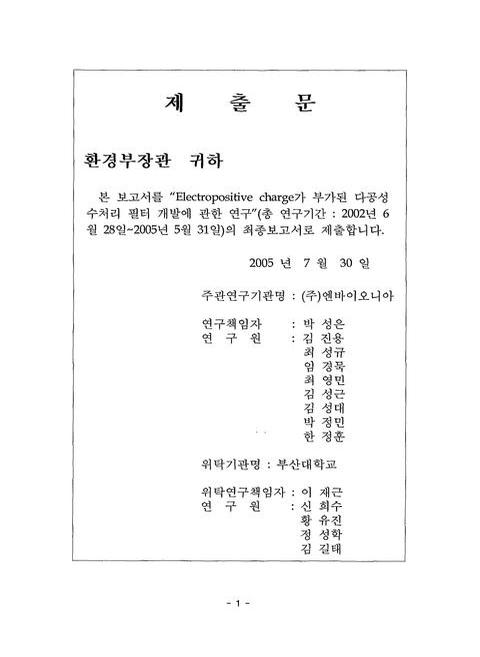
제출문=1,2,1
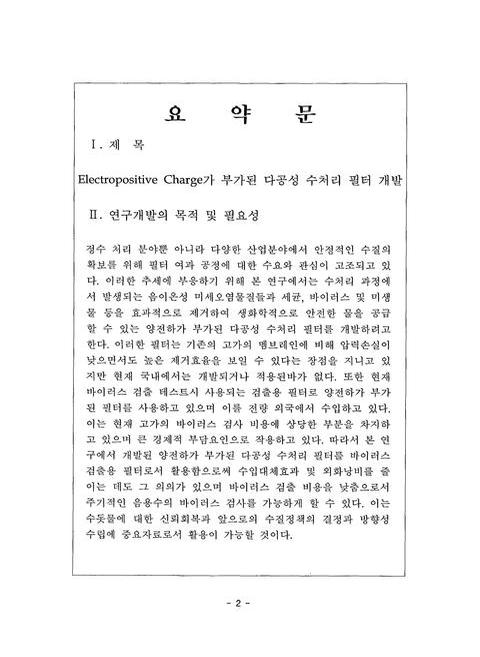
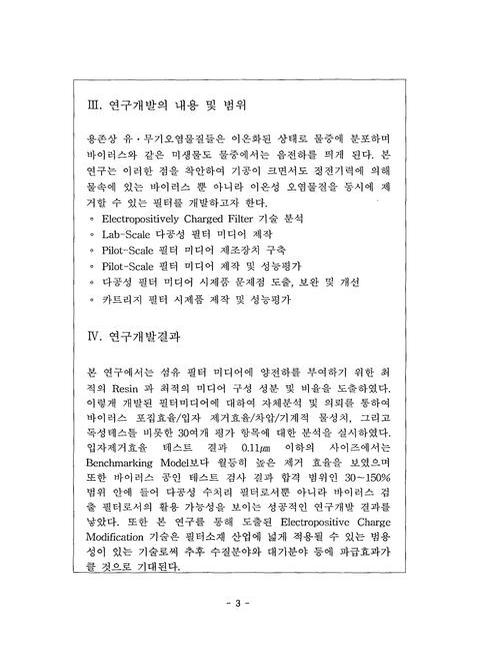
요약문=2,3,3
Summary=5,6,1
Contents=6,7,2
Table=8,9,2
Figure=10,11,3
목차=13,14,2
표차례=15,16,1
그림차례=16,17,2
제1장 서론=17-1,19,1
제1.1절 연구개발의 필요성=18,20,1
1. 기술개발의 배경=18,20,2
2. 기술개발의 필요성 및 기대효과=19,21,2
제1.2절 연구개발의 목적=21,23,2
제1.3절 연구개발의 범위=23,25,1
1. 연구개발 수행도=23,25,1
2. 연구개발 세부내용=24,26,3
제2장 국내외 기술 개발 현황=26-1,29,1
제2.1절 국외 기술 개발 현황=27,30,2
제2.2절 국내 기술 개발 현황=29,32,2
제2.3절 관련 주요 특허 및 논문 분석=31,34,1
1. 정전하 부가 관련=31,34,3
2. 미디어 제작 공정 관련=33,36,2
3. 그 외 관련 논문=35,38,3
제3장 연구개발수행 내용 및 결과=37-1,41,1
제3.1절 Electropositiyely Charged 필터 미디어 제작=38,42,1
1. Charge Modification 메카니즘 분석=38,42,6
2. Lab-Scale 필터 미디어 제작=44,48,23
제3.2절 Pilot Scale 필터미디어 제작=67,71,1
1. 필터 미디어 제조 장치 구축=67,71,8
2. Pilot-Scale 필터 미디어 제작 및 성능평가=75,79,16
3. 다공성 필터 미디어 보완 및 개선=90,94,15
제3.3절 다공성 필터 시제품 제작 및 성능평가=105,109,1
1. 다공성 필터 시제품 설계=105,109,1
2. 다공성 필터 시제품 제작 공정=106,110,11
3. 카트리지 필터 시제품 성능평가=116,120,3
제4장 연구개발목표 달성도 및 대외기여도=118-1,123,1
제4.1절 연구목표 및 달성도=119,124,1
1. Electropositively Charged 필터 미디어 제작=119,124,3
2. Pilot Scale 필터 미디어 제조장치 설계 및 제작=122,127,2
3. 다공성 필터 시제품 제작=124,129,4
제4.2절 대외기여도=128,133,1
1. 기술적 기여도=128,133,1
2. 사회적 기여도=129,134,1
제5장 연구개발결과의 활용계획=129-1,135,1
제1절 적용분야=130,136,1
1. 바이러스 검출 테스트용 필터=130,136,1
2. 산업분야=130,136,1
3. 가정용 정수기 필터=131,137,1
제2절 타 연구에의 응용=132,138,1
1. 대기필터 분야=132,138,1
2. 기존 멤브레인 필터에의 적용=132,138,1
제3절 사업화 추진방안=133,139,1
1. 주요수요처=133,139,1
2. 마케팅 및 제품 생산방안=133,139,2
3. 시장진입 및 점유율 확장=134,140,1
제4절 추가연구의 필요성=135,141,1
1. 제품성능 향상=135,141,1
2. 응용분야 확대를 위한 제품 다변화=135,141,1
제6장 참고문헌=135-1,142,6
(첨부 #1. 바이러스 회수율 시험 성적서)=141,148,1
(첨부 #2. Bubble Test 시험 성적서)=142,149,1
(첨부 #3. 기계적 물성치 테스트 결과)=143,150,1
(첨부 #4. 관련 특허출원)=144,151,1
(그림1. Schematic Diagram Of A Particle's Surface Charge)=40,44,1
(그림2. Melamine Formaldehyde Colloid Resin 분자 구조)=43,47,1
(그림3. Polyamine Epichlorohydrin Resin 분자 구조)=43,47,1
(그림4. Colloid Resin SEM 분석 : (A) Resin 1, (B) Resin 3, (C) Resin 5)=46,50,1
(그림5. Filter Media Sample의 SEM 분석 : (A) Resin 1, (B) Resin 3, (C) Resin 4, (D) Resin 5, (E) Resin 6, (F) Resin 7, (G) Resin 8, (H) Resin 9, (I) Resin 10, (J) Resin 11)=52,56,5
(그림6. Resin비에 따른 입자제거효율 그래프)=60,64,1
(그림7. "G"와 "C"비율에 따른 입자제거효율 그래프)=61,65,1
(그림8. Filtration Efficiency Of The Resin Ratio)=63,67,1
(그림9. Resin비에 따른 유량별 차압)=64,68,1
(그림10. Glass Fiber와 Cellulose 비율에 따른 유량별 차압)=66,70,1
(그림11. 필터 미디어 제조 공정 흐름도)=68,72,1
(그림12. 필터 미디어 제조 장치 I 개략도)=69,73,1
(그림13. 필터 미디어 제조 장치 II개략도)=70,74,1
(그림14. Pilot Scale Filter Media 제조장치 II 설계도)=74,78,1
(그림15. Pilot Scale Filter Media 시제품 평가항목)=76,80,1
(그림16. "C"사의 "M"제품 광학 현미경 사진)=77,81,1
(그림17. Pilot Scale 필터 미디어 SEM 분석 - Resin 3)=77,81,1
(그림18. Pilot Scale 필터 미디어 SEM 분석 - Resin 4)=78,82,1
(그림19. "C"사와 본 연구 개발 필터 미디어의 SEM 분석)=78,82,1
(그림20. Pilot Scale 필터 미디어 SEM/Pore Size 분석 결과)=79,83,1
(그림21. Resin 3을 이용한 Pilot Scale 필터 미디어 SEM(50:50:100))=80,84,1
(그림22. Resin 3을 이용한 Pilot Scale 필터 미디어 SEM(50:50:200))=80,84,1
(그림23. Resin 4를 이용한 Pilot Scale 필터 미디어 SEM(50:50:50))=80,84,1
(그림24. Resin 4를 이용한 Pilot Scale 필터 미디어 SEM(50:50:100))=80,84,1
(그림25. 항균성 평가)=84,88,1
(그림26. Integrity Tester(Sartorius, Sartocheck3))=85,89,1
(그림27. Bubble Point Test의 원리)=86,90,1
(그림28. Diffusion Test의 원리)=86,90,1
(그림29. Depth Filler의 불완전한 Wetting Condition)=88,92,1
(그림30. Retention Test 장치의 개략도)=89,93,1
(그림31. 카렌도 롤로 표면 불소수지 코팅 : (A) 기존방식, (B) 테프론 코팅 처리)=91,95,1
(그림32. 진공흡입부분 개선을 통한 수분 제거)=93,97,1
(그림33. 슬러리 제조 장치의 조건)=95,99,1
(그림34. 공급호퍼의 개선)=96,100,2
(그림35. 필터 미디어 이송공정 보완 : (A) 압축공기분사방식, (B) 회전분리봉방식)=98,102,1
(그림36. 필터미디어와 이송 매쉬 분리 방법)=99,103,1
(그림37. Particle Size에 따른 입자제거효율)=101,105,1
(그림38. Flow rate에 따른 압력 손실)=102,106,1
(그림39. 본 연구의 필터미디어와 "C"사의 기공밀도 비교)=104,108,1
(그림40. 다공성 필터의 시제품)=105,109,1
(그림41. 필터 미디어 Slitting 기계)=107,111,2
(그림42. 필터미디어 간이 절곡기 설계도면)=109,113,1
(그림43. 필터미디어 간이 절곡기)=109,113,1
(그림44. 필터미디어 절곡기)=111,115,1
(그림45. Cartridge 필터를 제작하기 위한 필터미디어의 설계 치수)=111,115,1
(그림46. 카트리지에 삽입된 절곡 미디어)=112,116,1
(그림47. End-Cap 부착장치)=113,117,1
(그림48. End-Cap 부착순서)=114,118,2
(그림49. Cartridge Filter의 각 구성 요소와 완성품)=116,120,1
영문목차
[title page etc.]=0,1,5
Summary=5,6,1
Contents=6,7,2
Table=8,9,2
Figure=10,11,8
Chapter 1. Introduction=17-1,19,1
1.1. Reasons For Doing The Study=18,20,1
1. Problem Identification And Background=18,20,2
2. Reasons And Expectation=19,21,2
1.2. Research Goal And Objectives=21,23,2
1.3. Research Scope=23,25,1
1. Research Process=23,25,1
2. Detail Research=24,26,3
Chapter 2. Development Status Of Technology=26-1,29,1
2.1. Status Of Overseas Technology=27,30,2
2.2. Status Of Domestic Technology=29,32,2
2.3. Overview Of Overseas Technology=31,34,1
1. Charge Modification=31,34,3
2. Filter Media Manufacturing=33,36,2
3. Others=35,38,3
Chapter 3. Research Contents And Results=37-1,41,1
3.1. Electropositively Charged Filter Media=38,42,1
1. Charge Modification Mechanism=38,42,6
2. Lab-Scale Filter Media=44,48,23
3.2. Pilot-Scale Filter Media=67,71,1
1. Filter Media Manufacturing Equipment=67,71,8
2. Performance Test Of Pilot-Scale Filter Media=75,79,16
3. Improvement Of Filter Media And Manufacturing Process=90,94,15
3.3. Microporous Cartridge Filter Sample=105,109,1
1. Design=105,109,1
2. Manufacturing Process=106,110,11
3. Performance Test=116,120,3
Chapter 4. Achievement And Contribution=118-1,123,1
4.1. Research Goals And Actuevement=119,124,1
1. Electropositively Charged Filter Media=119,124,3
2. Filter Media Manufacturing Equipment=122,127,2
3. Performance Test Of Microporous Cartridge Filter Sample=124,129,4
4.2. Contributions Of The Study=128,133,1
1. Technical Contributions=128,133,1
2. Public Contributions=129,134,1
Chapter 5. Application Plan=129-1,135,1
5.1. Field Of Application=130,136,1
1. Virus Recovery Filter=130,136,1
2. Industrial Use=130,136,1
3. Domestic Water Filtration System=131,137,1
5.2. Other Application=132,138,1
1. Air Filter=132,138,1
2. Current Membrane=132,138,1
5.3. Commercialization Plan=133,139,1
1. Target Consumer=133,139,1
2. Marketing Strategy=133,139,2
3. Future Marketing Plan=134,140,1
5.4. Future Research=135,141,1
1. Improvement Of Filter Performance=135,141,1
2. Diversification Of Filter Products=135,141,1
[Chapter 6. Reference etc.]=135-1,142,10
(Fig. 1) Schematic Diagram Of A Particle's Surface Charge=40,44,1
(Fig. 2) Molecular Structure Of The Melamine Formaldchyde Colloid Resin=43,47,1
(Fig. 3) Molecular Structure Of The Polyamine Epichlorohydrin Resin=43,47,1
(Fig. 4) SEM Analysis Of The Colloid Resin=46,50,1
(Fig. 5) SEM Analysis Of The Sample Filter Media=52,56,5
(Fig. 6) Particle Removal Efficiency Graph According To The Resin Ratio=60,64,1
(Fig. 7) Particle Removal Efficiency Graph According To The "G" And "C" Ratio=61,65,1
(Fig. 8) Filtration Efficiency Of The Resin Ratio=63,67,1
(Fig. 9) Different Pressure Caused By Flux According To The Resin Ratio=64,68,1
(Fig. 10) Different Pressure According To The Glass Fiber And Cellulose Ratio=66,70,1
(Fig. 11) Manufacturing Process Diagram Of The Filter Media=68,72,1
(Fig. 12) Diagram Of Filter Media - I Manufacturing Device=69,73,1
(Fig. 13) Diagram Of Filter Media - II Manufacturing Device=70,74,1
(Fig. 14) A Plan Of Filter Media - II Manufacturing Device=74,78,1
(Fig. 15) Evaluation Of The Sample Pilot Scale Filter Media Product=76,80,1
(Fig. 16) SEM Analysis Of "M" Product Of "C" Company=77,81,1
(Fig. 17) SEM Analysis Of The Pilot Scale Filter Media - Resin 3=77,81,1
(Fig. 18) SEM Analysis Of The Pilot Scale Filler Media - Resin 4=78,82,1
(Fig. 19) SEM Analysis Of A "C" Company Product And The Filler Media=78,82,1
(Fig. 20) Result Of SEM And Pore Size Analysis Of The Pilot Scale Filler Media=79,83,1
(Fig. 21) SEM Analysis Of The Pilot Scale Filler Media Using Resin 3(50:50:100)=80,84,1
(Fig. 22) SEM Analysis Of The Pilot Scale Filter Media Using Resin 3(50:50:200)=80,84,1
(Fig. 23) SEM Analysis Of The Pilot Sca1e Filter Media Using Resin 4(5O:50:50)=80,84,1
(Fig. 24) SEM Analysis Of The Pilot Scale Filler Media Using Resin 4(50:50:100)=80,84,1
(Fig. 25) Antibiosis Evaluation=84,88,1
(Fig. 26) Integrity Fester=85,89,1
(Fig. 27) Principle Of The Bubble Point Test=86,90,1
(Fig. 28) Principle Of The Diffusion Test=86,90,1
(Fig. 29) Incomplete Welling Condition Of Depth Filter=88,92,1
(Fig. 30) Diagram Of Tile Retention Test Device=89,93,1
(Fig. 31) Fluorine Resin Coating Of Calender Roller Surface=91,95,1
(Fig. 32) Moisture Removal By The Vacuum Inhalation Enhancement=93,97,1
(Fig. 33) Condition Of The Slurry Manufacturing Device=95,99,1
(Fig. 34) Enhancement Of The Supply Hopper=96,100,2
(Fig. 35) Enhanced Transfer Process Of The Filter Media=98,102,1
(Fig. 36) Separation Method For Filter Media And Transfer Mesh=99,103,1
(Fig. 37) Particle Removal Efficiency According To The Particle Size=101,105,1
(Fig. 38) Pressure Loss According To The Flow Rale=102,106,1
(Fig. 39) Comparison Of Pore Density Of The Filter Media And The "C" Company Product=104,108,1
(Fig. 40) Sample Of Porous Filter=105,109,1
(Fig. 41) Slitting Machine=107,111,2
(Fig. 42) Design Diagram Of Pilot Scale Slitting Machine=109,113,1
(Fig. 43) Pilot Scale Pleat Machine=109,113,1
(Fig. 44) Pleat Machine Of Filter Media=111,115,1
(Fig. 45) A Design Measurement Of Filter Media For Cartridge Filter Manufacture=111,115,1
(Fig. 46) Pleated Media - Inserted Cartridge=112,116,1
(Fig. 47) End-Cap Adhering Equipment=113,117,1
(Fig. 48) Order Of End-Cap Adhering=114,118,2
(Fig. 49) Features Of Finished Cartridge Filter=116,120,1
*표시는 필수 입력사항입니다.
| 전화번호 |
|---|
| 기사명 | 저자명 | 페이지 | 원문 | 기사목차 |
|---|
| 번호 | 발행일자 | 권호명 | 제본정보 | 자료실 | 원문 | 신청 페이지 |
|---|
도서위치안내: / 서가번호:

우편복사 목록담기를 완료하였습니다.
*표시는 필수 입력사항입니다.
저장 되었습니다.
