

 대표어


권호기사보기
| 기사명 | 저자명 | 페이지 | 원문 | 기사목차 |
|---|
결과 내 검색
동의어 포함
목차
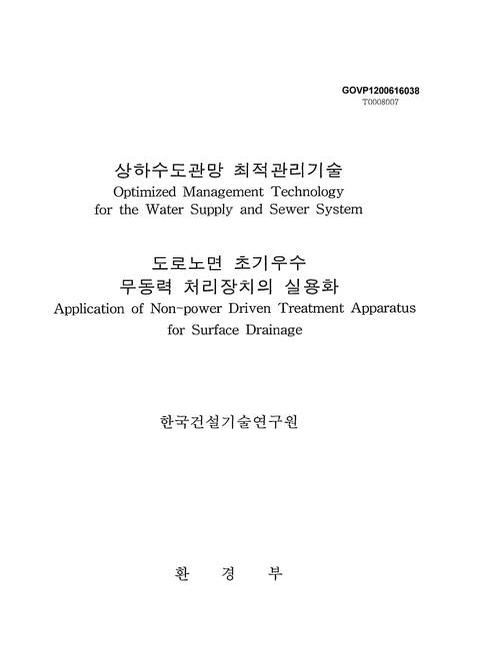
[표제지]=0,1,1
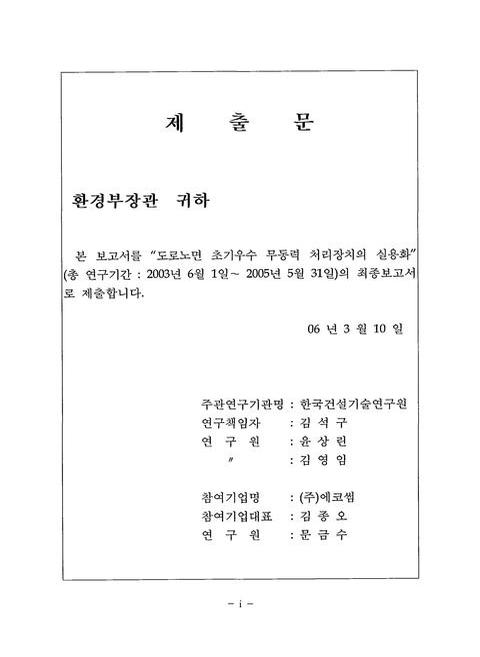
제출문=i,2,1
요약문=ii,3,5
Summary=vii,8,5
Contents=xii,13,3
목차=xv,16,4
List Of Tables=xix,20,4
List Of Figures=xxiii,24,6
제1장 서론=xxix,30,1
제1절 연구개발의 목적 및 필요성=1,31,1
1. 연구개발의 필요성=1,31,2
2. 연구개발의 목적=3,33,4
제2절 연구개발의 내용 및 범위=7,37,1
제3절 연구추진체계=8,38,1
제2장 국내외 기술개발 현황=8-1,39,1
제1절 국내 기술개발 현황=9,40,1
1. 국내의 주요 환경정책 추진현황=9,40,3
2. 국외의 주요 환경정책 추진현황=12,43,6
제2절 국내외 연구동향=17,48,1
1. 국내 비점오염원의 연구동향=17,48,3
2. 국외 비점오염원의 연구동향=19,50,6
제3장 이론적 고찰=24-1,56,1
제1절 비점오염원의 정의=25,57,1
1. 비점오염원의 특성=25,57,3
2. 비점오염원에 의한 수질영향=27,59,6
제2절 지역별 비점오염원의 배출 유형=32,64,1
1. 도시(공업)지역=33,65,1
2. 농업지역=33,65,2
3. 산림지역=34,66,2
4. 도로지역=35,67,2
5. 하천지역=36,68,1
6. 기타지역=37,69,1
제3절 도시지역 비점오염 유출특성=38,70,1
1. 도시지역 비점오염 유출특성=38,70,4
2. 비점오염원 구성 물질=42,74,13
제4절 비점오염원 관리기술 및 시설=55,87,1
1. 비점오염원 관리기술=55,87,1
2. 비점오염원 관리기술의 효과=55,87,3
3. 비점오염원 저감시설=57,89,21
제4장 연구개발수행 내용 및 결과=77-1,110,1
제1절 연구수행 방법=78,111,1
1. 개요=78,111,2
2. 연구지역의 선정=79,112,3
3. 실험방법=82,115,15
제2절 연구결과=97,130,1
1. 도로배수의 수질특성=97,130,6
2. 도로배수의 유출특성 평가=103,136,1
3. 설계 강우강도 선정 평가=104,137,5
4. 여재의 처리특성 분석=109,142,8
5. 처리장치의 수리계산=116,149,2
6. 강우강도별 처리장치(1/4규모)의 제거율=117,150,8
7. 노면 배수 처리장치(1/4 축소) 성능 실험=124,157,10
8. 실규모 장치를 이용한 실험=134,167,4
9. 현장 적용실험=138,171,37
10. 현장 적용 평가=175,208,2
제3절 도로노면 초기우수 무동력 처리장치 개발(EcoTank)=177,210,1
1. EcoTank의 특징=177,210,3
2. EcoTank에 의한 도로노면 초기빗물 처리 개념도=180,213,2
3. EcoTank의 설계처리량 및 집수구역=182,215,1
4. EcoTank 제원=183,216,1
5. EcoTank 설계=184,217,13
6. EcoTank 시작품=197,230,2
제4절 유지관리 지침서=199,232,1
1. 유지관리 계획=199,232,2
2. 유지관리 절차=200,233,2
3. EcoTank의 유지관리=201,234,3
4. EcoTank 장치관리=204,237,1
5. 퇴적물 관리=204,237,1
6. 여재 교체 시기=204,237,1
7. 사용 여재 처리=205,238,1
8. 유지관리자의 임무=205,238,1
9. EcoTank 유지관리 지침표=206,239,1
제5장 결론=206-1,240,6
제6장 연구개발목표 달성도 및 대외기여도=211-1,246,1
제1절 연구개발목표 달성도=212,247,2
1. 1차년도 연구개발목표 달성도=213,248,2
2. 2차년도 연구개발목표 달성도=214,249,2
제2절 대외기여도=215,250,2
1. 환경ㆍ기술적 측면=216,251,1
2. 사회ㆍ경제적 측면=216,251,2
제7장 연구개발결과의 활용계획=217-1,253,3
제8장 참고문헌=219-1,256,7
Fig. 1.1. Diagram Of Water Quality Pollution Loading Rate And Non-Point Source Management=2,32,1
Fig. 1.2. Non-Power Driven Treatment Apparatus For Surface Drainage; Ecotank®=3,33,1
Fig. 1.3. Treatment Apparatus Of Pollutant From Impervious Cover With Drainage=4,34,1
Fig. 1.4. Schematic Diagram Of Ecotank®=5,35,1
Fig. 1.5. Schematic Diagram Of Ecotank®(Under Designate Rain Intensity)=5,35,1
Fig. 1.6. Schematic Diagram Of Ecotank®(Over Designate Rain Intensity)=6,36,1
Fig. 3.1. Variation Of Runoff Volume At Runoff Time=28,60,1
Fig. 3.2. Generation Type Of Non-Point Source=32,64,1
Fig. 3.3. Soil Washing(a) And Concrete Draingae(b) In Sloppy Field=34,66,1
Fig. 3.4. Erosion Slope=35,67,1
Fig. 3.5. Non-Point Source On Road(a) And Inflow Of Initial Rain Collected At Bridge To River(b)=35,67,1
Fig. 3.6. Straighten Stream(a)And Parking Zone Of Terrace Land On The River=36,68,1
Fig. 3.7. Construction Field(a) And Abonded Mine(b)=37,69,1
Fig. 3.8. Emission Characteristics Of Impervious Cover=40,72,1
Fig. 3.9. Wet Expanded Detention Pond=65,97,1
Fig. 3.10. Wet Pond=65,97,1
Fig. 3.11. Wetland=66,98,1
Fig. 3.12. Infiltration=67,99,1
Fig. 3.13. Infiltration Trench=67,99,1
Fig. 3.14. Schematic Diagram Of Stormtreat=70,102,1
Fig. 3.15. Schematic Diagram Of Stormfilter=71,103,1
Fig. 3.16. Linear Type Stormfilter(a), Precast Type Stormfilter(b)=72,104,1
Fig. 3.17. Gravity Oil/Water Separator=73,105,1
Fig. 3.18. CPI Separator=73,105,1
Fig. 3.19. Schematic Diagram Stormceptor=74,106,1
Fig. 3.20. Type Of Stormceptor=76,108,1
Fig. 4.1. Variation Of Vehicles=80,113,1
Fig. 4.2. Main Road In Korea Institution Of Construction Technology=81,114,1
Fig. 4.3. Parking Lot In Korea Institution Of Construction Technology=81,114,1
Fig. 4.4. A Model Road For Rain Intensity Experiment=83,116,1
Fig. 4.5. An Asphalt Road Surface Manufactured For Experiment=83,116,1
Fig. 4.6. Expanded Polypropylene(J-P)=84,117,1
Fig. 4.7. Porous Sponge(B-P)=85,118,1
Fig. 4.8. Polypropylene Fiber(P-F)=85,118,1
Fig. 4.9. Up-Flow Filtering Tower=86,119,1
Fig. 4.10. Ecotank®(1/4 Scale Down)=87,120,1
Fig. 4.11. Schematic Diagram Of Ecotank®(Patent Registration 0431862)=88,121,1
Fig. 4.12. Media Column Of Ecotank®=88,121,1
Fig. 4.13. Field Scale Treatment Installation=89,122,1
Fig. 4.14. Photogaraph Of Detail Parts In Ecotank®=90,123,1
Fig. 4.15. Efficiency Test For Field Scale Treatment Installation=91,124,1
Fig. 4.16. Retention Basin For First Flush=92,125,1
Fig. 4.17. EcoTank®(For Concrete)=93,126,1
Fig. 4.18. EcoTank®(Inside)=93,126,1
Fig. 4.19. Mold Usde For Manufacture=94,127,1
Fig. 4.20.(A) Photograph Of EcoTank® Construction Work=94,127,1
Fig. 4.20.(B) Photograph Of EcoTank® Construction Work=95,128,1
Fig. 4.21. Photograph Of EcoTank®=96,129,1
Fig. 4.22. Daily Rain Volume=98,131,1
Fig. 4.23. Average SS Conc. Of Initial Rain=99,132,1
Fig. 4.24. Heavy Metals Conc. Of Initial Rain=101,134,1
Fig. 4.25. Relationship Between SS Conc. And Heavy Metals In Stormwater Runoff=103,136,1
Fig. 4.26. Pollutant Emission At Increase Of Water Quality=106,139,1
Fig. 4.27. 30x30 Model Road; Before Experiment(a), On Experiment(b)=106,139,1
Fig. 4.28. Characteristics Of SS Effluent At Rain Intensity=108,141,1
Fig. 4.29. PAHs Removal Rate Using J-P=110,143,1
Fig. 4.30. PAHs Removal Rate Using B-P=112,145,1
Fig. 4.31. PAHs Removal Rate Using P-F=114,147,1
Fig. 4.32. Schematic Diagram Of Treatment Reactor=117,150,1
Fig. 4.33. Variation Of SS Removals Of Media Respectively At Rain Intensity=119,152,1
Fig. 4.34.(A) Variation Of Heavy Metal Removals Of Media Respectively At Rain Intensity=119,152,1
Fig. 4.34.(B) Variation Of Heavy Metal Removals Of Media Respectively At Rain Intensity=120,153,1
Fig. 4.35. Variation Of Heavy Metal At Rain Intensity(J-P)=120,153,1
Fig. 4.36. Variation Of Heavy Metal At Rain Intensity(P-F, B-P)=121,154,1
Fig. 4.37. Variation Of PAHs Conc. At Rain Intensity(J-P)=122,155,1
Fig. 4.38. Variation Of PAHs Conc. At Rain Intensity(P-F)=123,156,1
Fig. 4.39. Variation Of PAHs Conc. At Rain Intensity(B-P)=123,156,1
Fig. 4.40. SS Removal Efficiency Using Media Respectively=125,158,1
Fig. 4.41. Removal Efficiencies Of Pb And Zn During 24hrs Operation(J-P)=127,160,1
Fig. 4.42. Removal Efficiencies Of Cr, Cd And Cu During 24hrs Operation(J-P)=127,160,1
Fig. 4.43. Removal Efficiencies Of Pb And Zn During 24hrs Operation(P-F)=127,160,1
Fig. 4.44. Removal Efficiencies Of Cr, Cd And Cu During 24hrs Operation(P-F)=128,161,1
Fig. 4.45. Removal Efficiencies Of Pb And Zn During 24hrs Operation(B-P)=128,161,1
Fig. 4.46. Removal Efficiencies Of Cr, Cd And Cu During 24hrs Operation(B-P)=128,161,1
Fig. 4.47. Comparison On Adsorption Capacity Of Media After 24hrs Operation=129,162,1
Fig. 4.48. Variation Of PAHs Conc. During Continuous Operation(J-P)=131,164,1
Fig. 4.49. Variation Of PAHs Conc. During Continuous Operation(P-F)=132,165,1
Fig. 4.50. Variation Of PAHs Conc. During 24hrs Operation(B-P)=133,166,1
Fig. 4.51. SS Removal Rate Of J-P And P-F At Rain Intensity=134,167,1
Fig. 4.52. Heavy Metal Removal Rate Of J-P And P-F=135,168,1
Fig. 4.53. Removal Rate Of Heavy Metal Using Expanded Polypropylene At Field Scale Installation=136,169,1
Fig. 4.54. Variation Of PAHs At Rain Intensity Using Field Scale Installation(J-P)=136,169,1
Fig. 4.55. Variation Of PAHs At Rain Intensity Using Field Scale Installation(P-F)=137,170,1
Fig. 4.56. SS Removal Rate At Rain Intensity=139,172,1
Fig. 4.57. T-P Removal Rate At Rain Intensity=139,172,1
Fig. 4.58. CODcr Removal Rate At Rain Intensity=140,173,1
Fig. 4.59. Heavy Metal Removal Rate At Rain Intensity=141,174,1
Fig. 4.60. Removal Of SS Conc. In EcoTank® On Sewage=143,176,1
Fig. 4.61. Removal Of CODcr In EcoTank® On Sewage=144,177,1
Fig. 4.62. Removal Of DOC In EcoTank® On Sewage=144,177,1
Fig. 4.63. Characteristics Of EcoTank® On Runoff(T-P, SS, COD)(2004/11/01)=147,180,1
Fig. 4.64. Characteristics Of EcoTank® On Runoff(Heavy Metal)(2004/11/01)=147,180,1
Fig. 4.65. Characteristics Of EcoTank® On Runoff(T-P, SS, COD)(2004/11/05)=149,182,1
Fig. 4.66. Characteristics Of EcoTank® On Runoff(Heavy Metal)(2004/11/05)=149,182,1
Fig. 4.67. Characteristics Of EcoTank® On Runoff(T-P, SS, COD)(2004/11/10)=151,184,1
Fig. 4.68. Characteristics Of EcoTank® On Runoff(Heavy Metal)(2004/11/10)=151,184,1
Fig. 4.69. Characteristics Of EcoTank® On Runoff(T-P, SS, COD)(2004/11/18)=153,186,1
Fig. 4.70. Characteristics Of EcoTank® On Runoff(Heavy Metal)(2004/11/18)=153,186,1
Fig. 4.71. Removal Of SS In EcoTank® On Runoff(2005/04/06)=154,187,1
Fig. 4.72. Removal Of CODcr In EcoTank® On Runoff(2005/04/06)=155,188,1
Fig. 4.73. Removal Of T-P In EcoTank® On Runoff(2005/04/06)=156,189,1
Fig. 4.74. Removal Of T-N In EcoTank® On Runoff(2005/04/06)=157,190,1
Fig. 4.75. Removal Of Heavy Metal In EcoTank® On Runoff(2005/04/06)=158,191,1
Fig. 4.76. Removal Of SS In EcoTank® On Runoff(2005/05/05)=159,192,1
Fig. 4.77. Removal Of CODcr In EcoTank® On Runoff(2005/05/05)=160,193,1
Fig. 4.78. Removal Of T-P In EcoTank® On Runoff(2005/05/05)=161,194,1
Fig. 4.79. Removal Of T-N In EcoTank® On Runoff(2005/05/05)=162,195,1
Fig. 4.80. Removal Of Heavy Metal In EcoTank® On Runoff(2005/05/05)=163,196,1
Fig. 4.81. Removal Of TOC In EcoTank® On Runoff(2005/05/05)=164,197,1
Fig. 4.82. Removal Of DOC In EcoTank® On Runoff(2005/05/05)=164,197,1
Fig. 4.83. Removal Of SS In EcoTank® On Runoff(2005/05/11)=165,198,1
Fig. 4.84. Removal Of CODcr In EcoTank® On Runoff(2005/05/11)=166,199,1
Fig. 4.85. Removal Of T-P and T-N In EcoTank® On Runoff(2005/05/11)=167,200,1
Fig. 4.86. Removal Of Heavy Metal In EcoTank® On Runoff(2005/05/11)=168,201,1
Fig. 4.87. Removal Of TOC And DOC In EcoTank® On Runoff(2005/05/11)=169,202,1
Fig. 4.88. Removal Of SS In EcoTank® On Runoff(2005/05/17)=170,203,1
Fig. 4.89. Removal Of CODc In EcoTank® On Runoff(2005/05/17)=171,204,1
Fig. 4.90. Removal Of T-N and T-N In EcoTank® On Runoff(2005/05/17)=172,205,1
Fig. 4.91. Removal Of Heavy Metal In EcoTank® On Runoff(2005/05/17)=173,206,1
Fig. 4.92. Removal Of TOC And DOC In EcoTank® On Runoff(2005/05/17)=174,207,1
Fig. 4.93. Non-Power Driven Treatment Apparatus For Surface Drainage(Patent Registration 3357071)=178,211,1
Fig. 4.94. EcoTank®(Patent Registration 3357071)=179,212,1
Fig. 4.95. A Schematic Diagram Of Treatment From Road Runoff By EcoTank=180,213,1
Fig. 4.96. A Schematic Diagram Of Treatment For First Flush From Road Runoff=181,214,1
Fig. 4.97. Maintenance Procedure=201,234,1
Fig. 4.98. Maintenance Of EcoTank=202,235,1
영문목차
[title page etc.]=0,1,7
Summary=vii,8,5
Contents=xii,13,17
Chapter 1. Introduction=xxix,30,1
Paragraph 1. Purposes And Necessities=1,31,1
1. Necessities=1,31,2
2. Purposes=3,33,4
Paragraph 2. Tasks And Scopes=7,37,1
Paragraph 3. Study System=8,38,1
Chapter 2. Status Of Current Technologies=8-1,39,1
Paragraph 1. Technical And Political Development=9,40,1
1. Change Of Policy In Korea=9,40,3
2. Change Of Policy In Other Country=12,43,6
Paragraph 2. Previous Study=17,48,1
1. Change Of Study In Korea=17,48,3
2. Change Of Study In Other Country=19,50,6
Chapter 3. Theoretical Study=24-1,56,1
Paragraph 1. Definition Of Non-Point Source=25,57,1
1. Characteristics Of Non-Point Source=25,57,3
2. Influence On Water Quality By Non-Point Source=27,59,6
Paragraph 2. Emission Type Of Non-Point Source=32,64,1
1. Urban(Industrial) Area=33,65,1
2. Agricultural Area=33,65,2
3. Forest=34,66,2
4. Road=35,67,2
5. River=36,68,1
6. Other Areas=37,69,1
Paragraph 3. Characteristics Of Non-Point Source In Urban Area=38,70,1
1. Characteristics Of Non-Point Source In Urban Area=38,70,4
2. Compositions Of Non-Point Source=42,74,13
Paragraph 4. Non-Point Source Management Technology And Plant=55,87,1
1. Non-Point Source Management Technology=55,87,1
2. Effect On Non-Point Source Management Technology=55,87,3
3. Non Point Source Treatment Pilot=57,89,21
Chapter 4. Methods And Results=77-1,110,1
Paragraph 1. Methods Of Research=78,111,1
1. Introduction=78,111,2
2. Selection Of Study Area=79,112,3
3. Methods=82,115,15
Paragraph 2. Results=97,130,1
1. Characteristics Of Stormwater Runoff Quality=97,130,6
2. Evaluation Of Stormwater Runoff Characteristics=103,136,1
3. Evaluation Of Design Rain Intensity Selection=104,137,5
4. Evaluation Of Media Performance=109,142,8
5. Examination Of Hydro Profile At Installation=116,149,2
6. Removal Rate Of Ecotank® At Rain Intensity=117,150,8
7. Performance Of Ecotank®(1/4 down size)=124,157,10
8. Performance Of Field Scale Ecotank®=134,167,4
9. Application Test On Field=138,171,37
10. Assessment Of Application To Field=175,208,2
Paragraph 3. Development Of Non-Power Driven Treatment(Ecotank)=177,210,1
1. Characteristics Of EcoTank®=177,210,3
2. Schematic Diagram Of EcoTank® For Treatment On Runoff=180,213,2
3. Treatment Wolume And Runoff Collecting Area For Design Of Ecotank®=182,215,1
4. Specification Of EcoTank®=183,216,1
5. Design Of EcoTank®=184,217,13
6. Installation Of EcoTank®=197,230,2
Paragraph 4. Guidline Of Maintenance=199,232,1
1. Maintenance Plan=199,232,2
2. Maintenance Procedure=200,233,2
3. Maintenance Of EcoTank=201,234,3
4. Management Of EcoTank=204,237,1
5. Sediment Management=204,237,1
6. Media Using Period=204,237,1
7. The Disposal Of Used Media=205,238,1
8. The Mission Of Manager=205,238,1
9. EcoTank Maintenance Guideline=206,239,1
Chapter 5. Conclusion=206-1,240,6
Chapter 6. Degree Of Achievement And Contribution=211-1,246,7
Chapter 7. Application Plan Of Research Results=217-1,253,3
Chapter 8. Reference=219-1,256,7
jpg
Fig. 3.9. Wet Expanded Detention Pond=65,97,1
Fig. 3.10. Wet Pond=65,97,1
Fig. 3.11. Wetland=66,98,1
Fig. 3.12. Infiltration=67,99,1
Fig. 3.13. Infiltration Trench=67,99,1
Fig. 4.47. Comparison On Adsorption Capacity Of Media After 24hrs Operation=129,162,1
Fig. 4.48. Variation Of PAHs Conc. During Continuous Operation(J-P)=131,164,1
Fig. 4.49. Variation Of PAHs Conc. During Continuous Operation(P-F)=132,165,1
Fig. 4.50. Variation Of PAHs Conc. During 24hrs Operation(B-P)=133,166,1
*표시는 필수 입력사항입니다.
| 전화번호 |
|---|
| 기사명 | 저자명 | 페이지 | 원문 | 기사목차 |
|---|
| 번호 | 발행일자 | 권호명 | 제본정보 | 자료실 | 원문 | 신청 페이지 |
|---|
도서위치안내: / 서가번호:

우편복사 목록담기를 완료하였습니다.
*표시는 필수 입력사항입니다.
저장 되었습니다.
