

 대표어
권호기사보기
| 기사명 | 저자명 | 페이지 | 원문 | 기사목차 |
|---|
결과 내 검색
동의어 포함
목차
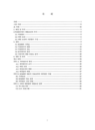
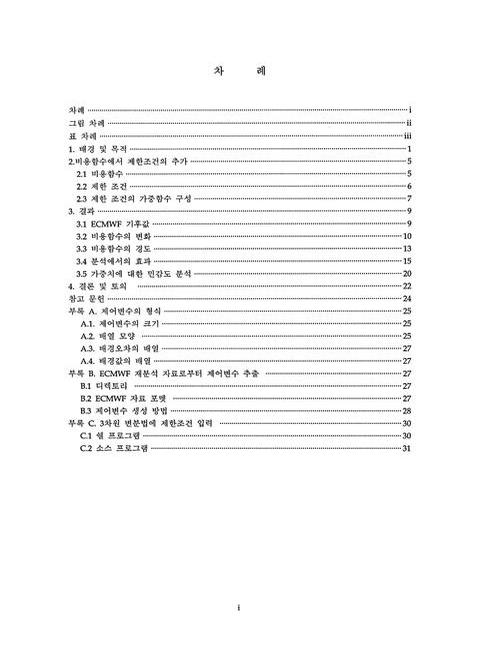
[표제지]=0,1,1
차례=i,2,1
그림차례=ii,3,1
표차례=iii,4,1
1. 배경 및 목적=1,5,4
2. 비용함수에서 제한조건의 추가=5,9,1
2.1. 비용함수=5,9,1
2.2. 제한 조건=6,10,2
2.3. 제한 조건의 가중함수 구성=7,11,2
3. 결과=9,13,1
3.1. ECMWF 기후값=9,13,2
3.2. 비용함수의 변화=10,14,4
3.3. 비용함수의 경도=13,17,3
3.4. 분석에서의 효과=15,19,5
3.5. 가중치에 대한 민감도 분석=20,24,3
4. 결론 및 토의=22,26,2
참고문헌=24,28,1
부록 A. 제어변수의 형식=25,29,1
A.1. 제어변수의 크기=25,29,1
A.2. 배열 모양=25,29,3
A.3. 배경오차의 배열=27,31,1
A.4. 배경값의 배열=27,31,1
부록 B. ECMWF 재분석 자료로부터 제어변수 추출=27,31,1
B.1. 디렉토리=27,31,1
B.2. ECMWF 자료 포멧=27,31,2
B.3. 제어변수 생성 방법=28,32,3
부록 C. 3차원 변분법에 제한조건 입력=30,34,1
C.1. 쉘 프로그램=30,34,2
C.2. 소스 프로그램=31,35,3
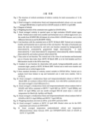
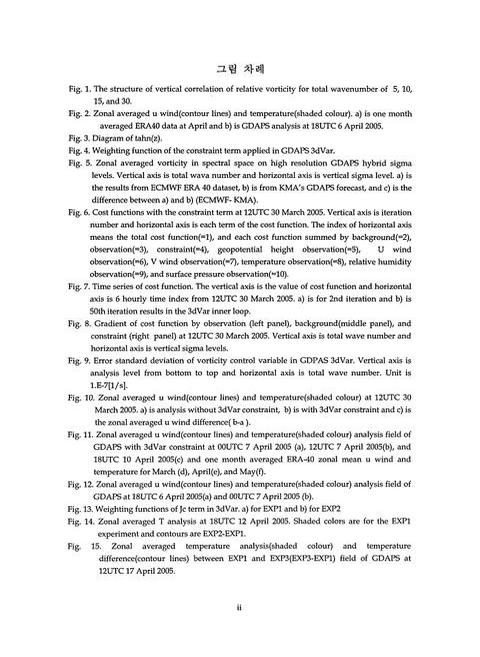
Fig.1. The Structure Of Vertical Correlation Of Relative Vorticity For Total Wavenumber Of 5, 10, 15, And 30=4,8,1
Fig.2. Zonal Averaged U Wind(Contour Lines) And Temperature(Shaded Colour). a) Is One Month Averaged ERA40 Data At April And b) Is GDAPS Analysis At 18UTC 6 April 2005=4,8,1
Fig.3. Diagram Of Tahn(z)=7,11,1
Fig.4. Weighting Function Of The Constraint Term Applied In GDAPS 3dVar=8,12,1
Fig.5. Zonal Averaged Vorticity In Spectral Space On High Resolution GDAPS Hybrid Sigma Levels. Vertical Axis Is Total Wava Number And Horizontal Axis Is Vertical Sigma Level. a) Is The Results From ECMWF ERA 40 Dataset, b) Is From KMA's GDAPS Forecast=10,14,1
Fig.6. Cost Functions With The Constraint Term At 12UTC 30 March 2005. Vertical Axis Is Iteration Number And Horizontal Axis Is Each Term Of The Cost Function. The Index Of Horizontal Axis Means The Total Cost Function(=1)=11,15,1
Fig.7. Time Series Of Cost Function. The Vertical Axis Is The Value Of Cost Function And Horizontal Axis Is 6 Hourly Time Index From 12UTC 30 March 2005. a) Is For 2nd Iteration And b) Is 50th Iteration Results In The 3dVar Inner Loop=12,16,1
Fig.8. Gradient Of Cost Function By Observation(Left Panel), Background(Middle Panel), And Constraint(Right Panel) At 12UTC 30 March 2005. Vertical Axis Is Total Wave Number And Horizontal Axis Is Vertical Sigma Levels=14,18,1
Fig.9. Error Standard Deviation Of Vorticity Control Variable In GDPAS 3dVar. Vertical Axis Is Analysis Level From Bottom To Top And Horizontal Axis Is Total Wave Number. Unit Is 1.E-7[1/s]=15,19,1
Fig.10. Zonal Averaged U Wind(Contour Lines) And Temperature(Shaded Colour) At 12UTC 30 March 2005. a) Is Analysis Without 3dVar Constraint, b) Is With 3dVar Constraint And c) Is The Zonal Averaged U Wind Difference(b-a)=16,20,1
Fig.11. Zonal Averaged U Wind(Contour Lines) And Temperature(Shaded Colour) Analysis Field Of GDAPS With 3dVar Constraint At 00UTC 7 April 2005 (a),12UTC 7 April 2005(b), And 18UTC 10 April 2005(c) And One Month Averaged ERA-40 Zonal Mean U Wind And Tempe=18,22,1
Fig.12. Zonal Averaged U Wind(Contour Lines) And Temperature(Shaded Colour) Analysis Field Of CDAPS At 18UTC 6 April 2005(a) And 00UTC7 April 2005(b)=19,23,1
Fig.13. Weighting Functions Of Jc Term In 3dVar. a) For EXP1 And b) For EXP2=20,24,1
Fig.14. Zonal Averaged T Analysis At 18UTC 12 April 2005. Shaded Colors Are For The EXP1 Experiment And Contours Are EXP2-EXP1=21,25,1
Fig.15. Zonal Averaged Temperature Analysis(Shaded Colour) And Temperature Difference(Contour Lines) Between EXP1 And EXP3(EXP3-EXP1) Field Of GDAPS At 12UTC 17 April 2005=22,26,1
*표시는 필수 입력사항입니다.
| 전화번호 |
|---|
| 기사명 | 저자명 | 페이지 | 원문 | 기사목차 |
|---|
| 번호 | 발행일자 | 권호명 | 제본정보 | 자료실 | 원문 | 신청 페이지 |
|---|
도서위치안내: / 서가번호:

우편복사 목록담기를 완료하였습니다.
*표시는 필수 입력사항입니다.
저장 되었습니다.
