
 대표어
대표어



권호기사보기
| 기사명 | 저자명 | 페이지 | 원문 | 기사목차 |
|---|
결과 내 검색
동의어 포함
목차
[표제지]=0,1,1
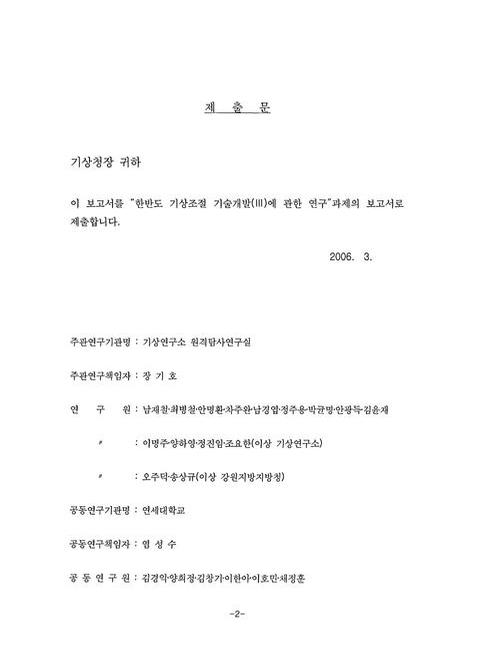
제출문=2,2,1
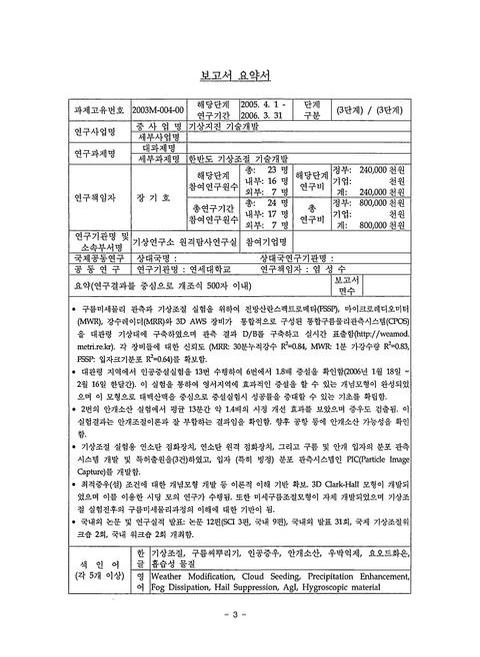
보고서 요약서=3,3,2
요약문=5,5,4
Summary=9,9,4
목차=13,13,2
Contents=15,15,2
List Of Tables=17,17,2
List Of Figures=19,19,4
제1장 연구개발과제의 개요=23,23,1
제2장 국내외 기술개발 현황=24,24,1
제1절 최근 국내외 기상조절 분야의 환경변화=24,24,2
제2절 최근 국외 기상조절 연구 및 실험 실시 현황=25,25,3
제3장 기술개발 수행 내용 및 결과=28,28,1
제1절 구름물리관측시스템 개발=28,28,1
1. 전방산란스펙트로메타를 이용한 안개입자 측정=28,28,14
2. 마이크로레디오미터(Microwave Radiometer, MWR)를 이용한 가강수량 및 구름수액량 측정=41,41,7
3. 마이크로강수레이더(Micro Rain Radar, MRR)를 이용한 수적프로파일 측정=48,48,6
4. 초음파 풍향풍속계(3D AWS, Ultrasonic Anemometer)를 이용한 수직 바람장의 측정=54,54,4
5. 구름관측시스템(Cloud Physic Observation System, CPOS) 구축=57,57,7
제2절 기상조절 가능성 실험=64,64,1
1. 안개소산(Fog Dissipation) 실험 실시 및 결과 분석=64,64,8
2. 동계 인공증설 실험 실시 및 결과 분석=72,72,25
3. 2002년 인공증우 항공실험의 결과 재분석=97,97,3
제3절 기상조절 이론 및 신장비 개발=100,100,1
1. 기상조절 개념모형 프레임 개발=100,100,2
2. 기상조절실험 및 관측용 신장비 개발=102,102,5
제4장 목표달성도 및 관련분야에의 기여도=107,107,1
제5장 연구개발결과의 활용계획=108,108,1
제6장 연구개발과정에서 수집한 해외과학기술정보=109,109,1
제1절 중국의 기상조절 연구상황 정보=109,109,1
제2절 Mobile Integrated Profiling System=109,109,2
제7장 참고문헌=111,111,3
AppendixI : 인공증우(설) 지상실험 메뉴얼=114,114,17
위탁과제(제목없음)=131,131,1
제출문=131,131,2
보고서 요약서=133,133,2
요약문=135,135,4
Summary=139,139,4
목차=143,143,2
Contents=145,145,2
List Of Tables=147,147,1
List Of Figures=148,148,5
제1장 서론=153,153,1
제1절 기술개발의 배경 및 필요성=153,153,2
제2장 국내ㆍ외 기술개발 현황=155,155,1
제1절 국외 기술개발 현황=155,155,1
제2절 국내 기술개발 현황=155,155,2
제3절 국내ㆍ외 기술개발 현황에서 차지하는 위치=156,156,1
제3장 기술개발수행 내용 및 결과=157,157,1
제1절 인공증우(설) 실험 시기, 방법 및 지역 선정=157,157,1
1. 한반도의 기후학적인 강수특성=157,157,1
2. 인공증우(설) 실험 시기, 방법 및 지역 선정=157,157,2
제2절 실험 지역의 강수 특성=158,158,1
1. 강수 분포 특성=158,158,4
2. 강수분포 유형 구분=162,162,11
3. 액체수 연직총량(Liquid Water Depth, LWD)=173,173,3
제3절 UHF 레이더를 이용한 강설운의 특성분석 및 운정고도 추정=176,176,1
1. 분석자료=176,176,1
2. 배경 이론 및 분석 방법=176,176,8
3. 분석 결과=183,183,23
제4절 수치모형연구=205,205,1
1. 구름모형=205,205,8
2. 중규모 수치모형=213,213,11
제4장 기술개발목표 달성도 및 대외기여도=224,224,1
제1절 인공증우(설) 실험 시기, 방법 및 지역 선정=224,224,1
제2절 실험 지역의 강수 특성=224,224,1
제3절 UHF 레이더를 이용한 강설운의 특성분석 및 운정고도 추정=224,224,2
제4절 수치모형연구=225,225,1
제5장 기술개발결과의 활용계획=226,226,1
제1절 인공증우(설) 실험 시기, 방법 및 지역 선정=226,226,1
제2절 실험 지역의 강수 특성=226,226,1
제3절 UHF 레이더를 이용한 강설운의 특성분석 및 운정고도 추정=226,226,2
제4절 수치모형연구=227,227,1
제6장 연구개발과정에서 수집한 해외과학기술정보=228,228,1
제1절 인공증우(설) 실험 시기, 방법 및 지역 선정=228,228,1
제2절 실험 지역의 강수 특성=228,228,1
제3절 UHF 레이더를 이용한 강설운의 특성분석 및 운정고도 추정=228,228,2
제4절 수치모형연구=229,229,1
제7장 참고문헌=230,230,4
Fig.3.1.1. Microphysical Characteristics Of Fog Droplets At Daegwallyeong Site According To Wind Direction(2004)=35,35,1
Fig.3.1.2. A Comparison Of Fog Droplets Size Distribution Between (a) Each Easterly Wind Fog Event And (b) Each Westerly Wind Fog Event At Daegwallyeong Site In 2003=38,38,1
Fig.3.1.3. Same As Fig.3.1.2. Except In 2004=38,38,1
Fig.3.1.4. Same As Fig.3.1.2. Except In 2005=39,39,1
Fig.3.1.5. A Comparison Of Fog Droplets Size Distribution Between All Easterly Wind Fogs And Westerly Wind Fogs At Daegwallyeong Site (a) In 2003, (b) In 2004, (c) In 2005 And (d) Total Period=40,40,1
Fig.3.1.6. Time Series Of PWV-MWR(Dash Line) And LWP-MWR(Solid Line) From The MWR For 3-9 April 2004. The Triangles Are PWV-RS Derived By Integrating Radiosonde Soundings. The Bars Indicate Amount Of Precipitation=46,46,1
Fig.3.1.7. Scatter Plot Of The PWV Calculated By The MWR Against That Derived From Radiosonde For (a) Clear Sky(Cross) And (b) Cloud Sky(Circle) Conditions For Dec. 2003-Apr. 2004=46,46,1
Fig.3.1.8. Distribution Of Hourly Mean Of Precipitable Water Vapor And Liquid Water In Observation Period=47,47,1
Fig.3.1.9. Surface 60 Min. Cumulative Rainfall From AWS Versus MRR 60 Min. Cumulative Rainfall At (a) 75m, (b) 375m, (c) 675m And (d) 975m Height=50,50,1
Fig.3.1.10. Comparison Of (a) 15min, (b) 20min, (c) 30min And (d) 60min Cumulative Rainfall From AWS And MRR=50,50,1
Fig.3.1.11. (a) PPI At GwangDuksan Radar And The Vertically Profiles Of (a) Reflectivity, (b) Rain Rate, (c) Liquid Water Content And (d) Fall Velocity On 0630 LST 19 Sep. 2005=53,53,1
Fig.3.1.12. Ultrasonic Anemometer Installed In Daegwallyeong=53,53,1
Fig.3.1.13. Time Series Of Wind Direction(Square), Horizontal Wind Speed(Dash Line) And Vertical Wind Speed(Solid Line) From The Ultrasonic Anemometer USA-1 For (a) 18 Jan 2006, (b) 18 Jan 2006=56,56,1
Fig.3.1.14. The Classification Of Airborne Particle Sizes(㎛)=59,59,1
Fig.3.1.15. The Daegwallyeong Cloud Physics Observation Site=59,59,1
Fig.3.1.16. The Main Frame Of CPOS.=61,61,1
Fig.3.1.17. The Image Of Instruments Installed At Daegwallyeong Site=61,61,1
Fig.3.1.18. The Image Of Instruments Installed At Daegwallyeong Site=63,63,1
Fig.3.2.1. Number Of The Airplane Delay And Cancel During The Period From 2000 To 2005=65,65,1
Fig.3.2.2. Fairchild AFB Airforce Airport, Washington, Vardiman Et Al, 1970=65,65,1
Fig.3.2.3. The (a) Location Of The Daegwallyeong Supersite And The (b) CPOS In The Site. In (b), The Seeding Paths Used In The First And Second Experiments Are Schematically Shown=66,66,1
Fig.3.2.4. Temporal Variation Of The Fog-Droplet Number Concentration For The (a) First And (b) Second Seeding Experiment Of CaCl₂=69,69,1
Fig.3.2.5. Time Series Of The Precipitation And The Visibility Calculated From The FSSP Measurements For The (a) First And (b) Second Seeding Of CaCl₂. The Solid Line Is The Visibility And The Bars The Precipitation=69,69,1
Fig.3.2.6. Landscapes Of Cloud Seeding Control Area, Daegwallyeong=74,74,1
Fig.3.2.7. Synoptic Weather Forecast Chart For Surface On 21KST 18 Jan. 2006=78,78,1
Fig.3.2.8. GOES-9 Composite Asia Image On 21KST 18 Jan. 2006=78,78,1
Fig.3.2.9. Synoptic Weather Forecast Chart For Surface On 21KST 31 Jan. 2006=78,78,1
Fig.3.2.10. GOES-9 Composite Asia Image On 21KST 31 Jan. 2006=78,78,1
Fig.3.2.11. Synoptic Weather Forecast Chart For Surface On 21KST 15 Feb. 2006=78,78,1
Fig.3.2.12. GOES-9 Composite Asia Image On 21KST 15 Feb. 2006=78,78,1
Fig.3.2.13. Schematic Diagram Of Winter Weather Modification Experiment(Small Scale) From 18 Jan. 2006 To 15 Feb. 2006 At The Daegwallyeong Cloud Physical Observation System=80,80,1
Fig.3.2.14. Time Schedule Of Winter Weather Modification Experiment=82,82,1
Fig.3.2.15. Result Of Winter Weather Modification Experiment And Summary=84,84,1
Fig.3.2.16. Result Of Particle Image Capture And Small Scale Is Orignal Size=87,87,1
Fig.3.2.17. Synoptic Weather Forecast Chart For Surface On 12 KST 19 Jan. 2006=88,88,1
Fig.3.2.18. Pattern Of Barometric Low And Experiment Location Of Weather Modification=88,88,1
Fig.3.2.19. Topographical Impact Of Winter Weather Modification Experiment In Fog=88,88,1
Fig.3.2.20. Total Analysis Results Of Winter Weather Modification At Daegwallyeong On 18 Jan=89,89,1
Fig.3.2.21. Same As In Fig.3.2.20, But On 19 Jan. 2006=90,90,1
Fig.3.2.22. Same As In Fig.3.2.20, But On 19 Jan. 2006=91,91,1
Fig.3.2.23. Same As In Fig.3.2.20, But On 31 Jan. 2006=92,92,1
Fig.3.2.24. Same As In Fig.3.2.20, But On 1 Feb. 2006=93,93,1
Fig.3.2.25. Same As In Fig.3.2.20, But On 1 Feb. 2006=94,94,1
Fig.3.2.26. Same As In Fig.3.2.20, But On 15 Feb. 2006=95,95,1
Fig.3.2.27. Same As In Fig.3.2.20, But On 15 Feb. 2006=96,96,1
Fig.3.2.28. The Airplane Was Used To Seeding Experiments And Flying Path=99,99,1
Fig.3.2.29. PPI Of Guduksan Radar On Seeding Experiments=99,99,1
Fig.3.3.1. Micro Cloud Model(MCM) Simulation Results=101,101,1
Fig.3.3.2. Design Drawing Of Cloud And Fog Particle Distribution Observation System=105,105,1
Fig.3.3.3. Design Drawing Of Ignition Apparatus Of Hygroscopic Flare For Weather Modification Experiment=105,105,1
Fig.3.3.4. Design Drawing Of Remote Control Ignition Apparatus Of Hygroscopic Flare For Weather Modification Experiment=106,106,1
Fig.6.1.1. The Schematic Near-Future Experimental Plan Of Ji Lin Weather Modification Center=110,110,1
Fig.6.2.1. Equipments Of Mobile Integrated Profiling System(MIPS)=110,110,1
Fig.3.1.1. Thirty Years(1971-2000) Average Monthly Precipitation(Vertical Bar) And The Departure From The Averages In 2001(Solid Line) Measured At 68 Weather Stations In Korea[내용누락;p.160]=160,160,1
Fig.3.2.1. Distribution Of Wintertime(Novembermarch) Average Precipitation For Eight Years(1997-2004) In Gangwon Province. The Name 'DAE' Represents Daegwallyeong Weather Station=160,160,1
Fig.3.2.2. Distribution Of Wintertime(November-March) Precipitation According To The Wind Direction From 1981 To 2004[내용누락;p.161]=161,161,1
Fig.3.2.3. Examples Of Precipitation Distribution Pattern, Yeong-Dong(YD) Type (a) And Yeong-Seo(YS) Type (b). Dots Indicate The Location Of ASOS[내용누락;p.161]=161,161,1
Fig.3.2.4. Weather Map At The Surface (a) And 850mb (b) At 00 UTC 15 Jan. 1998=164,164,1
Fig.3.2.5. Vertical Soundings Of Temperature, Dewpoint Temperature, Wind Direction And Wind Speed At 00 UTC 15 Jan. 1998 At Daegwallyeong. The Profiles Are Obtained From NCEP-DOE Reanalysis-2=165,165,1
Fig.3.2.6. Same As Fig.3.2.4. But At 00 UTC 9 Dec. 2002=167,167,1
Fig.3.2.7. Same As Fig.3.2.5. But At 00 UTC 9 Dec. 2002=168,168,1
Fig.3.2.8. Same As Fig.3.2.4. But At 00 UTC 22 Dec. 1997=169,169,1
Fig.3.2.9. Same As Fig.3.2.5. But At 00 UTC 22 Dec. 1997=170,170,1
Fig.3.2.10. Wind Frequency Roses For The YD Type(Left) And YS Type(Right) Precipitation Pattern At 850 mb Altitude At Daegwallyeong=172,172,1
Fig.3.2.11. Relative Frequency Of Liquid Water Depth(Vertical Bar) And The Relative Precipitation Frequency For Each Liquid Water Depth Bin(Line) At Daegwallyeong=175,175,1
Fig.3.3.1. Locations Of Sokcho Radiosonde(●) And Gangneung UHF Radar Sites(■)=177,177,1
Fig.3.3.2. Location And Photograph Of UHF Radar In Kangnung National University=178,178,1
Fig.3.3.3. Schematic View Of Bragg Scattering By Isotropic Turbulent Layers, Fresnel Scattering By Strong Static STableLayers And Rayleigh Scattering By Precipitation In The Atmosphere=178,178,1
Fig 3.3.4. Variation Of SNR With Time & Height From 25 To 26 Feb. 2005=186,186,1
Fig.3.3.5. Schematic Diagram Of Ground-Base Seeding Model At Daegwallyeong=186,186,1
Fig.3.3.6. Weather Maps At (a)Surface (b)850hPa At 0000UTC On 4 Mar. 2005=187,187,1
Fig.3.3.7. IR Images At (a)0400 KST 4 Mar. 2005, (b)1130 KST, And (c)2000 KST 5 Mar. 2005=188,188,1
Fig.3.3.8. Temporal Variation Of Snowfall Amount(㎝) Per Hour From 4 To 5 Mar. 2005=190,190,1
Fig.3.3.9. Temporal Variation Of SNR Maximums. The Red Line Is The SNR Maximum Value And The Blue Line Is The Height Of The SNR Absolute Maximum. The Green=190,190,1
Fig.3.3.10. Temporal Variation Of Vertical Wind Speed At (a)500m, (b)1000m From 4 To 5 Mar. 2005. The Vertical Dashed Lines Of Green And Violet Indicate The Beginning And End Of The Snowfall, Respectively=192,192,1
Fig.3.3.11. Temporal Variation Of Wind Direction And Speed At (a)500m, (b)1000m From 4 To 5 Mar. 2005. The Red, And ,Blue Solid Lines Are Each Wind Direction, And Speed=193,193,1
Fig.3.3.12. Atmospheric Soundings From Sokcho At 0300 KST(Blue) And 0900 KST(Red) 4 Mar. 2005=194,194,1
Fig.3.3.13. Variation Of SNR With Time & Height From 4 To 5 Mar. 2005=194,194,1
Fig.3.3.14. Distribution Of Cloud Top Heights At (a)0225 KST, And (b)0901 KST 4. Mar. 2005, And (c)1810 KST, And (d)2025 KST 5. Mar. 2005=195,195,1
Fig.3.3.15. Weather Maps At (a)Surface (b)850hPa At 0000UTC On 24 Mar. 2005=197,197,1
Fig.3.3.16. IR Images At (a)0200 KST 4 Mar. 2005, (b)1000 KST, And (c)2100 KST 24 Mar. 2005=198,198,1
Fig.3.3.17. Temporal Variation Of Snowfall Amount(㎝) Per Hour On 24 Mar. 2005=200,200,1
Fig.3.3.18. Temporal Variation Of SNR Maximums. The Red Line Is The SNR Maximum Value And The Blue Line Is The Height Of The SNR Absolute Maximum. The Green=200,200,1
Fig.3.3.19. Temporal Variation Of Vertical Wind Speed At (a)500m, (b)1000m On 24 Mar. 2005. The Vertical Dashed Lines Of Green And Violet Indicate The Beginning And End Of The Snowfall, Respectively=201,201,1
Fig.3.3.20. Temporal Variation Of Wind Direction And Speed At (a)500m, (b)1000m On 24 Mar. 2005. The Red, And ,Blue Solid Lines Are Each Wind Direction, And Speed=202,202,1
Fig.3.3.21. Atmospheric Soundings From Sokcho At 0300 KST(Blue) And 0900 KST(Red) 24 Mar. 2005=203,203,1
Fig.3.1.22. Variation Of SNR With Time & Height On 24 Mar. 2005=203,203,1
Fig.3.3.23. Distribution Of Cloud Top Heights At (a)0025 KST, And (b)0901 KST , (c)1801 KST, And (d)2101 KST 24. Mar. 2005=204,204,1
Fig.3.4.1. Comparisons Of Integration Time And Domain Averaged Liquid Water Mixing Ratio (g/㎏) As A Function Of Initially Calculated CAPE (a), As A Function Of PW (b), And As A Function Of FL-LCL=208,208,1
Fig.3.4.2. Time Series Of 1 Hourly Precipitation, 6 Hourly CAPE And FL-LCL Calculated Value For The Year 2002=209,209,1
Fig.3.4.3. Scatter Plot Of FL-LCL Height Vs. Precipitation Amount Below CAPE 700 J/㎏ (a) And Above (b)=209,209,1
Fig.3.4.4. Accumulated Precipitation Amounts At The Surface As Afunction Of Concentration Of Ice Particle Spraying, Time And Location Of Seeding In Case Of Shallow Convective Cloud=211,211,1
Fig.3.4.5. Seeding Location Dependence And Its Schematic Plot=211,211,1
Fig.3.4.6. Same As Fig.3.4.4. Except For Deep Convection=212,212,1
Fig.3.4.7. Topography And Model Domains. Outer Boundary Is For Domain 1 And Inner Boundary Is For Domain 2=215,215,1
Fig.3.4.8. Horizontal Cross SectionOf Seeding Dispersion At 0.36 ㎞ Above The Surface At 2 hr (a) And 9 hr (b) After Seeding. Contour Minimum And Interval Are 10 Pg m-3 And 50 Pg m-3, Respectively=220,220,1
Fig.3.4.9. Vertical Cross SectionThrough The Line AB In Fig.3.4.8. Of The Seeded Ice Nuclei Concentration At 2 hr (a) And 9 hr (b) After Seeding. Contour Minimum And Interval Are 10 Pg m-3 And 50 Pg m-3, Respectively(이미지참조)=220,220,1
Fig.3.4.10. Same As Fig.3.4.9. Except Cloud Water Mixing Ratio In Unseeded Simulation (a), Seeded Simulation (SD1) By AgI (b), Ice Crystal Mixing Ratio In Unseeded Simulation (c) And Seeded Simulation (SD1) By AgI (d) At 2 hr=221,221,1
Fig.3.4.11. Twelve Hour Accumulated Precipitation In The Unseeded Run(a, CTL) And Its Difference From Seeded Runs, SD1 (b), SD2 (c) And Sd3 (d) (Seeded-Unseeded)=222,222,1
Fig.3.4.12. Hourly Precipitation In CTL, SD1, SD2 And SD3 Runs For The 12 Hours Period=223,223,1
영문목차
[title page]=0,1,1
Submission Letters=2,2,1
Korean Abstract=3,3,2
Korean Summary=5,5,4
English Summar=9,9,4
Korean Content=13,13,2
English Contents=15,15,2
List Of Tables=17,17,2
List Of Figures=19,19,4
Chapter1. Overview Of The Project=23,23,1
Chapter2. Current Status Of The Technology=24,24,1
Section1. Big Environmental Changes Of Domestic And Foreign Techniques=24,24,2
Section2. Recent Weather Modification Programs Of Foreign Countries=25,25,3
Chapter3. Details And Results Of This Research=28,28,1
Section1. Development Of Cloud Physics Observation System(CPOS)=28,28,1
1. Observations Of Fog Characteristics With Forward Scattering Spectrometer Probe(FSSP)=28,28,14
2. Observations Of Water Vapor And Cloud Liquid Contents With Microwave Radiometer(MWR)=41,41,7
3. Observations Of Vertical Profiles With Micro Rain Radar(MRR)=48,48,6
4. Observations Of Vertical Wind Fields With Ultrasonic Anemometer(3DAWS)=54,54,4
5. Introduction Of Cloud Physics Observation System(CPOS)=57,57,7
Section2. Experiment For The Possibility Validation Of Weather Modification=64,64,1
1. Experiments Of Fog Dissipation And Analysis Of These Results=64,64,8
2. Experiments Of Winter Cloud Seeding And Analysis Of These Results=72,72,25
3. Reanalysis Of The 2002 Airborne Cloud Seeding Experiment=97,97,3
Section3. Weather Modification Theory And Development Of New Related Instruments=100,100,1
1. Development Of Basic Flames Of Theoretical Cloud Model=100,100,2
2. Development Of New Related Instruments=102,102,5
Chapter4. Achievements And Contribution=107,107,1
Chapter5. Application Plan Of The Output=108,108,1
Chapter6. Foreign Scientific And Technical Information Collected During This Research Period=109,109,1
Section1. Information About Chinese Weather Modification Research=109,109,1
Section2. Mobile Integrated Profiling System=109,109,2
Chapter7. References=111,111,3
AppendixI=114,114,17
[The Development Of Weather Modification Techniques In Korea(III) etc.]=131,131,1
Submission Letters=131,131,2
Korean Abstract=133,133,2
Korean Summary=135,135,4
English Summary=139,139,4
Korean Contents=143,143,2
English Contents=145,145,2
List Of Tables=147,147,1
List Of Figures=148,148,5
Chapter1. Introduction=153,153,1
Section1. Background=153,153,2
Chapter2. The Status Of Domestic And Foreign Technical Development=155,155,1
Section1. The Status Of Domestic Technical Development=155,155,1
Section2. The Status Of Foreign Technical Development=155,155,2
Section3. The Technical Position In The Status Of Domestic And Foreign Technical Development=156,156,1
Chapter3. Details And Results Of This Research=157,157,1
Section1. The Selection Of Period, Method And Region Of Cloud Seeding Experiment=157,157,1
1. Climatological Property Of Precipitation In The Korean Peninsula=157,157,1
2. The Selection Of Period, Method And Region Of Cloud Seeding Experiment=157,157,2
Section2. Property Of Precipitation In Experiment Region=158,158,1
1. Property Of Precipitation Distribution=158,158,4
2. Classification Of Type Of Precipitation Distribution=162,162,11
3. Liquid Water Depth=173,173,3
Section3. Analysis Of Property Of Ice Cloud And Estimation Of Cloud Top Level Using UHF Radar=176,176,1
1. Data=176,176,1
2. Background Theory And Methodology=176,176,8
3. Results=183,183,23
Section4. Numerical Model Study=205,205,1
1. Cloud Model=205,205,8
2. Mesoscale Model=213,213,11
Chapter4. Achievements And Contributions=224,224,1
Section1. The Selection Of Period, Method And Region Of Cloud Seeding Experiment=224,224,1
Section2. Property Of Precipitation In Experiment Region=224,224,1
Section3. Analysis Of Property Of Ice Cloud And Estimation Of Cloud Top Level Using UHF Radar=224,224,2
Section4. Numerical Model Study=225,225,1
Chapter5. Utilization Plans Of The Main Results=226,226,1
Section1. The Selection Of Period, Method And Region Of Cloud Seeding Experiment=226,226,1
Section2. Property Of Precipitation In Experiment Region=226,226,1
Section3. Analysis Of Property Of Ice Cloud And Estimation Of Cloud Top Level Using UHF Radar=226,226,2
Section4. Numerical Model Study=227,227,1
Chapter6. Foreign Scientific And Technical Information Collected During This Research Period=228,228,1
Section1. The Selection Of Period, Method And Region Of Cloud Seeding Experiment=228,228,1
Section2. Property Of Precipitation In Experiment Region=228,228,1
Section3. Analysis Of Property Of Ice Cloud And Estimation Of Cloud Top Level Using UHF Radar=228,228,2
Section4. Numerical Model Study=229,229,1
Chapter7. References=230,230,4
*표시는 필수 입력사항입니다.
| 전화번호 |
|---|
| 기사명 | 저자명 | 페이지 | 원문 | 기사목차 |
|---|
| 번호 | 발행일자 | 권호명 | 제본정보 | 자료실 | 원문 | 신청 페이지 |
|---|
도서위치안내: / 서가번호:

우편복사 목록담기를 완료하였습니다.
*표시는 필수 입력사항입니다.
저장 되었습니다.
